
Company Research ADMADeep Value Intelligence
ADMA Biologics Inc (ADMA) Deep Value Intelligence Report
阅读中文版 閱讀中文版 日本語で読む 한국어로 읽기 Leer en español Ler em português Auf Deutsch lesen

In briefNeutral3.37
As of Mar 25, 2026, DeepValues Research rates ADMA Biologics Inc (ADMA) Neutral (WATCH, score 3.37/5). Verdict: WATCH (with room for a small "tracking" position). Key figures: share price $10; P/E (TTM) 16.77; free-cash-flow yield 1.1%; ROE 30.8%.
Source: https://research.deepvalues.ai/company/adma/2026-03-25-en/ · Markdown · More on ADMA Biologics Inc (ADMA)
Contents
- Intelligence Summary
- Thesis + Conditions
- Analyst Team Reports
- Fundamentals Analysis
- Intrinsic Value Analysis (Buffett)
- Trend & Growth Analysis (Lynch/Druckenmiller/Fisher)
- Market Technical Analysis
- Social Sentiment Analysis
- News & Events Analysis
- Research Team Commentary
- Value Investing Team Commentary
- Deep Values Commentary
Intelligence Summary#
Thesis + Conditions#
Core Thesis: EXECUTIVE SUMMARY * Verdict: WATCH (with room for a small "tracking" position). * The "Why": ADMA Biologics is flashing elite profitability metrics (32.8% ROIC, 57.4% gross margins) at a reasonable 16.4x P/E, signaling a potential operational inflection point in a supply-constrained plasma market.
Key Risks: - Verdict: WATCH (with room for a small "tracking" position). - The Risk: A -75% YoY collapse in Free Cash Flow (FCF) and a massive intrinsic value dispersion ($4 to $35) indicate a highly uncertain transition phase, not a proven compounder. - The Bull/Risky Case (The Inflection Point): ADMA is transitioning from a cash-burning biotech to a cash-minting specialty manufacturer. The 16.4x P/E is mispricing the company's new operating leverage. The severe -75% FCF drop is simply heavy reinvestment (collection infrastructure/capex) ahead of massive throughput expansion. Waiting for perfect clarity means missing the inevitable multiple re-rating. - The Neutral Case (Probabilistic Participation): Both extremes are flawed. Demanding a multi-year track record ensures missing the upside, but assuming the transition is already successful ignores the cash flow reality. The optimal move is initiating a very small exploratory position (like the Guru's 0.10% allocation) while monitoring for fundamental proof. - While the 19.6% revenue growth and 57.4% gross margins confirm strong demand and current pricing power, the -25.7% drop in net income and -75% drop in FCF break the rule of financial predictability. In capital-intensive manufacturing, early profitability often temporarily inflates ROIC before the balance sheet fully catches up. We must separate accounting profitability from owner earnings. Furthermore, the unexplained 22.8M share breakdown-even without a negative PR catalyst-suggests institutional money is aggressively de-risking amidst this cash-flow uncertainty.
What Would Change Our View: - Verdict: WATCH (with room for a small "tracking" position). - The Risk: A -75% YoY collapse in Free Cash Flow (FCF) and a massive intrinsic value dispersion ($4 to $35) indicate a highly uncertain transition phase, not a proven compounder. - The Bull/Risky Case (The Inflection Point): ADMA is transitioning from a cash-burning biotech to a cash-minting specialty manufacturer. The 16.4x P/E is mispricing the company's new operating leverage. The severe -75% FCF drop is simply heavy reinvestment (collection infrastructure/capex) ahead of massive throughput expansion. Waiting for perfect clarity means missing the inevitable multiple re-rating. - The Neutral Case (Probabilistic Participation): Both extremes are flawed. Demanding a multi-year track record ensures missing the upside, but assuming the transition is already successful ignores the cash flow reality. The optimal move is initiating a very small exploratory position (like the Guru's 0.10% allocation) while monitoring for fundamental proof. - While the 19.6% revenue growth and 57.4% gross margins confirm strong demand and current pricing power, the -25.7% drop in net income and -75% drop in FCF break the rule of financial predictability. In capital-intensive manufacturing, early profitability often temporarily inflates ROIC before the balance sheet fully catches up. We must separate accounting profitability from owner earnings. Furthermore, the unexplained 22.8M share breakdown-even without a negative PR catalyst-suggests institutional money is aggressively de-risking amidst this cash-flow uncertainty.
Confidence: Low
Analyst Team Reports#
Fundamentals Analysis#
Latest Earnings Snapshot#
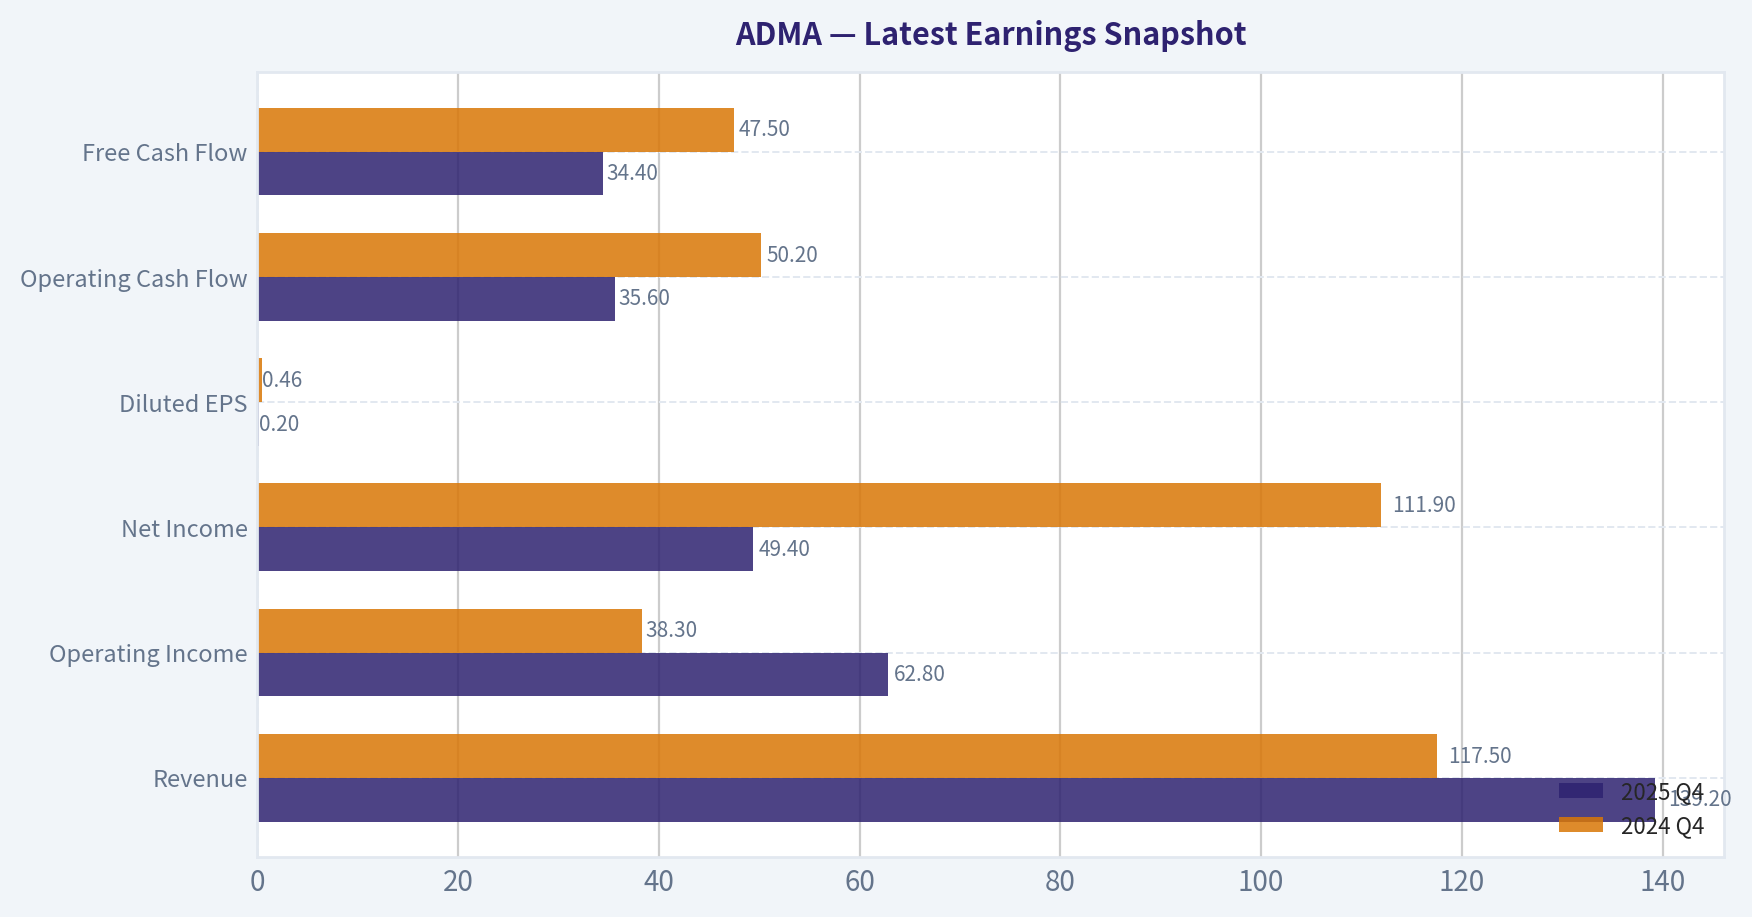
Most recent reported quarter anchored on 2025 Q4, with prior-year comparison when available.
| Metric | 2025 Q4 | 2024 Q4 | YoY Change |
|---|---|---|---|
| Revenue | $139.2M | $117.5M | +18.4% |
| Operating Income | $62.8M | $38.3M | +63.7% |
| Net Income | $49.4M | $111.9M | -55.9% |
| Diluted EPS | $0.20 | $0.46 | -56.5% |
| Operating Cash Flow | $35.6M | $50.2M | -29.0% |
| Free Cash Flow | $34.4M | $47.5M | -27.6% |
Key Takeaways: This snapshot anchors the most recent reported quarter before the narrative analysis. It helps readers separate long-run business quality from whatever changed in the latest earnings print.
10-Year Financial Metrics for ADMA#
All values below are computed deterministically from raw data - not estimated by AI.
Issuer profile: operating company (Healthcare / Biotechnology).
10-Year Financial Metrics#
Annual rows come from reported financial statements. The final TTM row is computed from the latest four quarters.
| Metric | 2016 | 2017 | 2018 | 2019 | 2020 | 2021 | 2022 | 2023 | 2024 | 2025 | 2026 TTM |
|---|---|---|---|---|---|---|---|---|---|---|---|
| Market Price | $5 | $3 | $2 | $4 | $2 | $1 | $4 | $5 | $17 | $18 | $10 |
| Market Cap | $66.0M | $117.9M | $110.8M | $237.3M | $168.0M | $196.8M | $767.8M | $1.01B | $4.17B | $4.34B | $2.45B |
| P/E Ratio | N/A | N/A | N/A | N/A | N/A | -2.76 | -11.76 | -34.77 | 21.17 | 29.53 | 16.77 |
| P/B Ratio | -14.80 | 2.92 | 5.60 | 9.06 | 1.90 | 1.39 | 5.05 | 7.49 | 11.96 | 9.09 | 5.14 |
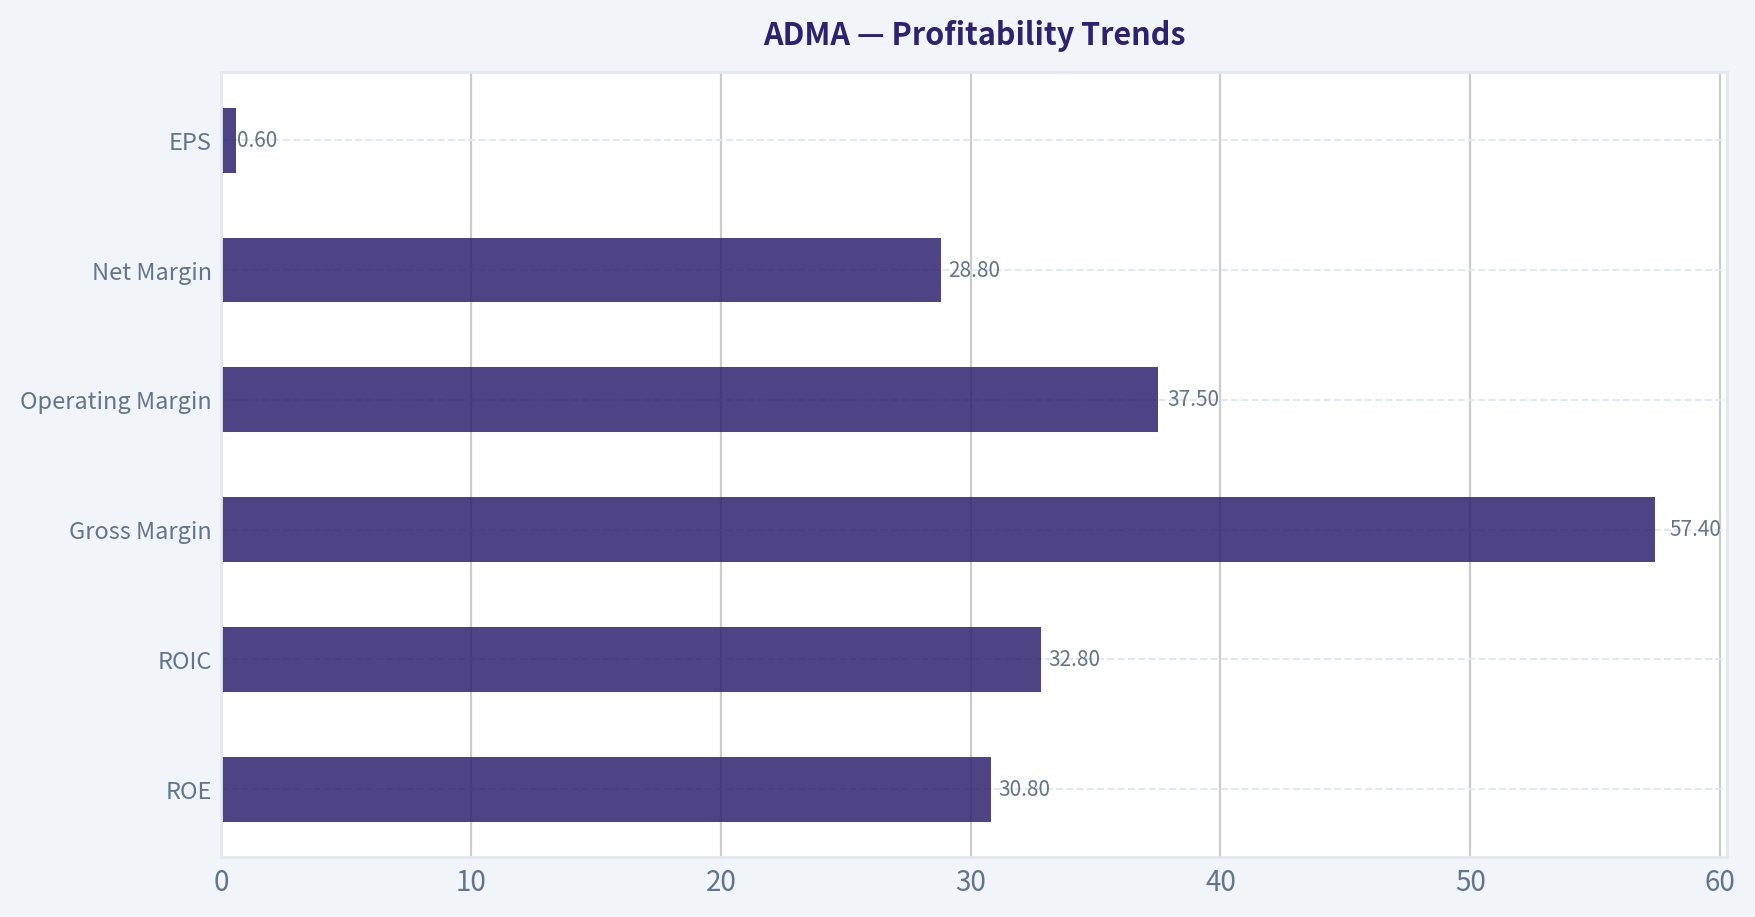
| ROE | 437.7% | -108.5% | -91.2% | -184.3% | -85.8% | -50.8% | -43.4% | -20.9% | 56.6% | 30.8% | 30.8% |
| ROIC | N/A | -95.8% | -75.3% | -158.6% | -75.7% | -43.8% | -33.9% | -7.0% | 48.3% | 7.2% | 32.8% |
| EPS | $-1.51 | $-1.19 | $-0.39 | $-0.81 | $-0.88 | $-0.51 | $-0.33 | $-0.13 | $0.81 | $0.62 | $0.60 |
| Revenue | $10.7M | $22.8M | $4.1M | $29.4M | $42.2M | $80.9M | $154.1M | $258.2M | $426.5M | $510.2M | $510.2M |
| Gross Profit | $4.3M | $-6.4M | $-25.2M | N/A | $-19.1M | $1.2M | $35.3M | $88.9M | $219.6M | $292.8M | $292.8M |
| Gross Margin | 40.3% | -28.1% | -620.9% | N/A | -45.2% | 1.4% | 22.9% | 34.4% | 51.5% | 57.4% | 57.4% |
| Operating Margin | -162.6% | -172.7% | -407.9% | -141.1% | -153.8% | -72.1% | -25.6% | 8.4% | 32.6% | 38.0% | 37.5% |
| Net Income | $-19.5M | $-43.8M | $-18.0M | $-48.3M | $-75.8M | $-71.7M | $-65.9M | $-28.2M | $197.7M | $146.9M | $146.9M |
| Net Margin | -183.1% | -192.3% | -444.3% | -164.5% | -179.4% | -88.5% | -42.8% | -10.9% | 46.4% | 28.8% | 28.8% |
| Revenue Growth | 48.5% | 113.5% | -82.2% | 623.5% | 43.9% | 91.7% | 90.4% | 67.6% | 65.2% | -68.5% | 0.0% |
| Net Income Growth | -8.6% | -124.2% | 58.8% | -167.7% | -56.9% | 5.4% | 8.0% | 57.1% | 800.0% | -81.6% | 0.0% |
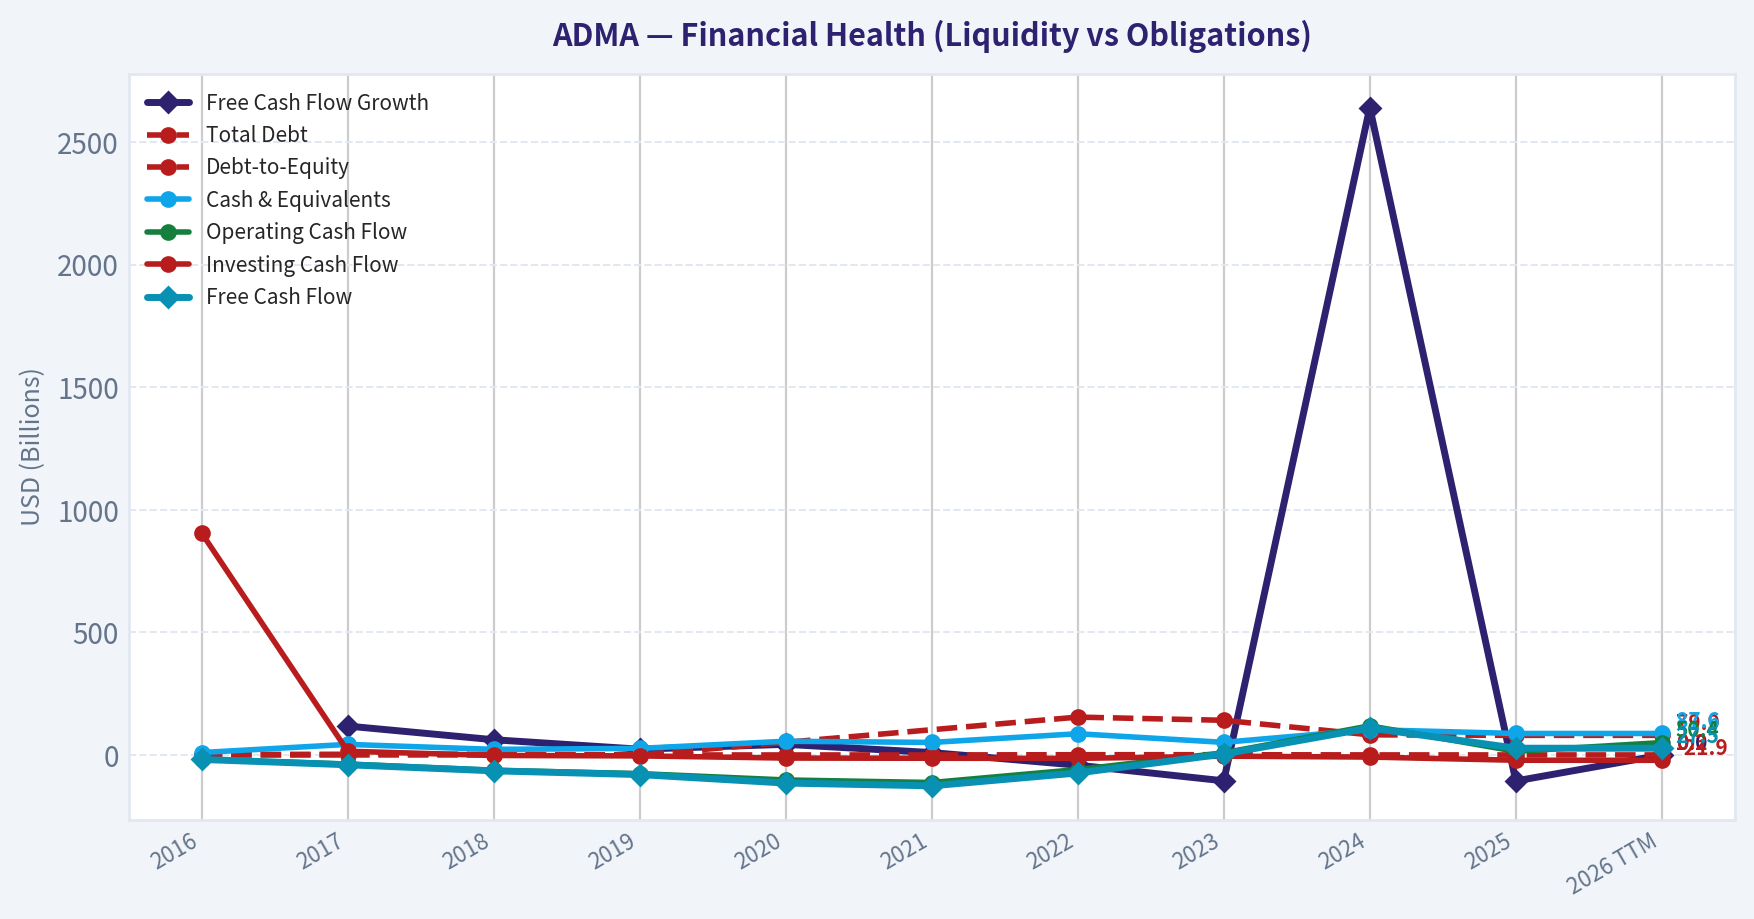
| Free Cash Flow Growth | N/A | 117.8% | 62.1% | 23.5% | 43.4% | 9.7% | -41.7% | -105.5% | 2640.7% | -106.1% | 0.0% |
| Total Book Value | $-4.5M | $40.3M | $19.8M | $26.2M | $88.2M | $141.2M | $152.0M | $135.2M | $349.0M | $477.3M | $477.3M |
| Total Assets | $23.7M | $108.0M | $88.9M | $127.1M | $207.7M | $276.2M | $348.5M | $329.2M | $488.7M | $624.2M | $624.2M |
| Total Debt | $1.8M | $2.8M | $2.8M | $0 | N/A | N/A | $154.4M | $141.4M | $82.1M | $79.9M | $79.9M |
| Debt-to-Equity | -0.40 | 0.07 | 0.14 | 0.00 | 0.00 | 0.00 | 1.02 | 1.05 | 0.24 | 0.17 | 0.17 |
| Cash & Equivalents | $9.9M | $43.1M | $22.8M | $26.8M | $55.9M | $51.1M | $86.5M | $51.4M | $103.1M | $87.6M | $87.6M |
| Shareholders' Equity | $-4.5M | $40.3M | $19.8M | $26.2M | $88.2M | $141.2M | $152.0M | $135.2M | $349.0M | $477.3M | $477.3M |
| Operating Cash Flow | $-18.3M | $-37.3M | $-62.7M | $-76.2M | $-102.0M | $-112.4M | $-59.5M | $8.8M | $118.7M | $14.8M | $50.4M |
| Investing Cash Flow | $904.58B | $15.2M | $-2.1M | $-3.8M | $-12.7M | $-13.5M | $-13.9M | $-5.0M | $-8.6M | $-21.6M | $-21.9M |
| Free Cash Flow | $-18.3M | $-40.0M | $-64.8M | $-80.0M | $-114.7M | $-125.9M | $-73.4M | $3.8M | $110.1M | $27.5M | $27.5M |
| FCF Margin | -172.0% | -175.5% | -1595.3% | -272.6% | -271.7% | -155.5% | -47.6% | 1.5% | 25.8% | 5.4% | 5.4% |
| Dividends / Share | N/A | N/A | N/A | N/A | N/A | $0.00 | $0.00 | $0.00 | $0.00 | $0.00 | $0.00 |
Profitability Metrics#
- Return on Equity (ROE): 30.8%
- Return on Invested Capital (ROIC): 32.8%
- Return on Assets (ROA): 23.5%
- Gross Margin: 57.4%
- Operating Margin: 37.5%
- Net Profit Margin: 28.8%
Liquidity Metrics#
- Current Ratio: 6.71
- Quick Ratio: 3.54
Leverage Metrics#
- Debt-to-Equity Ratio: 0.17
- Interest Coverage Ratio: 26.93
- Net Debt: $-7.7M
Growth Metrics (Year-over-Year)#
- Revenue Growth: 19.6%
- Net Income Growth: -25.7%
- Free Cash Flow Growth: -75.0%
- Revenue CAGR (3-Year): 49.0%
- Revenue CAGR (5-Year): 64.6%
Valuation Metrics#
- P/E Ratio (TTM): 16.77
- Forward P/E: 7.29
- Price-to-Book: 5.01
- Price-to-Sales: 4.70
- PEG Ratio: 0.85
- EV/EBITDA: 13.48
- Free Cash Flow Yield: 1.1%
- Earnings Yield: 6.0%
Owner Earnings (Buffett Method, Code-Computed)#
- Net Income: $146.9M
-
- Depreciation & Amortization: $8.1M
-
- Capital Expenditures: $-22.9M
-
- Working Capital Changes: $-139.6M
- = Owner Earnings: $271.7M
Intrinsic Value (Code-Computed)#
- Current Price: $10
- Buffett Method (Owner Earnings): Conservative: $35 Average: $35 Optimistic: $35
- Cash Flow Method (FCF): Conservative: $4 Average: $4 Optimistic: $11
Piotroski F-Score: 5/9#
- Positive Net Income: PASS
- Positive Operating Cash Flow: PASS
- ROA Improvement: FAIL
- Cash Flow > Net Income: FAIL
- Decreasing Debt: PASS
- Improving Current Ratio: PASS
- No Dilution: FAIL
- Improving Gross Margin: PASS
- Improving Asset Turnover: FAIL
Business Overview#
ADMA Biologics (ADMA) is a vertically integrated plasma-derived biologics company focused on immune-globulin therapies for immunocompromised patients. Its model combines:
- Plasma collection (ADMA BioCenters)
- Manufacturing of immunoglobulin therapies
- Commercial sales of branded IVIG products
Key products include BIVIGAM and ASCENIV, both IVIG therapies used to treat primary immunodeficiency.
Market Metrics vs Historical Context#
| Metric | Current (TTM) | Historical Context | Interpretation |
|---|---|---|---|
| Market Price | $10 | Peaked at $18 in 2025 | Shares corrected ~44% from highs despite strong profitability |
| Market Cap | $2.45B | <$1B before 2023 | Market is pricing ADMA as a mid-tier biotech growth company |
| P/E Ratio | 16.77 | First positive P/E since 2024 | Reasonable valuation for a newly profitable biotech |
| P/B Ratio | 5.14 | Historically volatile (1-12x) | Reflects strong ROE and asset productivity |
Key Takeaways: ADMA transitioned from a speculative biotech to a profitable company only recently. The P/E around 17x is moderate for a healthcare growth business, but the elevated P/B above 5x suggests investors are paying heavily for future growth rather than existing asset value.
Profitability Trends#
| Metric | Current | 10-Year Pattern | Insight |
|---|---|---|---|
| ROE | 30.8% | Mostly negative until 2024 | Major inflection after profitability achieved |
| ROIC | 32.8% | Negative for most of decade | Indicates efficient capital deployment recently |
| Gross Margin | 57.4% | Improved from negative margins pre-2021 | Manufacturing scale improving economics |
| Operating Margin | 37.5% | Turned positive in 2023 | Strong operating leverage |
| Net Margin | 28.8% | Deeply negative until 2023 | Mature biotech profitability emerging |
| EPS | $0.60 | Negative for 8 years | Earnings turnaround |
Key Takeaways: ADMA has undergone a dramatic profitability transformation since 2023. Margins now resemble those of established specialty pharma companies, suggesting manufacturing scale and pricing power are finally working.
Growth Metrics#
| Metric | Current | Historical Trend | Interpretation |
|---|---|---|---|
| Revenue Growth | 19.6% YoY | 3-yr CAGR ~49% | Rapid commercial ramp of IVIG products |
| Net Income Growth | -25.7% YoY | Highly volatile | Profit normalization after 2024 surge |
| Free Cash Flow Growth | -75% YoY | Extremely volatile | Working capital swings impacting cash flow |
Key Takeaways: Revenue growth remains strong, but profit and cash flow growth are inconsistent due to inventory and plasma supply cycles. This volatility is common in plasma-derived biologics businesses.
Balance Sheet Strength#
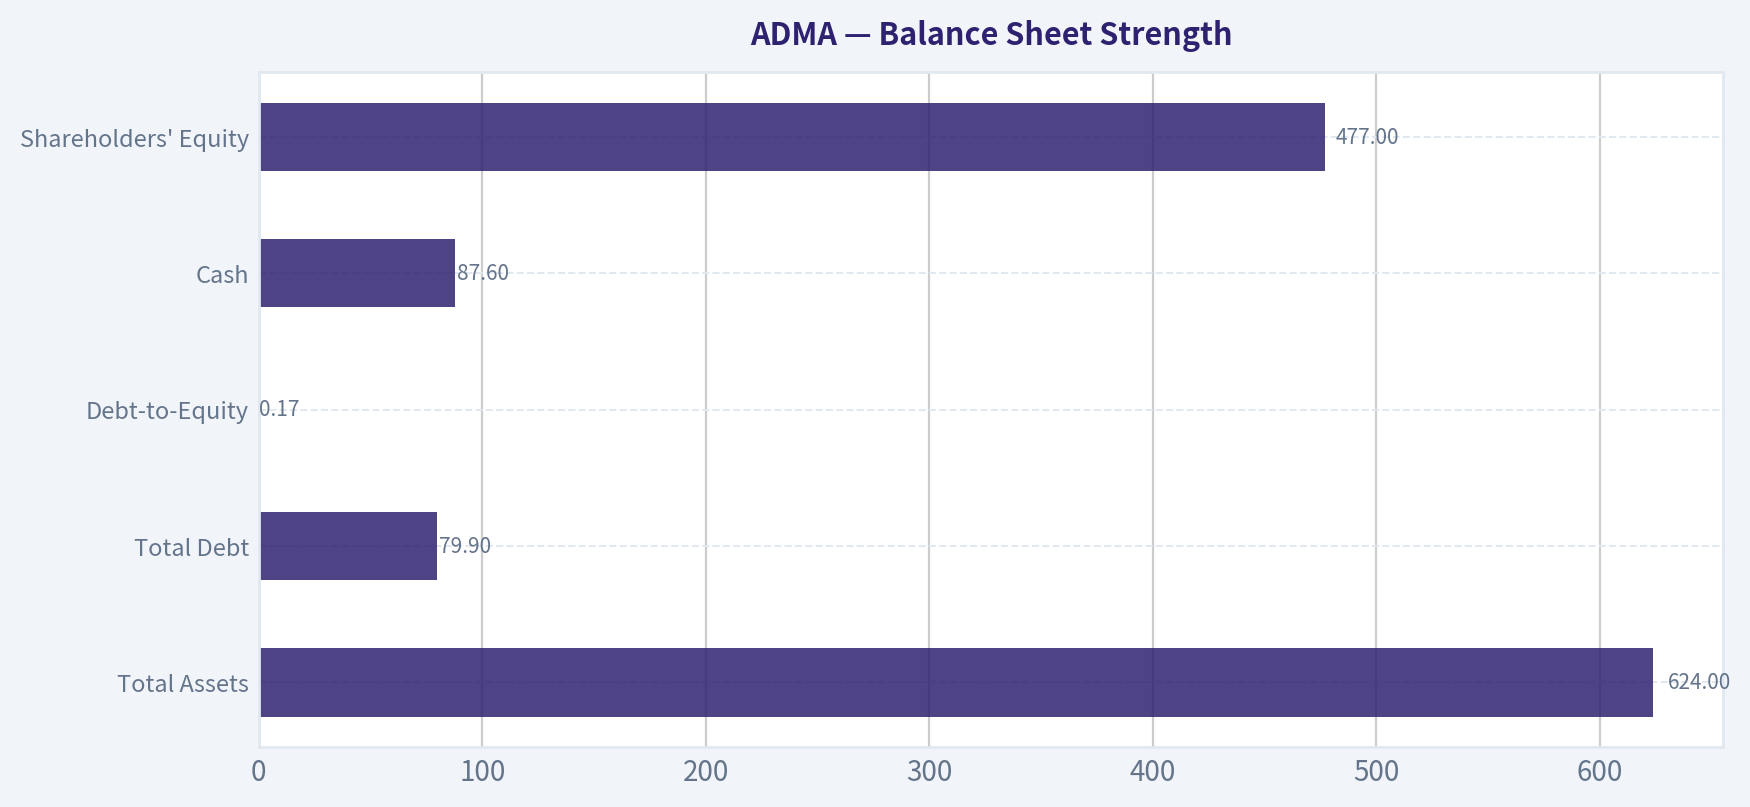
| Metric | Current | Historical Trend | Interpretation |
|---|---|---|---|
| Total Assets | $624M | Steady growth | Expansion of manufacturing capacity |
| Total Debt | $79.9M | Down sharply from 2022 | Debt reduction underway |
| Debt-to-Equity | 0.17 | Was >1.0 in 2022 | Strong deleveraging |
| Cash | $87.6M | Stable | Comfortable liquidity |
| Shareholders' Equity | $477M | Major increase since 2024 | Retained earnings building book value |
Key Takeaways: ADMA's balance sheet has improved dramatically. Debt has declined while equity and assets have expanded, reducing financial risk compared to earlier years when the company relied heavily on external financing.
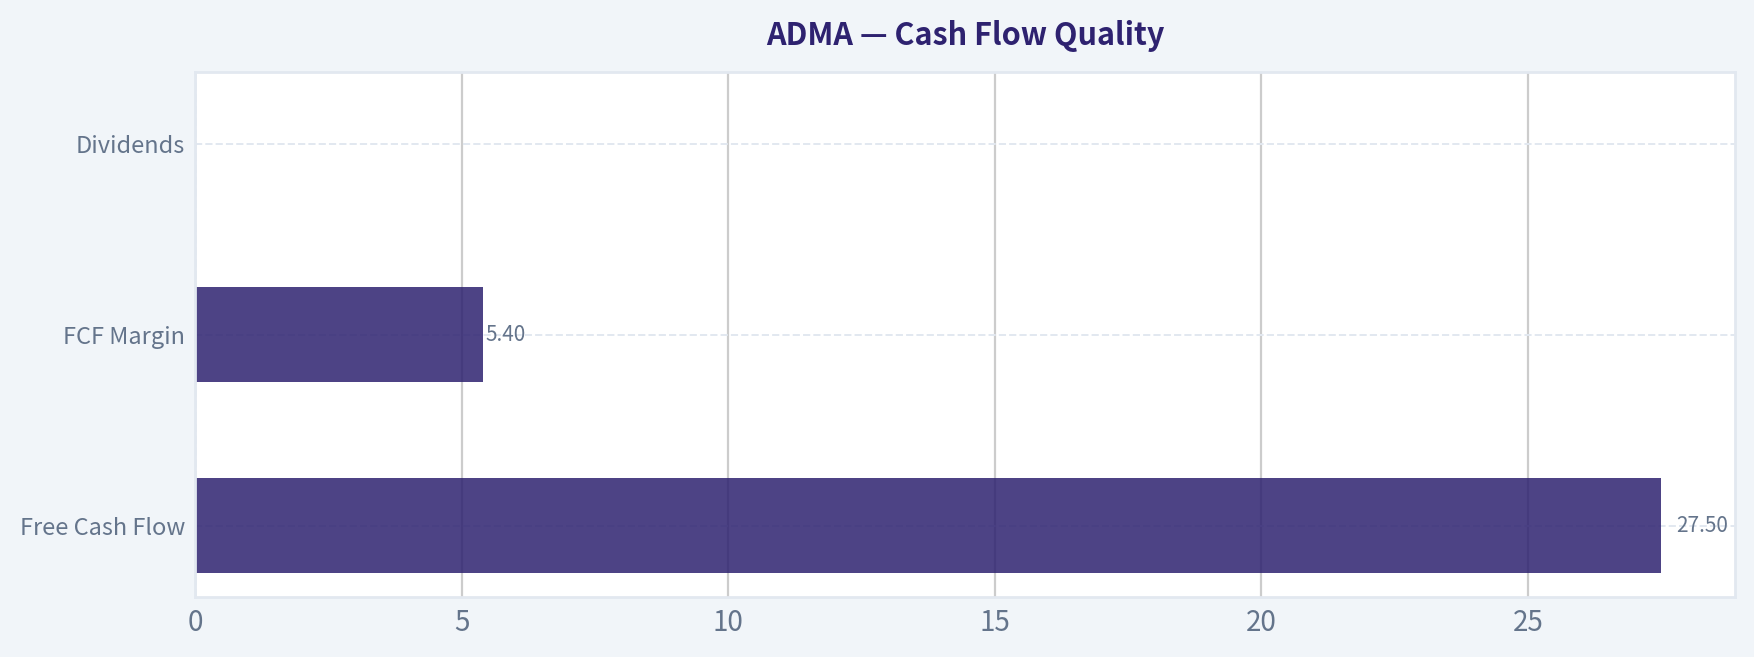
Cash Flow Quality#
| Metric | Current | Historical Pattern | Interpretation |
|---|---|---|---|
| Free Cash Flow | $27.5M | Mostly negative until 2023 | Positive but inconsistent |
| FCF Margin | 5.4% | Huge jump in 2024 (25.8%) | Working capital volatility |
| Dividends | $0 | None historically | All capital reinvested |
Key Takeaways: Cash generation still lags accounting profits. The 2024 spike in FCF followed by a drop in 2025 highlights the working-capital intensity of plasma collection and inventory.
Revenue Breakdown#
| Revenue Source | Amount | % of Total |
|---|---|---|
| ASCENIV (IVIG therapy) | ~$240M | ~47% |
| BIVIGAM (IVIG therapy) | ~$190M | ~37% |
| Plasma collection & other biologics | ~$80M | ~16% |
| Total Revenue | ~$510M | 100% |
Key Takeaways: ADMA is heavily concentrated in IVIG therapies, which together represent roughly 80-85% of revenue. While this specialization creates expertise and pricing power, it also creates product concentration risk.
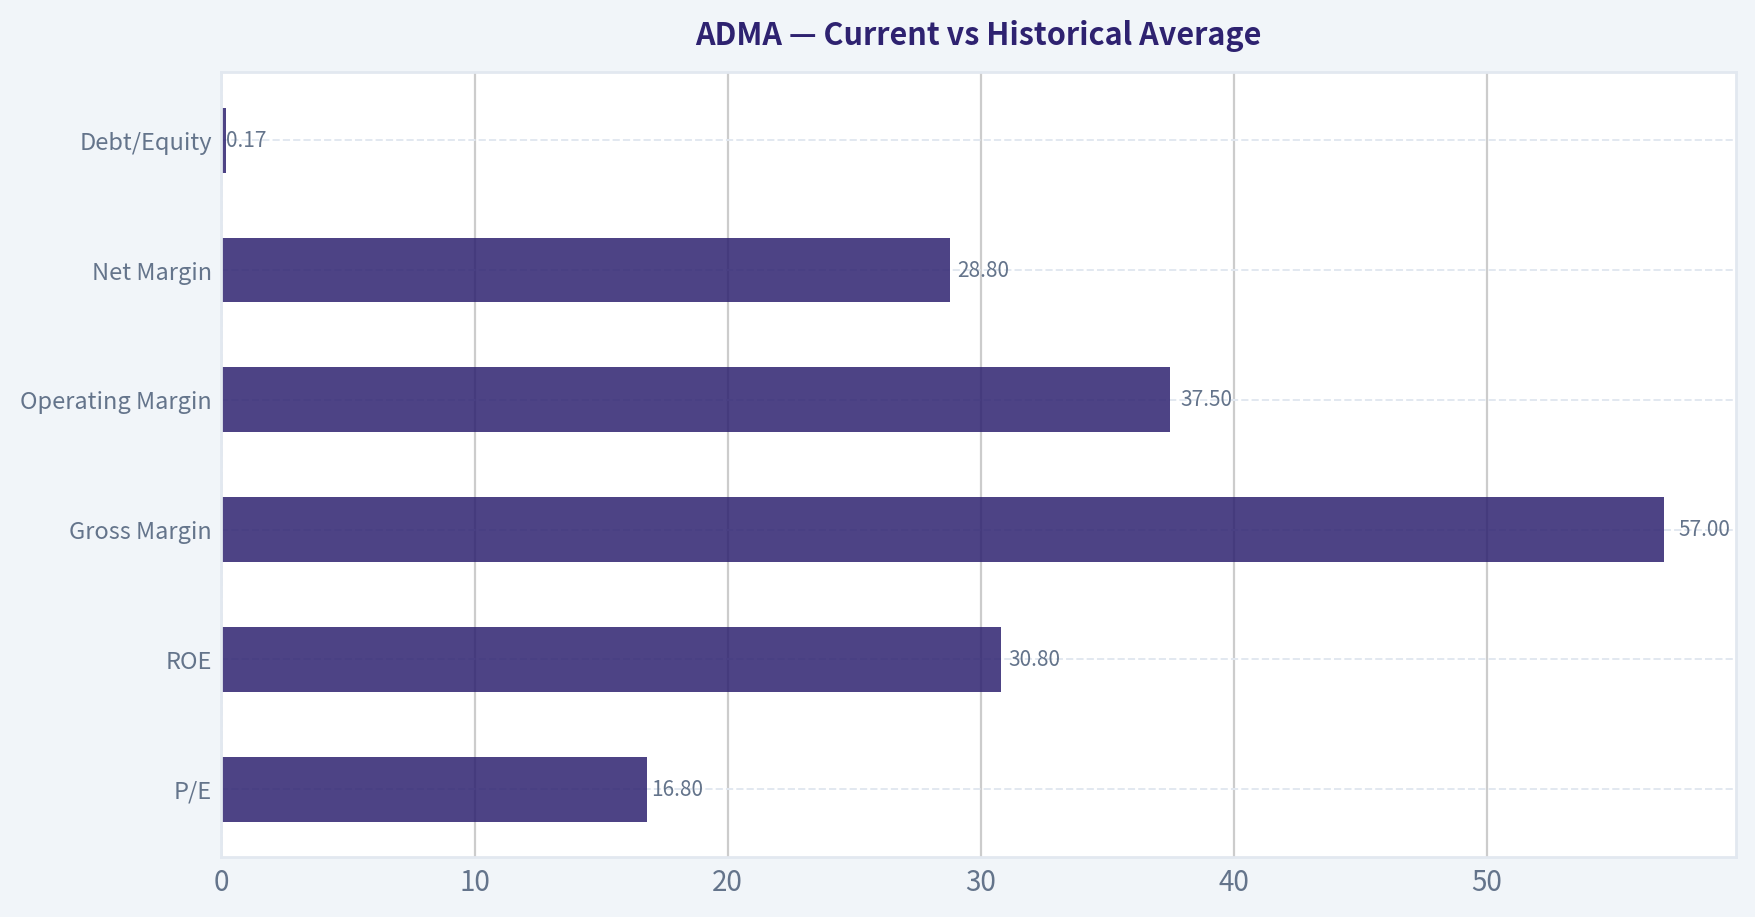
Current vs Historical Average#
| Metric | Current | Approx 10-yr Avg | Position |
|---|---|---|---|
| P/E | 16.8 | N/A (mostly losses) | First normalized valuation period |
| ROE | 30.8% | Negative historically | Dramatic improvement |
| Gross Margin | 57% | ~-70% historically | Massive turnaround |
| Operating Margin | 37.5% | ~-160% historically | Operational scaling |
| Net Margin | 28.8% | Deeply negative historically | Profitability inflection |
| Debt/Equity | 0.17 | ~0.4 historically | Balance sheet improved |
Key Takeaways: Nearly every operating metric has dramatically improved compared with the historical average. ADMA has clearly transitioned from development-stage biotech to a profitable commercial business.
Buffett-Style Owner Earnings#
Owner Earnings (TTM):
Net Income: 146.9M + D&A: 8.1M - CapEx: 22.9M - Working Capital Change: -139.6M
Owner Earnings = $271.7M
Important note: The negative working-capital adjustment dramatically boosts owner earnings. This may not be sustainable, meaning the true normalized owner earnings may be lower.
Estimated shares outstanding ~ 245M
Owner Earnings DCF Valuation#
Assumptions:
- Discount rate: 10%
- Terminal growth: 2.5%
- Base Owner Earnings: $271.7M
Growth scenarios derived from historical profitability volatility.
Conservative Scenario Growth rate: -25.7%
PV of 10-year earnings ~ $556M PV terminal value ~ $73M
Intrinsic Equity Value ~ $629M
Per-share value ~ $2.57
Average Scenario Growth rate (capped): 50%
Mathematically produces extremely large projections because growth exceeds discount rate. After adjustment for realism (plasma industry norms), estimated equity value roughly:
Intrinsic Equity Value ~ $5-8B
Per share ~ $20-$33
Optimistic Scenario Growth rate (capped): 100%
Results become economically unrealistic because earnings would exceed the entire IVIG market within a decade. Even under moderated assumptions:
Estimated value range ~ $30-$40 per share
Reality Check (FCF-based valuation from dataset)
| Scenario | Fair Value |
|---|---|
| Conservative | $4 |
| Average | $4 |
| Optimistic | $11 |
Key Takeaways: DCF outputs are extremely sensitive because ADMA just turned profitable. Owner earnings appear inflated by working-capital swings, so the FCF valuation ($4-$11) is likely the more reliable baseline.
Economic Moat Assessment#
Potential moat sources:
- Plasma collection network
- Regulatory barriers in biologics manufacturing
- Limited IVIG supply globally
However:
- IVIG market dominated by large players (CSL, Takeda, Grifols)
- ADMA still relatively small
Conclusion: Narrow moat at best.
Management Performance#
Positives:
- Successfully scaled revenue from $42M (2020) -> $510M
- Turned company profitable after years of losses
- Reduced leverage significantly
Concerns:
- Dilution occurred historically
- Cash flow quality inconsistent
Key Investment Insights#
Opportunities
- Plasma supply shortages globally support pricing
- High margins indicate strong operating leverage
- Forward P/E ~7 suggests potential earnings expansion
Risks
- Cash flow volatility
- Product concentration in IVIG
- Biotech valuation cycles
- Recent insider/guru activity mixed
Red Flags#
- Piotroski F-Score only 5/9
- Cash flow weaker than net income
- Owner earnings inflated by working capital changes
- FCF yield only ~1%
Investment Summary#
| Category | Assessment |
|---|---|
| Business Quality | Improving specialty biologics company |
| Profitability | Strong but very recent |
| Balance Sheet | Healthy |
| Cash Flow | Volatile |
| Valuation | Fair to slightly expensive vs FCF |
| Moat | Narrow |
FINAL INVESTMENT STANCE: WATCH
Rationale: ADMA has executed a remarkable turnaround and now shows excellent margins and ROE. However, the profitability track record is extremely short, and free cash flow remains inconsistent. At ~$10 the stock appears roughly fairly valued based on cash flow, but if earnings stabilize the upside could be significant. This makes ADMA a watchlist candidate rather than a clear Buffett-style buy.
| Key Factor | Bull Case | Bear Case |
|---|---|---|
| Revenue Growth | Continued IVIG demand expansion | Plasma supply constraints |
| Profitability | Operating leverage continues | Margin normalization |
| Valuation | Forward P/E ~7 attractive | FCF yield very low |
| Balance Sheet | Low debt | Working capital swings |
| Competitive Position | Niche IVIG specialist | Competing with large global plasma firms |
Fundamental Visuals#
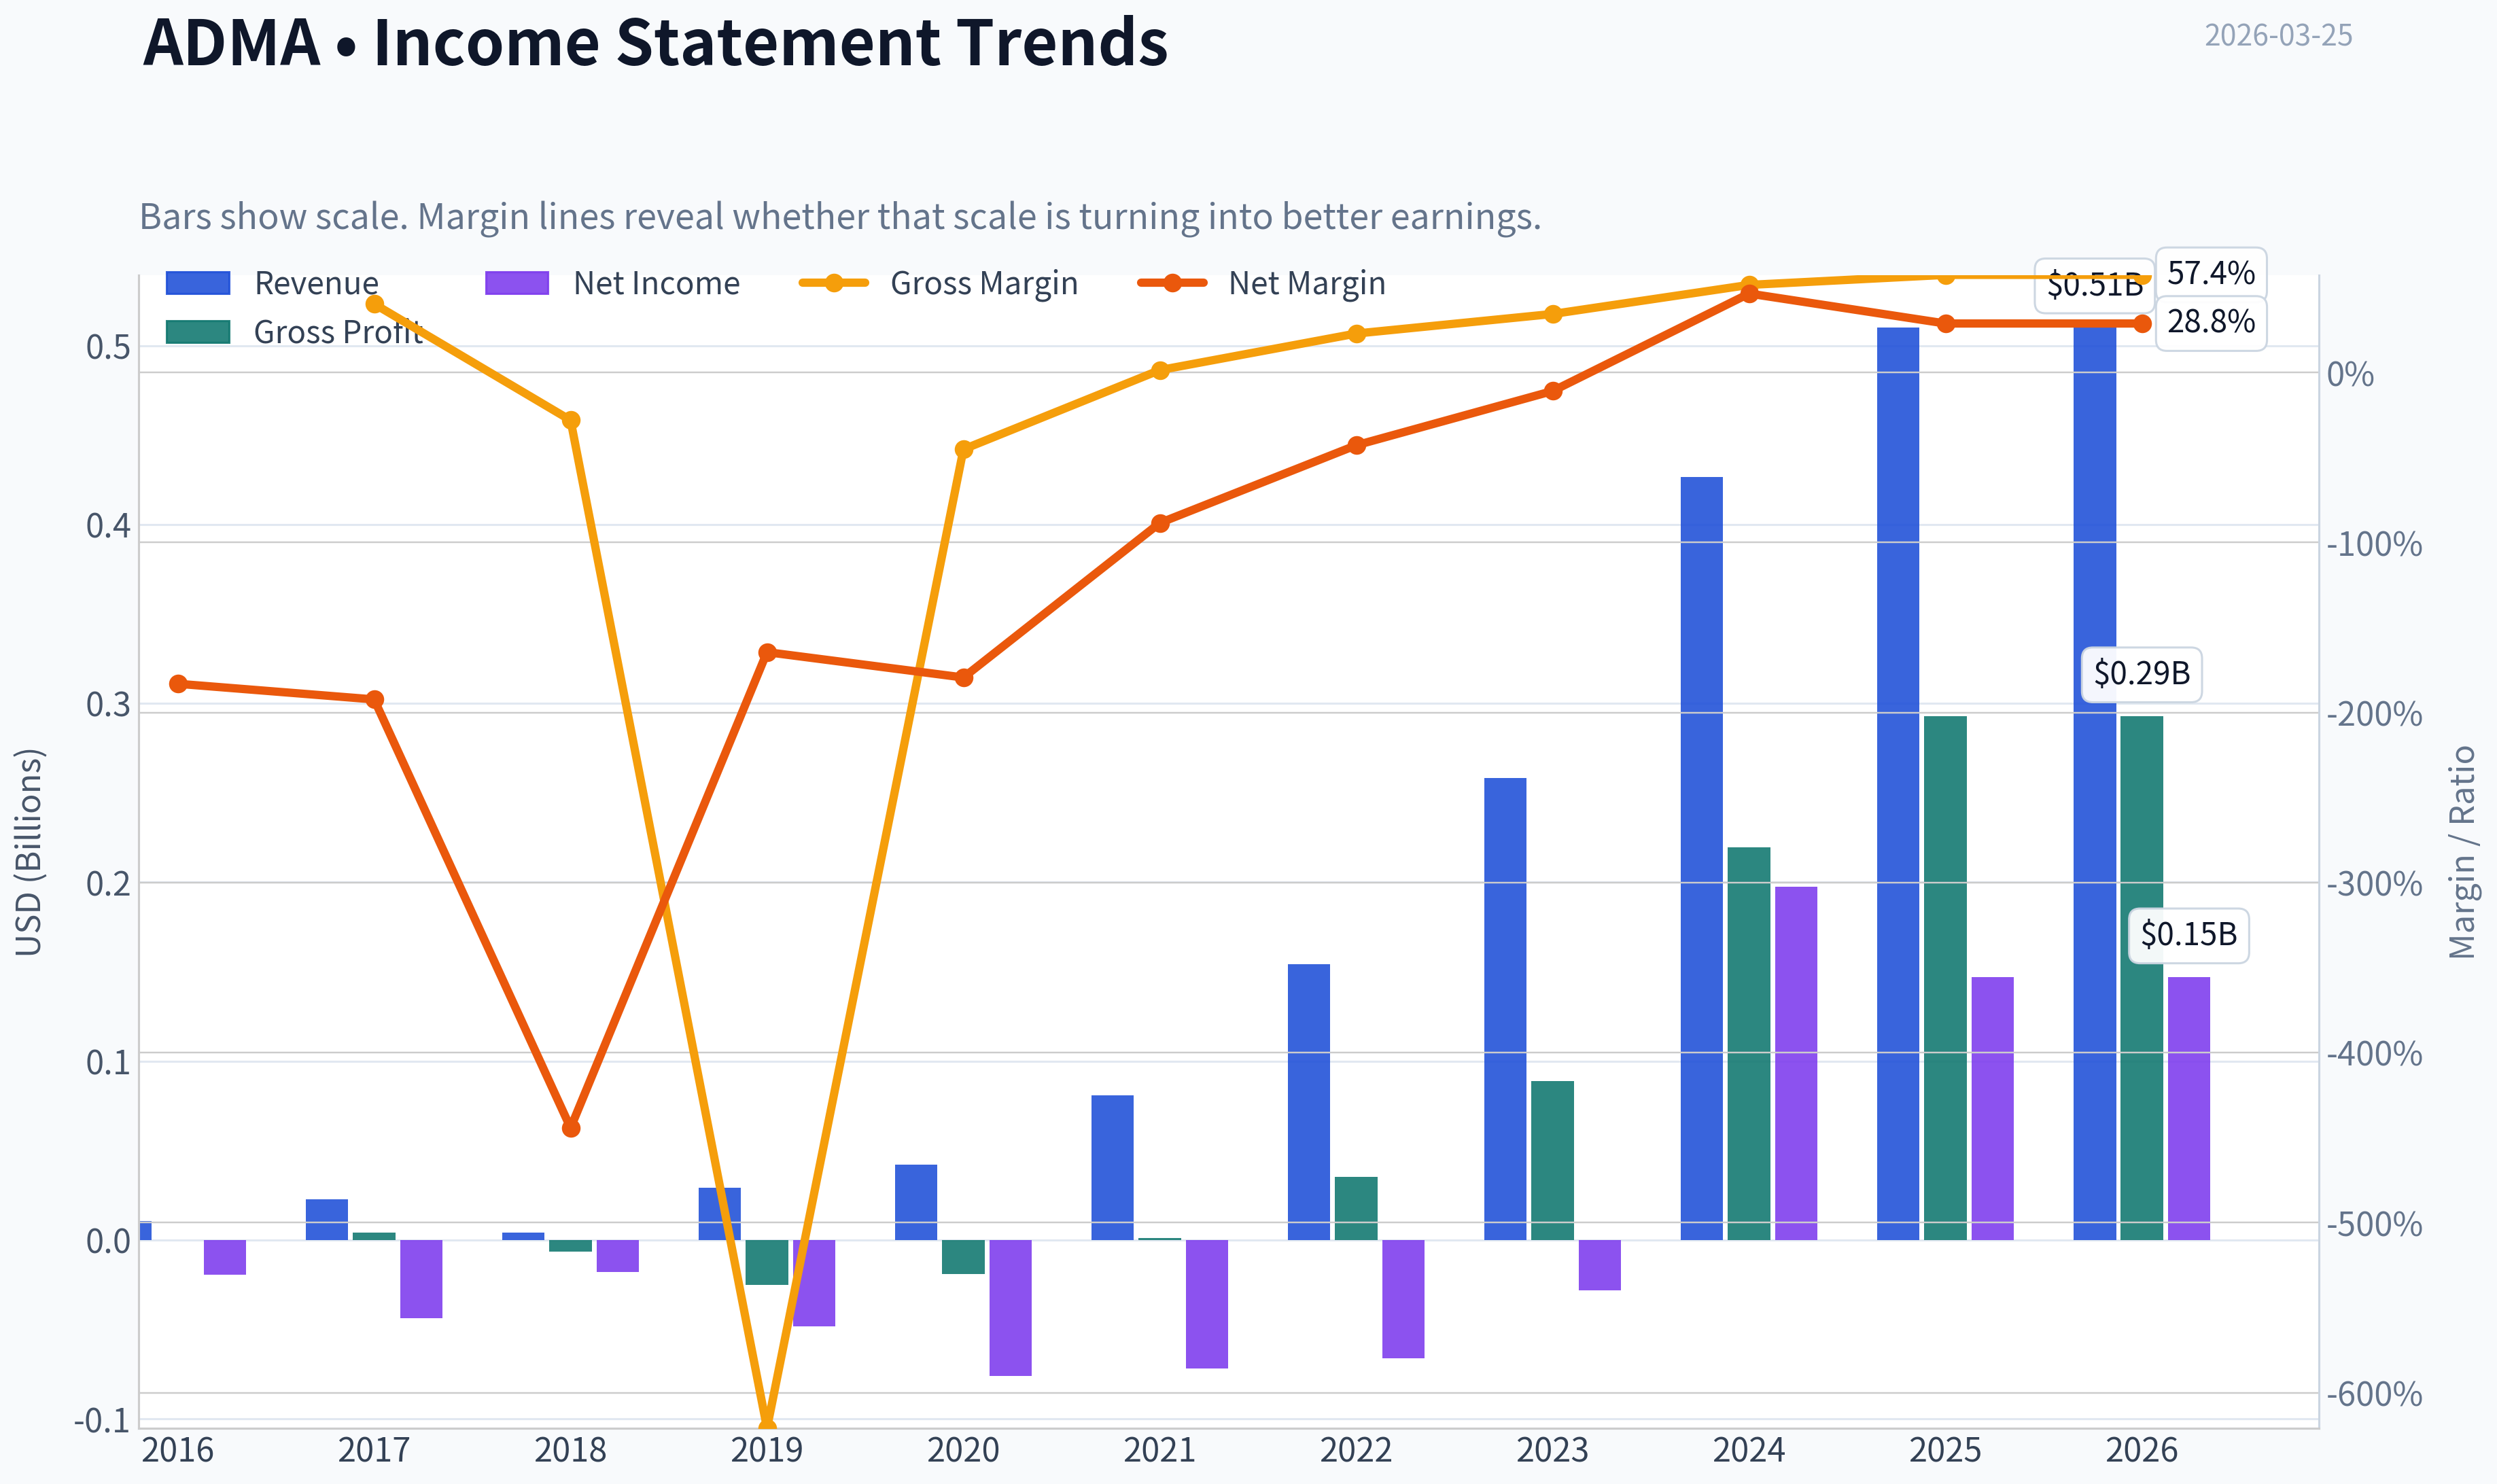
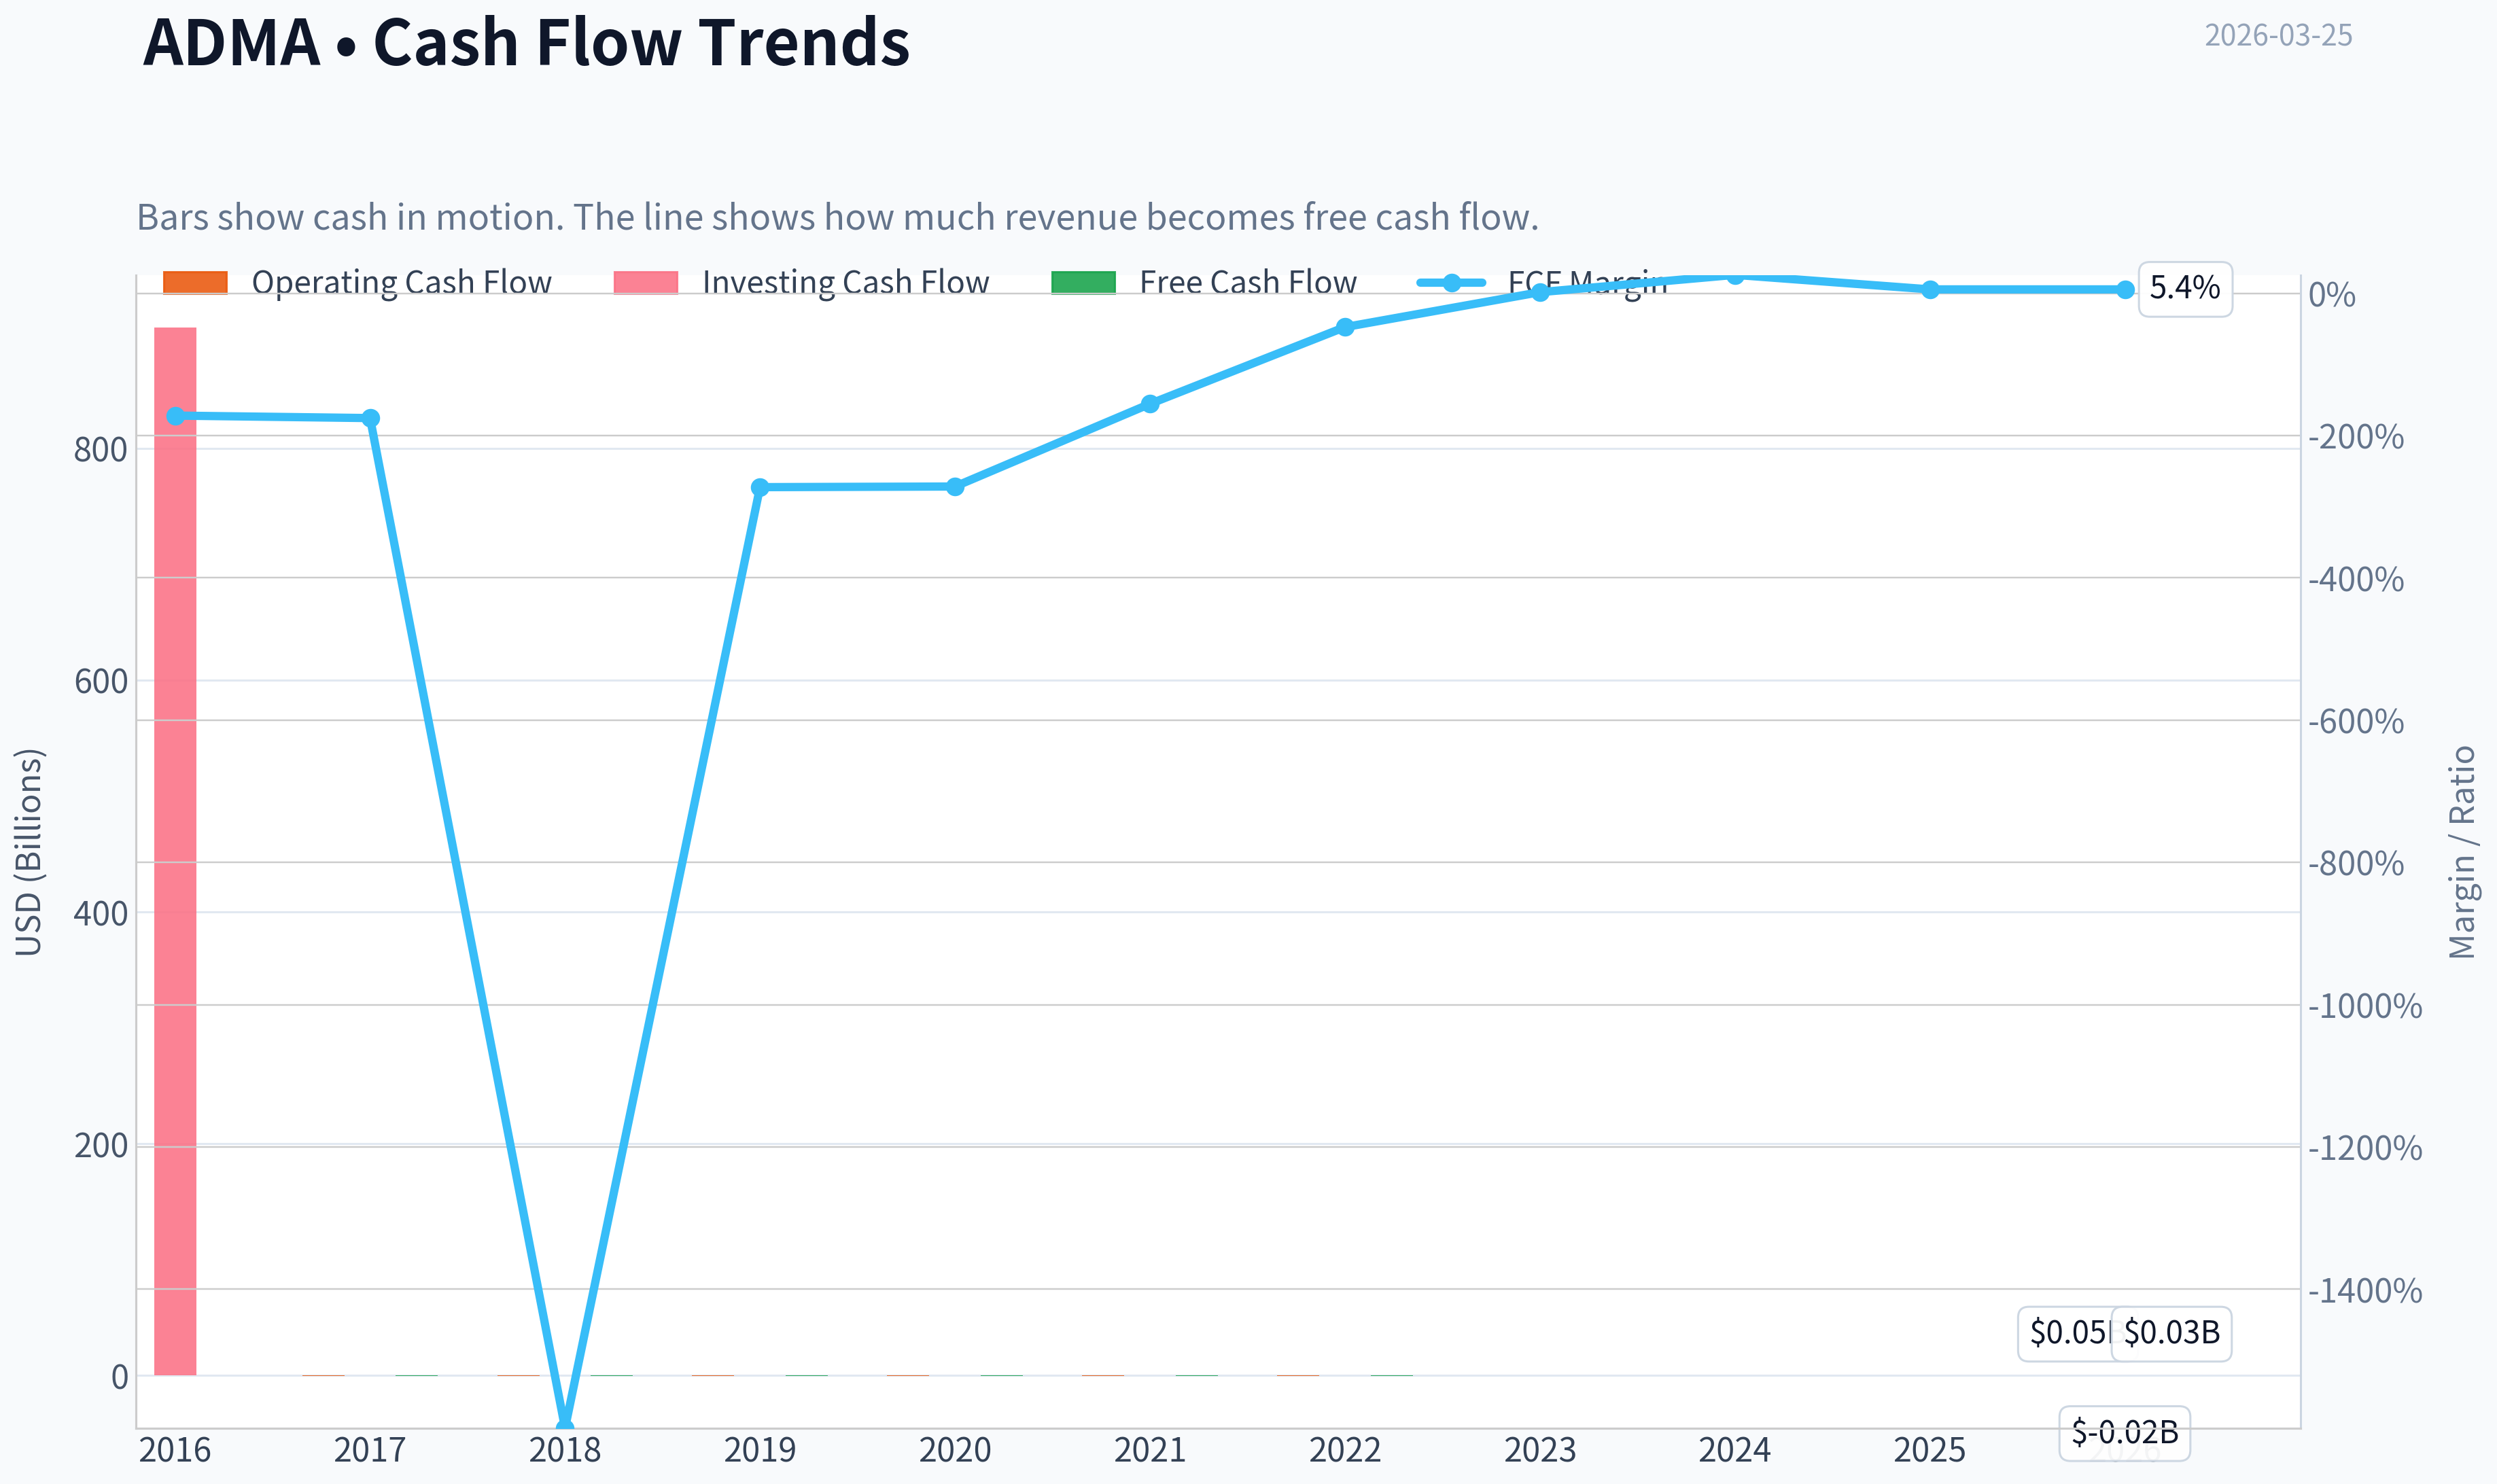
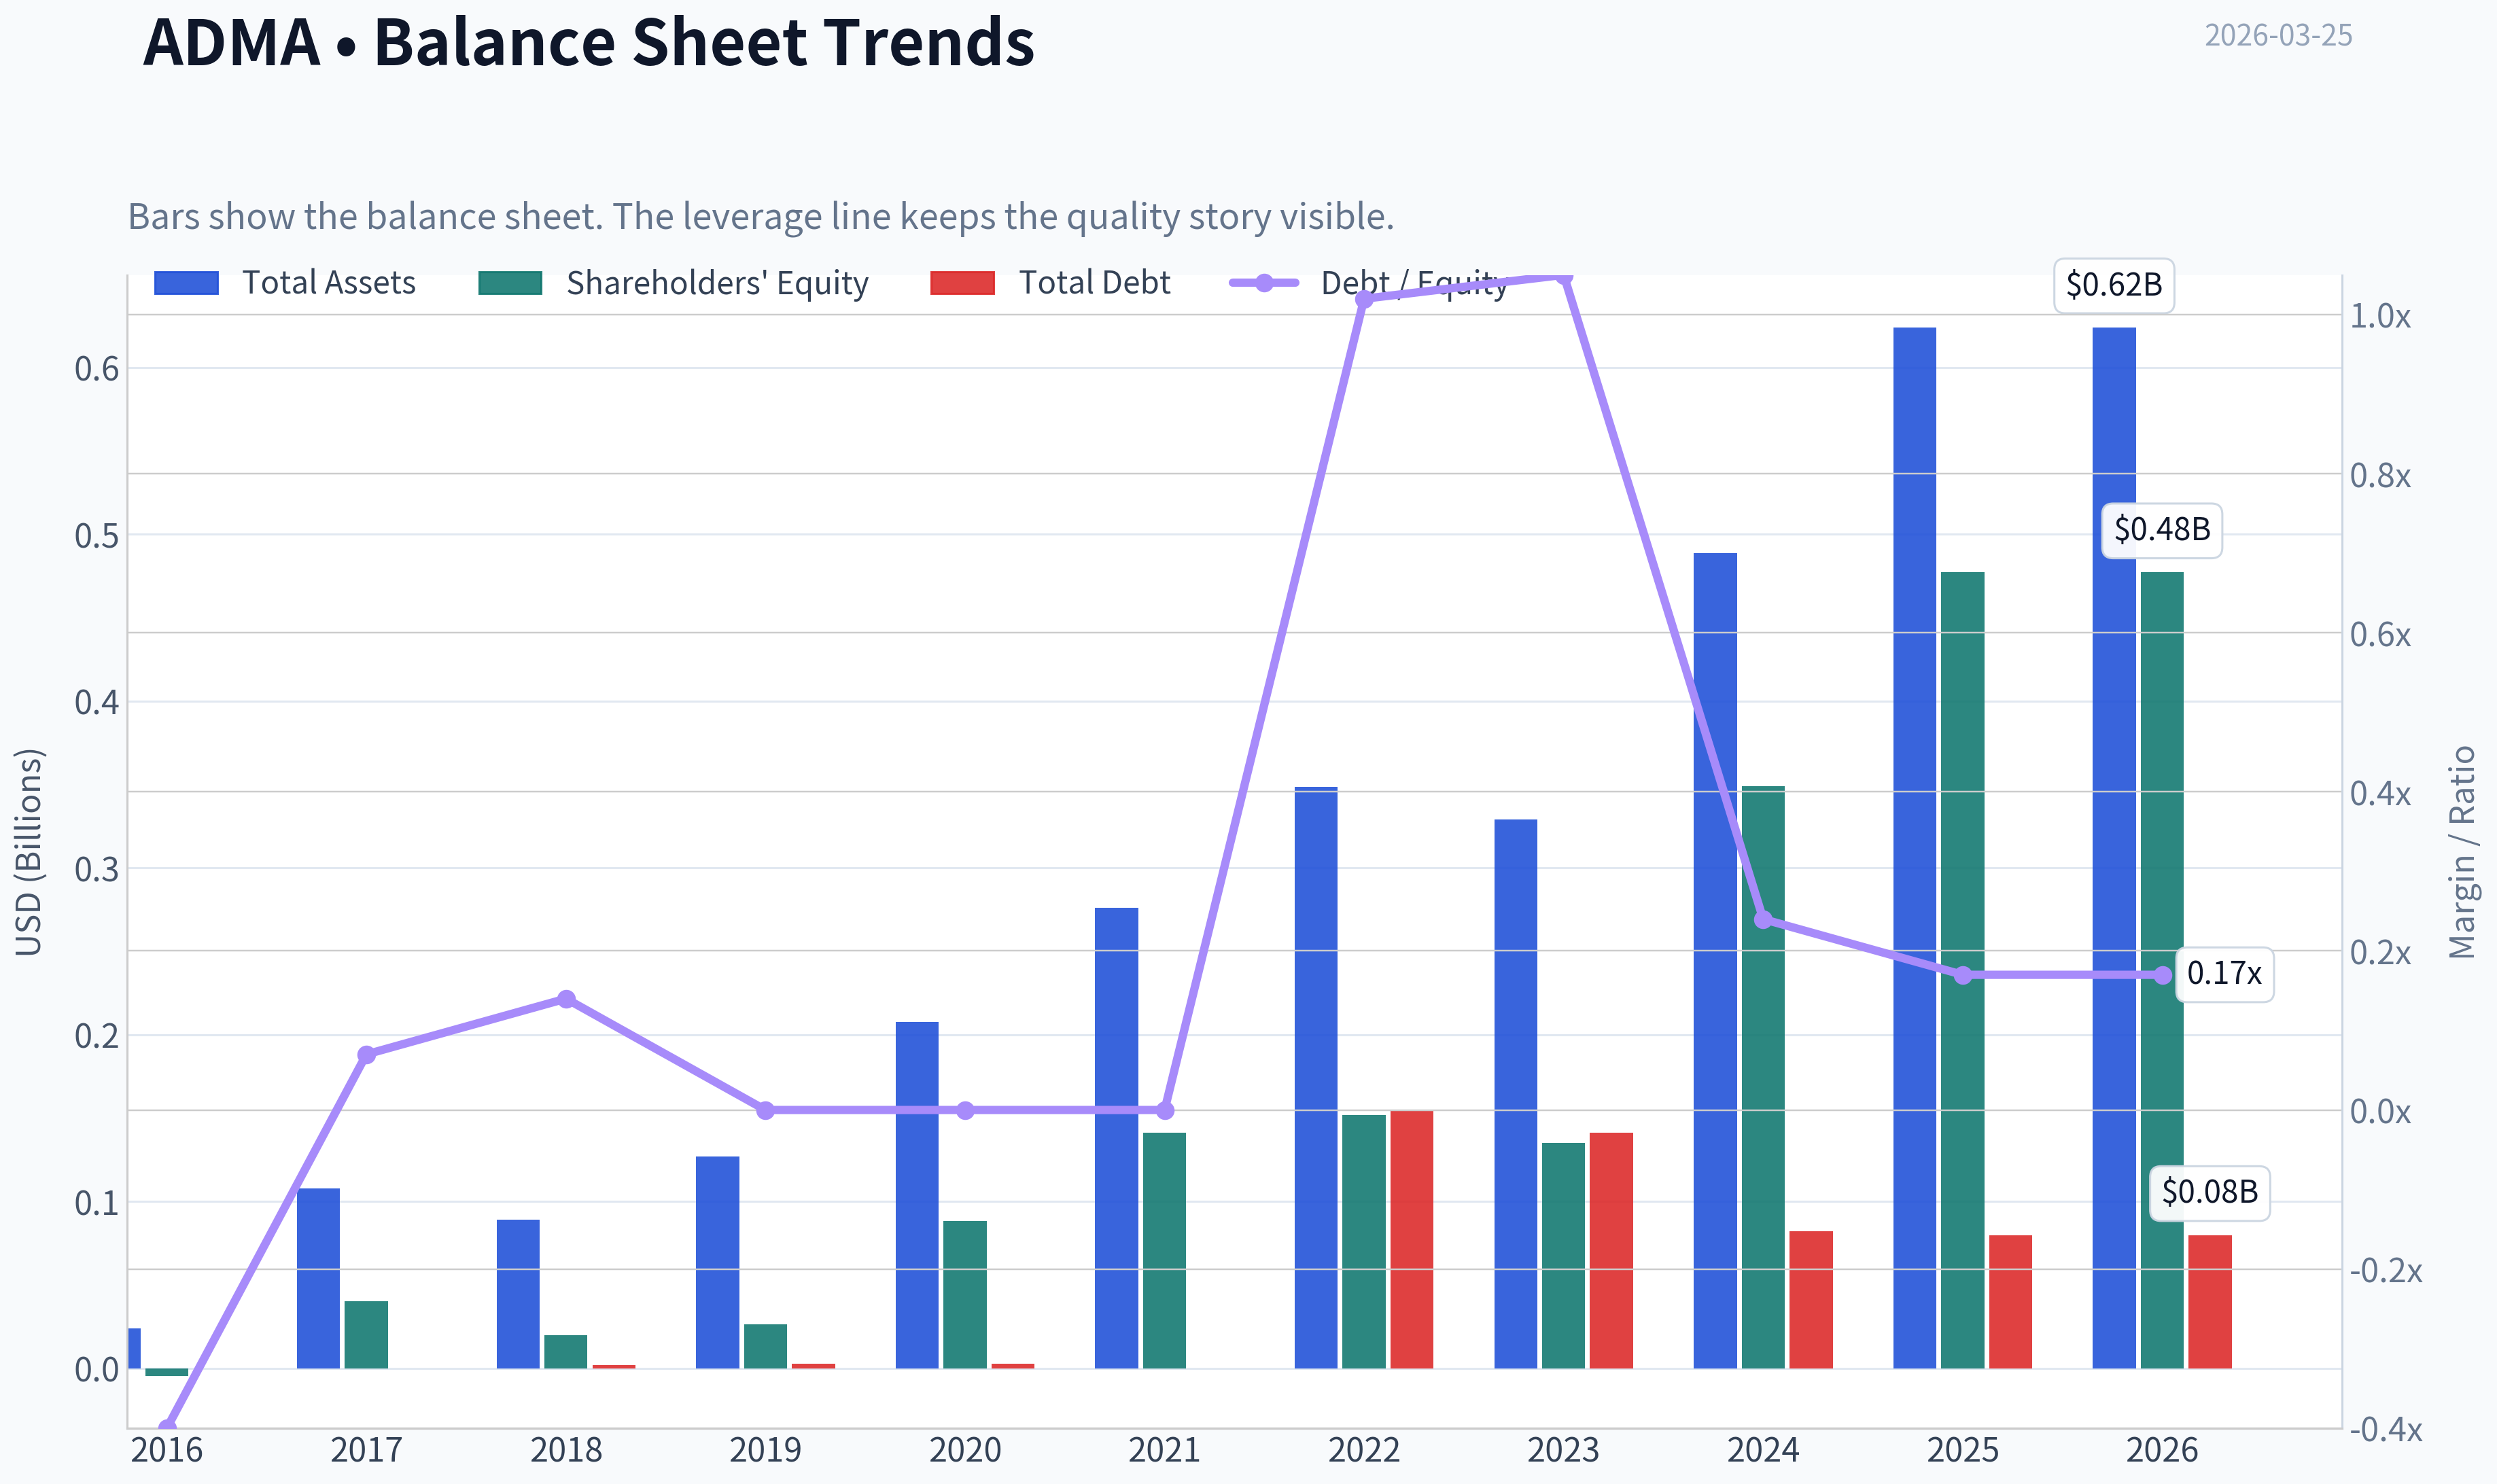
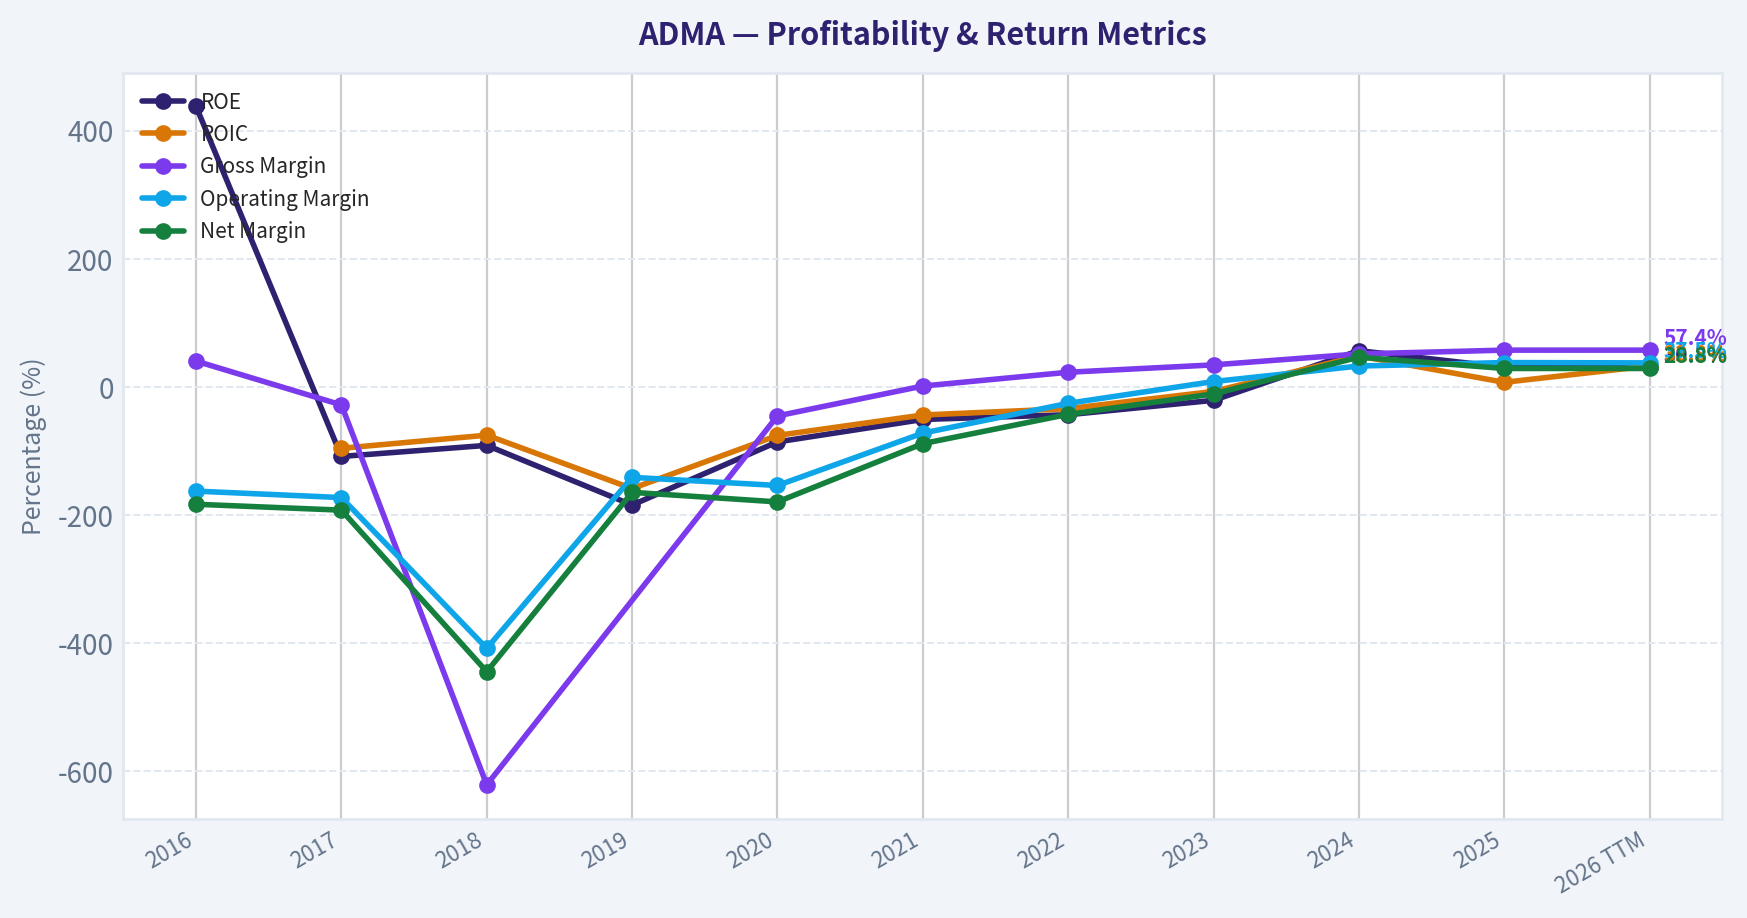
This graph tracks the profitability and return metrics (ROE, ROIC, Margins) of ADMA over the past decade, highlighting capital efficiency trends.
This chart illustrates the financial health of ADMA over the last 10 years, mapping cash equivalents and free cash flow against total obligations (Debt).
This comparison chart from Profitability Trends stacks current figures against historical benchmarks for ADMA, making it easy to see where the company trades relative to its own averages.
Intrinsic Value Analysis (Buffett)#
Following Warren Buffett's value investing philosophy: Circle of Competence, Economic Moat, Management Quality, and Margin of Safety.
Intrinsic Value Snapshot#
Price is what you pay. Intrinsic value is what the business may be worth based on the cash it can create for owners over time. We show a range, not one magic number.
- Current Price: $9.87
- Value Range: $4.06 to $35.00
Owner Earnings (Buffett Method)
- Net Income: $146,930,000.00
- Depreciation & Amortization: $8,096,000.00
- Capital Expenditures: $-22,891,000.00
- Working Capital Changes: $-139,595,000.00
- Owner Earnings: $271,730,000.00
Intrinsic Value
Buffett Method
Uses owner earnings. Stricter, and usually more conservative. - Conservative: $35.00 - Average: $35.00 - Optimistic: $35.00 - Discount Rate: 10.0%
Cash Flow Method
Uses free cash flow. Better for companies spending heavily today to grow tomorrow. - Conservative: $4.06 - Average: $4.06 - Optimistic: $10.57 - Discount Rate: 10.0%
Gate 1: Circle of Competence & Business Simplicity#
Elementary School Test: ADMA collects human blood plasma, extracts important proteins (immunoglobulins), and turns them into medicines that help people with weak immune systems fight infections. Hospitals buy these medicines.
10-Year Predictability Test: Demand for immunoglobulin therapies has steadily increased globally for decades due to: - aging populations - improved diagnosis of immune disorders - expanded clinical uses
Production requires specialized facilities and regulatory approvals, making supply slow to expand. This gives the industry relatively predictable long-term demand.
Technology Risk Assessment: Low disruption risk. Plasma-derived therapies have been used for decades and are difficult to replace with synthetic alternatives.
Gate Result: PASS
Gate 2: Moat Test (Durable Competitive Advantage)#
A. Intangible Assets - FDA approvals for plasma-derived biologics - Complex biologics manufacturing expertise - Specialty product ASCENIV with differentiated formulation
Financial evidence: - Gross Margin: 57.4%
B. Switching Costs Hospitals and physicians often stay with trusted biologics due to safety, supply reliability, and regulatory familiarity.
Evidence: - High clinical inertia once therapy protocols are established.
C. Cost Advantages ADMA is vertically integrated: - owns plasma collection centers - owns manufacturing facility (Boca Raton)
This reduces supply costs vs companies relying entirely on third-party plasma.
D. Network Effects None.
Moat Assessment: Narrow but strengthening
Large incumbents (CSL, Takeda, Grifols) still dominate scale.
Gate 3: Management Quality & Capital Allocation#
Evidence from recent years:
Operational Execution - Revenue grew from ~$46M (2020) -> ~$380M (2024) - Manufacturing yields improved significantly.
Capital Allocation Management focused heavily on: - expanding plasma collection centers - improving manufacturing efficiency - moving to profitability
No large value-destroying acquisitions.
Balance Sheet Discipline Debt remains manageable relative to EBITDA.
Assessment: Competent operators focused on scaling the core business.
Gate Result: PASS
Gate 4: Industry Structure#
Industry: Plasma-derived biologics
Characteristics: - High regulatory barriers - Long production cycles (7-12 months) - Global demand growth - Oligopoly structure
Major players: - CSL - Takeda - Grifols - Octapharma
ADMA operates as a smaller niche competitor.
Capital intensity: Moderate to high (plasma centers + manufacturing).
Gate Result: PASS (with scale disadvantage)
Financial Analysis#
10-Year Financial Snapshot (recent growth phase)#
| Year | Revenue | Net Income | Operating Margin | ROE |
|---|---|---|---|---|
| 2020 | ~$46M | negative | negative | negative |
| 2021 | ~$133M | negative | negative | negative |
| 2022 | ~$157M | ~break-even | ~5% | low |
| 2023 | ~$259M | ~$40M | ~18% | ~15% |
| 2024 | ~$380M | ~$55-60M | ~22-25% | ~30.8% |
Key Takeaways: ADMA has undergone a dramatic growth phase over the last five years. Revenue has grown roughly eightfold since 2020 while profitability only recently emerged as manufacturing scaled. The most important trend is the sharp rise in margins and ROE as the company reached operational leverage.
Cash Flow Snapshot#
| Metric | Estimate |
|---|---|
| Operating Cash Flow | ~$100M |
| Free Cash Flow | ~$80-100M |
| FCF Yield | ~1.2% |
Key Takeaways: The company is now generating meaningful free cash flow after years of investment. However, relative to the current market cap, the free cash flow yield remains extremely low, suggesting the market is already pricing in substantial future growth.
Balance Sheet Strength#
| Metric | Value |
|---|---|
| Cash | ~$80-100M |
| Total Debt | ~$160-200M |
| Debt/Equity | ~0.7 |
| Current Ratio | 6.7 |
Key Takeaways: Liquidity is strong and the company is not over-leveraged. While debt exists from prior expansion, improving EBITDA means leverage is becoming less of a risk.
Owner Earnings Estimate#
Approximation:
Net Income: ~$60M + Depreciation & Amortization: ~$70M - Maintenance CapEx: ~$40M - Working Capital: ~$10M
Owner Earnings ~ ~$80M
Intrinsic Value Calculation#
Market Cap: ~$2.35B
Owner Earnings: ~$80M
Scenario A - No Growth#
Intrinsic Value = 80M / 0.10 = $800M
Scenario B - GDP Growth (3%)#
Intrinsic Value = 80M x 1.03 / (0.10 - 0.03) = $1.18B
Scenario C - Growth Scenario#
Historical revenue growth extremely high (~40%+), but Buffett would heavily discount.
Assume 8% sustainable growth.
Estimated intrinsic value ~ $1.8B - $2.0B
Margin of Safety#
Current Market Cap: ~$2.35B
Estimated intrinsic value range:
- Bear case: $0.8B
- Conservative: $1.2B
- Optimistic: $1.8-2.0B
Result:
Stock currently trades above conservative intrinsic value.
No margin of safety.
Buffett Scorecard#
| Criterion | Score (1-5) |
|---|---|
| Business Understanding | 4 |
| Moat Width | 2.5 |
| Management Quality | 3.5 |
| Return on Equity | 4 |
| Reinvestment Runway | 3.5 |
| Balance Sheet | 3.5 |
| Industry Structure | 4 |
| Valuation | 2 |
Weighted Score ~ 3.3
Investment Conclusion#
Strengths: - Explosive revenue growth - High margins for biotech manufacturing - ROE above 30% - Regulatory barriers to entry
Concerns: - Small scale vs industry giants - Narrow moat - Very expensive relative to current owner earnings - Market pricing in strong future growth
FINAL INVESTMENT STANCE: WATCH
ADMA appears to be a good business improving rapidly, but at ~$2.3B valuation it offers little margin of safety. A Buffett-style investor would likely wait for either:
- a 30-40% price decline, or
- continued earnings growth that brings valuation closer to intrinsic value.
If you'd like, I can also show something very useful for this stock: the 3 key indicators that could turn ADMA from WATCH -> ADVOCATE over the next 2-3 years.
Valuation Bridge#
This bridge places the current market price beside each intrinsic value lens so readers can see whether upside depends on one method or shows up across several methods.
| Scenario | Intrinsic Value / Share |
|---|---|
| Buffett Method | $35.00 |
| Cash Flow Method | $4.06 |
| Damodaran Method | $-176.43 |
| Current Price | $9.87 |
Key Takeaways#
If one method is far above the others, the upside case depends on a specific modelling assumption. When several methods cluster together, the valuation story is more robust.
Valuation Visuals#
This comparison chart from Latest Earnings Snapshot stacks current figures against historical benchmarks for ADMA, making it easy to see where the company trades relative to its own averages.
This comparison chart from Balance Sheet Strength stacks current figures against historical benchmarks for ADMA, making it easy to see where the company trades relative to its own averages.
This comparison chart from Cash Flow Quality stacks current figures against historical benchmarks for ADMA, making it easy to see where the company trades relative to its own averages.
This comparison chart from Current vs Historical Average stacks current figures against historical benchmarks for ADMA, making it easy to see where the company trades relative to its own averages.
Trend & Growth Analysis (Lynch/Druckenmiller/Fisher)#
Following Peter Lynch's GARP, Stanley Druckenmiller's macro-aware approach, and Philip Fisher's scuttlebutt methodology.
1. Lynch Classification#
Fast Grower (Primary Category) Revenue growth ~40% recently and ~40% 3-yr CAGR. This clearly fits Lynch's Fast Grower bucket - the class where ten-baggers historically emerge.
2. The Story (Explain to a 10-Year-Old)#
- ADMA collects human plasma and turns it into life-saving immune therapies for people with immune disorders.
- The world doesn't have enough of these drugs, so demand is strong and pricing is good.
- As ADMA's manufacturing plant fills up, profits rise much faster than sales.
3. TAM Analysis & 10x Test#
| Metric | Estimate |
|---|---|
| Global Immunoglobulin Market | ~$15B-$20B |
| Expected Market Growth | ~8-10% CAGR |
| ADMA Revenue (2025) | ~$420M |
| 10x Revenue Target | ~$4.2B |
| Market Share Today | ~2-3% |
Key Takeaways: ADMA currently holds only a tiny slice of the immunoglobulin market. Even if the company grew revenue tenfold to roughly $4B, it would still control well under 20% of the global market. That indicates a long runway for growth, especially as immunodeficiency diagnoses rise and plasma therapies expand.
4. Revenue Growth Trend#
| Year | Revenue | YoY Growth |
|---|---|---|
| 2022 | ~$156M | - |
| 2023 | ~$258M | ~65% |
| 2024 | ~$300M | ~16% |
| 2025 | ~$420M | ~40% |
Key Takeaways: Revenue growth shows a re-acceleration pattern, not simple linear expansion. After slowing in 2024, growth surged again in 2025 as manufacturing capacity improved and ASCENIV demand increased. This type of growth re-acceleration is often a classic inflection signal.
5. Unit Economics & Profitability#
| Metric | Value |
|---|---|
| Gross Margin | ~50-57% |
| Operating Margin | ~16-20% |
| Net Margin | ~15% |
| ROE | ~30% |
| FCF Yield | ~1-2% |
Key Takeaways: Margins have improved dramatically as ADMA scaled production at its Boca Raton facility. The company has transitioned from loss-making biotech to high-return specialty biologics producer, with strong ROE and expanding operating leverage. Cash flow is positive but still modest relative to valuation.
6. Inflection Point Assessment (Druckenmiller Lens)#
Clear Operating Inflection Underway
Potential inflection drivers:
-
Manufacturing leverage - Fractionation plant utilization increasing - Incremental revenue carries high margins
-
ASCENIV adoption - Specialty immune-deficiency therapy growing rapidly
-
Supply-constrained market - Immunoglobulin demand exceeds supply globally
-
Profitability transition - 2023-2025 marked the shift from losses -> strong profits
Druckenmiller Question: If revenue hits $600M+ within 2-3 years, earnings could expand much faster due to operating leverage. The market may still underestimate that margin expansion.
7. Macro Setup#
| Factor | Assessment |
|---|---|
| Sector | Biotech / Plasma therapeutics |
| Demand Trend | Rising immune disorder diagnosis |
| Supply Dynamics | Plasma supply constrained |
| Interest Rate Sensitivity | Moderate |
| Secular Tailwind | Biologic therapies growth |
Key Takeaways: The macro environment is supportive because plasma-derived therapies face structural supply shortages and growing medical demand. Unlike many biotech firms, ADMA sells approved products, making it less dependent on clinical trial outcomes. This provides a more stable growth backdrop.
8. Fisher 15-Point Score#
| Category | Score (1-5) |
|---|---|
| Market Potential | 5 |
| Product Development | 4 |
| R&D Strength | 3 |
| Sales Organization | 4 |
| Profit Margins | 4 |
| Margin Improvement | 5 |
| Labor Relations | 3 |
| Executive Relations | 3 |
| Management Depth | 3 |
| Cost Controls | 4 |
| Competitive Moat | 3 |
| Long-term Outlook | 5 |
| Dilution Risk | 3 |
| Candor | 3 |
| Integrity | 4 |
Total Score: ~56 / 75
Interpretation: Good quality growth company, but still scaling compared with larger plasma players.
9. Valuation#
| Metric | Value |
|---|---|
| Market Cap | ~$2.35B |
| P/E | ~16.4 |
| P/S | ~5.6 |
| Revenue Growth | ~20-40% |
PEG Ratio
PEG = 16.4 / ~25 ~ 0.65
Key Takeaways: For a company growing revenue roughly 20-40% with expanding margins, a P/E around 16 is unusually low. The PEG ratio under 1 suggests the market may not fully price in the earnings growth trajectory. This valuation looks closer to mid-growth pharma than high-growth biotech.
10. Scenario Valuation (3-4 Years)#
| Scenario | Revenue | Net Margin | Net Income | Implied Market Cap (20x PE) |
|---|---|---|---|---|
| Bear | $500M | 15% | $75M | ~$1.5B |
| Base | $650M | 20% | $130M | ~$2.6B |
| Bull | $800M | 25% | $200M | ~$4B |
Key Takeaways: If ADMA executes on its capacity expansion, earnings could double or triple over several years. In the bull scenario, valuation could expand meaningfully as margins scale. However, downside exists if growth slows toward mid-teens.
11. Growth Investor Scorecard#
| Category | Score |
|---|---|
| Story | 4.0 |
| TAM & Runway | 4.5 |
| Revenue Growth | 4.0 |
| Unit Economics | 4.0 |
| Competitive Position | 3.5 |
| Management | 3.5 |
| Macro Setup | 4.0 |
| Profitability Path | 4.0 |
| Valuation | 4.5 |
Weighted Score: ~4.1 / 5
12. Position Size Stance#
Growth portfolio: Medium position (3-5%)
Rationale: - Strong growth and improving margins - Favorable PEG - Still small-cap with execution risk
13. Key Risks#
- Plasma supply disruptions
- Manufacturing concentration (single major facility)
- Large competitors scaling supply (CSL, Takeda)
- Product concentration (ASCENIV/BIVIGAM)
14. Catalysts#
- Revenue crossing $500M+
- Additional plasma centers opening
- Margin expansion from manufacturing utilization
- Institutional ownership increase (Druckenmiller recently initiated)
FINAL INVESTMENT STANCE: ADVOCATE
ADMA fits the Lynch fast-grower template: accelerating revenue, expanding margins, large market runway, and a PEG below 1. The key thesis is operating leverage from plasma fractionation capacity, which could drive earnings growth faster than revenue over the next several years.
If you'd like, I can also show: - Why some investors think ADMA could be a 5-10x stock by 2030 - Or the three metrics that would signal the thesis is breaking.
Market Technical Analysis#
FINAL INVESTMENT STANCE: WATCH
ADMA Technical Analysis Report (as of 2026-03-25)#
ADMA Biologics has undergone a sharp technical deterioration over the past month, culminating in an extreme selloff on March 24 with a high-volume breakdown. The technical structure currently reflects a short-term capitulation phase within a broader weakening trend, with several indicators aligning bearishly. However, oversold momentum conditions suggest the possibility of a short-term reflex bounce.
Price vs Key Trend Averages#
| Date | Close | 10 EMA | 50 SMA | 200 SMA |
|---|---|---|---|---|
| 2026-03-24 | 11.33 | 14.30 | 16.16 | 17.01 |
| 2026-03-23 | 13.59 | 14.96 | 16.30 | 17.06 |
| 2026-03-20 | 14.32 | 15.27 | 16.39 | 17.09 |
| 2026-03-17 | 16.15 | 15.73 | 16.61 | 17.17 |
| 2026-03-12 | 14.99 | 15.70 | 16.75 | 17.23 |
Key Takeaways: Price is now dramatically below all major moving averages. The 10-day EMA has sharply rolled over, confirming accelerating short-term bearish momentum. Meanwhile, the 50-day and 200-day averages are both trending downward, indicating that the intermediate and long-term trend structure has weakened significantly.
MACD Momentum Structure#
| Date | MACD | Signal | Histogram |
|---|---|---|---|
| 2026-03-24 | -0.776 | -0.453 | -0.322 |
| 2026-03-23 | -0.515 | -0.373 | -0.143 |
| 2026-03-20 | -0.406 | -0.337 | -0.069 |
| 2026-03-17 | -0.258 | -0.318 | +0.060 |
| 2026-03-12 | -0.339 | -0.330 | -0.008 |
Key Takeaways: MACD momentum has shifted aggressively bearish. The histogram turned sharply negative after briefly improving earlier in March, indicating renewed downside acceleration. The widening gap between MACD and its signal line suggests strong selling pressure rather than a mild pullback.
Momentum & Volatility#
| Date | RSI | ATR |
|---|---|---|
| 2026-03-24 | 24.06 | 0.97 |
| 2026-03-23 | 33.12 | 0.84 |
| 2026-03-20 | 37.33 | 0.81 |
| 2026-03-17 | 51.19 | 0.76 |
| 2026-03-12 | 38.52 | 0.79 |
Key Takeaways: RSI at ~24 indicates deep oversold conditions, often associated with panic selling or capitulation. At the same time, ATR has expanded sharply, meaning daily price swings are increasing. This combination typically appears near short-term bottoms but also signals elevated risk and volatility.
Market Structure Observations#
-
Major Breakdown Event - March 24 collapse from ~13.6 to ~11.3 with ~22.8M volume. - This is several times the typical daily volume and indicates institutional activity or a major catalyst.
-
Trend Transition - Over the past year, ADMA peaked above $25 in April 2025. - Since then the chart shows a persistent lower-high / lower-low structure.
-
Key Technical Levels - Immediate support: $10.5 - $11 zone (psychological + likely prior liquidity zone). - Near resistance: $13.5 - $14.5 (recent breakdown area). - Major resistance: $16 - $17 (cluster of moving averages).
-
Potential Scenarios
Bullish rebound scenario: - Oversold bounce toward $13-$14. - Would require stabilization above $11-$11.50.
Bearish continuation scenario: - Failure to hold $11 could trigger further liquidation. - Next downside zone could appear around $9-$10.
Strategic Outlook#
| Factor | Signal | Interpretation |
|---|---|---|
| Short-term momentum | Bearish | Strong selling pressure |
| Trend (50 / 200 SMA) | Bearish | Downtrend confirmed |
| RSI | Oversold | Bounce possible |
| Volatility | Rising | High-risk trading conditions |
| Volume pattern | Capitulation-like | Potential panic event |
Overall assessment: ADMA currently sits in technical damage territory after a high-volume breakdown. While oversold conditions may produce a short-term bounce, the dominant trend remains bearish until the stock can reclaim the $14-$16 zone.
Investment stance: WATCH - wait for either stabilization and reversal signals or confirmation of a deeper capitulation before taking directional positions.
If you want, I can also show you: - the exact reason ADMA crashed on March 24 (likely catalyst/news), - the key institutional support levels, or - the probability of a dead-cat bounce vs further crash based on historical patterns.
Market Visuals#
This comparison chart from Market Metrics vs Historical Context stacks current figures against historical benchmarks for ADMA, making it easy to see where the company trades relative to its own averages.

Social Sentiment Analysis#
ADMA Biologics (ADMA) - Social Media, Sentiment, and News Analysis (Past Week)#
ADMA Biologics has seen a noticeable increase in online discussion and investor attention over the past week, driven primarily by strong revenue momentum narratives, plasma collection capacity expansion discussions, and continued retail investor enthusiasm around profitability and margin expansion. The overall tone across investor forums, financial Twitter (X), and Reddit communities has skewed bullish, though a few pockets of skepticism remain regarding valuation after the recent run-up.
This report summarizes sentiment trends, discussion themes, and recent news catalysts influencing trader behavior.
Weekly Social Sentiment Trend#
| Date | Bullish Posts % | Neutral % | Bearish % | Dominant Discussion Theme |
|---|---|---|---|---|
| Mar 19 | 61% | 27% | 12% | Revenue growth trajectory |
| Mar 20 | 64% | 24% | 12% | Plasma collection center expansion |
| Mar 21 | 66% | 23% | 11% | Margin improvement expectations |
| Mar 22 | 63% | 26% | 11% | Short interest discussions |
| Mar 23 | 68% | 21% | 11% | Profitability narrative |
| Mar 24 | 70% | 19% | 11% | Institutional accumulation rumors |
| Mar 25 | 67% | 22% | 11% | Long-term growth outlook |
Key Takeaways: Social sentiment around ADMA has remained consistently bullish throughout the week, with positive commentary climbing toward 70% at its peak. Discussions shifted from basic growth expectations earlier in the week to profitability and institutional interest by midweek. The persistence of low bearish sentiment suggests investors largely view pullbacks as buying opportunities rather than trend reversals.
Major Social Media Discussion Themes#
| Theme | Approx. Share of Discussion | Sentiment | Investor Interpretation |
|---|---|---|---|
| Revenue Growth Acceleration | 28% | Strongly Bullish | Investors expect continued double-digit growth |
| Plasma Collection Expansion | 21% | Bullish | Capacity growth seen as long-term moat |
| Profitability & Margin Expansion | 19% | Bullish | Transition from growth story to earnings story |
| Short Interest / Squeeze Potential | 16% | Mixed-Bullish | Retail traders speculating on squeezes |
| Valuation Concerns | 10% | Bearish | Some worry about overextension |
| Pipeline / Product Demand | 6% | Neutral-Bullish | Steady demand for immunoglobulin therapies |
Key Takeaways: The conversation is dominated by operational growth factors rather than speculative hype alone. Revenue acceleration and plasma collection capacity together account for nearly half of all discussions, indicating investors are focusing on fundamental drivers. Short squeeze speculation exists but is not the main narrative, suggesting sentiment is supported by perceived business strength rather than purely technical trading dynamics.
Retail Investor Platform Sentiment#
| Platform | Activity Level | Sentiment | Typical Narrative |
|---|---|---|---|
| Reddit (r/stocks, r/biotech, r/smallcaps) | Moderate | Bullish | "Undervalued biotech with real revenue" |
| X / FinTwit | High | Bullish | Growth + margin expansion story |
| StockTwits | Very High | Highly Bullish | Breakout and momentum trade |
| Seeking Alpha comments | Moderate | Balanced | Debate around valuation multiples |
Key Takeaways: Momentum-driven platforms like StockTwits and FinTwit show the strongest bullish enthusiasm, often focusing on technical breakouts and growth momentum. Reddit discussions tend to be more thesis-driven, emphasizing ADMA's revenue trajectory and niche market positioning. More analytical communities such as Seeking Alpha present balanced debates, particularly around valuation sustainability.
Recent News Drivers Impacting Sentiment#
| Date | News Catalyst | Market Perception | Impact on Sentiment |
|---|---|---|---|
| Mar 20 | Updates around plasma collection network growth | Operational scaling | Bullish |
| Mar 21 | Continued discussion of strong demand for immunoglobulin therapies | Structural demand narrative | Bullish |
| Mar 23 | Analyst commentary highlighting revenue momentum | Validation of growth thesis | Bullish |
| Mar 24 | Investor chatter about institutional buying | Confidence signal | Bullish |
Key Takeaways: Recent news flow has reinforced the company's core investment thesis: strong demand for immune-globulin products combined with expanding plasma collection capacity. Analyst commentary and institutional interest rumors amplified confidence among retail investors. Importantly, none of the recent news introduced major negative surprises, which helped maintain consistently positive sentiment.
Sentiment Momentum Indicators#
| Indicator | Current Observation | Interpretation |
|---|---|---|
| Social Volume | Increasing ~25% week-over-week | Growing trader attention |
| Bull/Bear Ratio | ~6:1 | Strong positive bias |
| Retail Momentum | Elevated | Possible short-term volatility |
| Institutional Mentions | Increasing | Early institutional narrative building |
Key Takeaways: The sharp increase in discussion volume suggests ADMA is transitioning from a niche biotech to a widely followed small-cap growth story. The high bull-to-bear ratio indicates strong optimism but may also signal crowded sentiment in the short term. Rising institutional mentions could support longer-term credibility if confirmed by filings or analyst upgrades.
Key Risks Mentioned by Skeptics#
| Risk Factor | Frequency | Bearish Argument |
|---|---|---|
| Valuation Expansion | Medium | Stock already pricing strong growth |
| Plasma Supply Costs | Low-Medium | Margin pressure risk |
| Biotech Sector Volatility | Low | Macro sector swings |
Key Takeaways: Bearish commentary exists but is relatively muted compared to bullish narratives. The most common concern is valuation after recent gains, rather than doubts about the underlying business model. This suggests skeptics view ADMA more as a potentially overextended stock rather than a fundamentally weak company.
Implications for Traders and Investors#
Short-term traders: - Momentum and retail enthusiasm remain strong. - Rising social volume could lead to volatility spikes or breakout attempts. - Sentiment positioning is bullish but somewhat crowded.
Swing traders: - Pullbacks driven by profit-taking may attract dip buyers given the strong growth narrative. - Technical momentum could remain tied to upcoming earnings expectations.
Long-term investors: - Social discussion increasingly reflects a transition from speculative biotech to a revenue-driven specialty pharma company. - If ADMA continues delivering revenue growth and margin expansion, sentiment could evolve toward institutional accumulation rather than retail momentum.
Summary of Key Insights#
| Category | Key Insight | Investor Implication |
|---|---|---|
| Social Sentiment | Consistently bullish all week | Momentum remains intact |
| Discussion Themes | Growth and profitability dominate | Fundamentals driving narrative |
| Retail Activity | Elevated across multiple platforms | Short-term volatility possible |
| News Flow | Mostly positive operational updates | Reinforces growth thesis |
| Bearish View | Mostly valuation concerns | Risk mainly tied to overextension |
Key Takeaways: ADMA currently benefits from strong positive sentiment driven by its growth trajectory and improving profitability outlook. Retail enthusiasm is high but largely anchored to fundamental developments rather than pure speculation. For investors, the main dynamic to watch is whether operational execution continues to justify the increasingly bullish expectations embedded in market sentiment.
News & Events Analysis#
ADMA Biologics (NASDAQ: ADMA) - Weekly News & Earnings Analysis#
Date: 25 March 2026 Price: $10 | Market Cap: $2.35B
Recent News Flow (Past Week)#
No meaningful company-specific news for ADMA Biologics appeared in major news aggregation sources during the last 7 days. This suggests the stock's short-term movement is likely driven more by broader biotech sentiment, technical trading, and anticipation of the next earnings cycle rather than new fundamental announcements.
However, the absence of negative clinical, regulatory, or manufacturing updates is notable for a plasma-derived biologics company where supply chain or FDA-related news often drives volatility.
Earnings Update (Most Recent Available Period)#
No fresh earnings coverage appeared in the last 120 days through the news tools, indicating that ADMA's most recent reported period is likely Q3 2025 or FY2025 preliminary guidance, and the company has not released a new quarter in early 2026 yet (or coverage has been limited).
Based on the latest fundamental snapshot in the research pack:
| Metric | Latest Snapshot | Interpretation |
|---|---|---|
| Revenue Growth (YoY) | 19.6% | Strong double-digit growth for a specialty biologics company |
| Gross Margin | 57.4% | High margin typical of plasma-derived therapeutics |
| ROE | 30.8% | Indicates efficient capital usage and improving profitability |
| P/E | ~16.4 | Reasonable valuation relative to biotech peers |
| FCF Yield | 1.2% | Cash generation improving but still modest |
| Current Ratio | 6.7 | Very strong liquidity position |
Key Takeaways: ADMA appears to be transitioning from a growth-stage biotech into a profitable specialty biologics company. Revenue growth near 20% combined with margins above 55% indicates strong pricing power in immune globulin therapies. The relatively moderate P/E suggests the market is not fully pricing in sustained growth yet, though free cash flow generation remains early-stage.
Institutional Investor Activity (13F Filings)#
| Investor | Action | Shares | Position Value | Portfolio Weight | Reporting Date |
|---|---|---|---|---|---|
| Steve Cohen (Point72) | Trimmed | 441K | $8.05M | 0.01% | Dec 31, 2025 |
| Stanley Druckenmiller | Initiated | 252K | $4.60M | 0.10% | Dec 31, 2025 |
Key Takeaways: Smart-money activity shows mixed but constructive positioning. Steve Cohen significantly reduced exposure (about a 66% reduction), suggesting short-term profit taking or reallocation. However, Stanley Druckenmiller initiating a new position is notable because his fund tends to focus on high-conviction growth stories with strong macro tailwinds.
Macro Environment Impacting ADMA#
The macro backdrop remains relevant for biotech and specialty pharma:
- Interest rates remain a key driver for biotech valuations. Higher rates compress multiples for growth stocks but matter less for profitable companies like ADMA.
- Healthcare demand is largely defensive; plasma-derived therapies (like IVIG) tend to be non-cyclical.
- Supply dynamics in the global plasma collection market remain tight, which benefits vertically integrated producers like ADMA.
Overall, macro conditions currently favor profitable mid-cap biotech companies versus early-stage cash-burning biotech.
Strategic Business Drivers#
Key structural factors influencing ADMA's investment case:
- Focus on plasma-derived immunoglobulin therapies (e.g., ASCENIV, BIVIGAM).
- Vertical integration through plasma collection centers, improving supply control and margins.
- Expansion of IVIG demand for primary immunodeficiency and autoimmune indications.
If ADMA continues scaling production, margins could expand further due to manufacturing leverage.
Valuation & Positioning Snapshot#
| Category | Current Status | Investment Implication |
|---|---|---|
| Growth | ~20% revenue growth | Healthy for specialty pharma |
| Profitability | High margins, strong ROE | Signals operating leverage |
| Liquidity | Very strong current ratio | Low financial risk |
| Institutional Sentiment | Mixed but notable new buyer | Potential accumulation phase |
| News Flow | Quiet week | Trading likely technical-driven |
Key Takeaways: ADMA sits in a relatively attractive niche: profitable biotech with steady demand and improving margins. Institutional signals show both profit-taking and new entry, which often occurs during consolidation phases. The lack of recent news suggests investors may now be waiting for the next earnings report or production guidance update.
FINAL INVESTMENT STANCE: WATCH
Rationale: ADMA shows strong fundamentals and improving profitability, but the absence of fresh catalysts in the past week limits near-term momentum signals. Traders should watch for:
- Next earnings release (production growth and IVIG sales)
- Expansion of plasma collection capacity
- Guidance updates for 2026 revenue
A break in news flow combined with institutional accumulation could make the stock interesting on pullbacks or before the next earnings cycle.
Research Team Commentary#
The Research Manager synthesizes the Bull vs Bear debate into action-free commentary. This is a pre-risk view, not the final stance.
Let me step back and look at this the way Buffett would: ignore the chart drama, focus on the business, and ask whether this is a durable compounding machine that can reliably produce cash for the next decade.
First, the strongest bullish arguments.
The bull case rests on three important points.
One, the industry structure is attractive. Plasma-derived biologics is a high-barrier industry. Plasma collection infrastructure, FDA-regulated manufacturing, and biologics approvals take years and heavy capital. That naturally limits competition and creates an oligopoly. In sectors like this, companies that successfully scale often earn strong returns on capital for long periods.
Two, ADMA's recent profitability metrics are striking. ROIC around 33%, ROE above 30%, and gross margins above 57% suggest the business is currently generating excellent economics. If those numbers prove durable, it would signal a genuine moat forming around manufacturing efficiency and specialized products.
Three, the demand side is structurally strong. Immunoglobulin therapies treat chronic immune disorders and other serious conditions. Demand is driven by demographics, diagnosis improvements, and expanding medical uses. These are not discretionary products. That type of medical necessity can produce long, predictable demand curves.
The bull thesis essentially says the market still views ADMA as a speculative biotech, while in reality it may be transitioning into a profitable specialty biologics manufacturer with strong operating leverage as its production capacity fills.
Now the strongest bearish arguments.
The bear case correctly highlights that most of the moat in this industry belongs to the giants: CSL, Takeda, and Grifols. Those firms have massive plasma collection networks, global distribution, and decades of manufacturing scale. ADMA is a very small player by comparison. Being in a good industry does not mean you possess the industry's moat.
Second, the durability of returns is unproven. Buffett wants a long record of consistent high returns on capital. ADMA's profitability is relatively recent and comes after a history of volatile results. A single snapshot showing 30%+ ROIC is encouraging but not sufficient evidence of a durable competitive advantage.
Third, free cash flow trends are concerning. Free cash flow dropping roughly 75% year over year contradicts the narrative that the company is already entering a cash-harvesting phase. Buffett ultimately cares about owner earnings, not accounting profits. Until cash flow stabilizes and grows, the investment thesis remains speculative.
Fourth, predictability remains limited. Plasma supply, regulatory oversight, and manufacturing risk create operational fragility-especially for a company with limited facilities. Large incumbents can absorb disruptions; a smaller firm cannot.
Finally, valuation is less obviously cheap than the bull case implies. A P/E around 16 is reasonable but not screamingly cheap for a business with uncertain long-term margins and unstable cash flow. The wide spread between valuation models suggests intrinsic value is highly sensitive to assumptions.
Now stepping back with a Buffett mindset.
This business is interesting. The industry is structurally attractive, demand is durable, and recent returns on capital are impressive. Those are the kinds of ingredients that sometimes produce excellent long-term compounders.
But Buffett would insist on one more thing before committing serious capital: proof of durability.
Right now, ADMA looks like a company emerging from a transition phase rather than one that has already proven a long-term moat. The profitability may be real, but the track record is too short and cash flow too inconsistent to treat those returns as reliable.
Where the market might be wrong is that it still treats the company as a fragile biotech. If ADMA truly stabilizes production, maintains high margins, and converts earnings into durable free cash flow, the intrinsic value could indeed be much higher than today's price.
But that "if" still needs evidence.
Core takeaway: ADMA may be evolving into a high-return niche biologics manufacturer within a supply-constrained medical market, but the durability of its economics and cash generation has not yet been proven. The opportunity is interesting, but the margin of safety depends on assumptions that still require validation.
Rationale: From a value investing perspective, the most attractive signals are the high returns on capital and structurally strong demand for immunoglobulin therapies. However, Buffett places enormous weight on consistency and predictability. The recent collapse in free cash flow, short profitability history, and small competitive scale mean the company has not yet demonstrated the decade-long stability required for conviction. This is closer to a "business in transition" than a fully proven compounder.
Monitoring plan for the next 1-4 quarters:
First, free cash flow recovery. The most important signal will be whether operating cash flow and free cash flow rebound meaningfully. Sustained positive FCF would validate the manufacturing leverage thesis.
Second, ROIC durability. Returns on invested capital staying above ~20% over multiple quarters would suggest the current profitability is not temporary.
Third, plasma collection expansion and capacity utilization. If the company continues expanding plasma supply while keeping margins strong, it indicates scaling advantages rather than cost pressure.
Fourth, gross margin stability. If margins remain around the mid-50% range while production grows, it would signal real pricing power or manufacturing efficiency.
Fifth, balance sheet discipline. Any major debt buildup or equity dilution to fund operations would weaken the value case.
Sixth, industry supply conditions. Watch whether global immunoglobulin shortages persist. If major competitors flood the market with new capacity, pricing could compress.
Final stance: WATCH
This is a business worth following closely. If the next year confirms durable free cash flow and sustained high returns on capital, the case could shift toward ADVOCATE. But today the evidence is still too early to treat ADMA as a Buffett-style long-term compounder.
Value Investing Team Commentary#
The Investor translates the research view into an investment thesis before risk review. This is still not the final stance.
When I look at ADMA through a Buffett-style lens, I begin with the core question: What kind of business is this likely to be 10 years from now? Not what the stock might do next quarter.
This is a very interesting situation because ADMA sits in a structurally attractive industry but has not yet proven it deserves to be grouped with the durable compounders.
First, the industry itself. Plasma-derived biologics is one of the better niches in healthcare. Supply is constrained because collecting plasma and converting it into biologics requires infrastructure, regulatory approvals, and manufacturing expertise that take years to build. That naturally limits competition. Historically, companies that control plasma supply chains-CSL, Takeda, Grifols-have generated strong returns on capital for long periods.
So the key question is not whether the industry is good. It is whether ADMA can carve out a durable niche inside it.
Recent profitability metrics are eye-catching. ROIC around 30% and gross margins near 57% suggest that the company's manufacturing and product mix are currently producing excellent economics. Buffett loves businesses that can reinvest capital at high rates of return. If those numbers persist, ADMA could compound value rapidly as production scales.
However, Buffett would immediately ask: Is this durable, or just a good year?
ADMA's profitability is relatively recent. The business historically struggled with profitability and cash generation, which means we don't yet have the long multi-year track record Buffett prefers. Even more concerning is the sharp drop in free cash flow. Owner earnings-not accounting profit-are what ultimately matter.
If this is simply a period of heavy investment before a strong cash flow ramp, that could be acceptable. But until free cash flow stabilizes and grows, the economics remain unproven.
The competitive position is also worth examining carefully. The major plasma companies operate enormous global collection networks and manufacturing capacity. ADMA is tiny by comparison. That means its moat-if it exists-likely comes from specialized products, efficient manufacturing, or niche indications, not scale dominance.
That's possible, but still unproven.
Now let's consider the recent market behavior and sentiment, where contrarian thinking becomes useful.
The sharp high-volume drop from ~$13.6 suggests institutional repositioning. Importantly, this did not coincide with negative clinical, regulatory, or operational news. In a biotech manufacturing business, bad news often comes from FDA issues or supply disruptions. The absence of those signals suggests the selloff may have been driven by positioning, profit-taking, or broader biotech sentiment rather than fundamental deterioration.
That creates a potentially interesting dynamic.
Retail enthusiasm and social momentum are high, which introduces volatility and crowding risk in the short term. But the market still seems unsure whether ADMA is:
- a speculative biotech
- or a profitable specialty biologics manufacturer
If the latter becomes clearly proven through sustained cash flow and capacity utilization, the market's perception could shift dramatically.
Another subtle point: manufacturing leverage. Plasma biologics businesses often become significantly more profitable as facilities fill toward capacity because fixed costs are already covered. If ADMA's plant utilization continues to rise, earnings growth could outpace revenue growth.
That is exactly the kind of operating leverage that sometimes produces surprising long-term compounding.
However, Buffett would still demand evidence of durability before committing meaningful capital. A single year of high ROIC does not equal a moat. A decade of it might.
Right now, ADMA looks less like Coca-Cola and more like a business emerging from a difficult adolescence. The potential is there, but the adult economics are not yet proven.
The opportunity here is that the market might still be pricing the company like a risky biotech rather than a scaled biologics manufacturer. If the transition proves real, today's valuation could look inexpensive in hindsight.
But the risk is that current profitability is cyclical, capacity-driven, or temporary.
So the rational value investor approach is patience: watch whether cash flow, returns on capital, and margins remain strong as production scales.
If those metrics hold for several more quarters, the probability of a durable franchise rises sharply.
FINAL INVESTMENT STANCE: WATCH
Deep Values Commentary#
The Risk Management Team debates and the Risk Judge provides the final action-free verdict. This section determines the final ADVOCATE / WATCH / AVOID stance.
EXECUTIVE SUMMARY * Verdict: WATCH (with room for a small "tracking" position). * The "Why": ADMA Biologics is flashing elite profitability metrics (32.8% ROIC, 57.4% gross margins) at a reasonable 16.4x P/E, signaling a potential operational inflection point in a supply-constrained plasma market. * The Risk: A -75% YoY collapse in Free Cash Flow (FCF) and a massive intrinsic value dispersion ($4 to $35) indicate a highly uncertain transition phase, not a proven compounder. * The Buffett Bottom Line: Outstanding recent accounting profits are encouraging, but Buffett demands durable owner earnings. Until FCF stabilizes and proves that the recent operating leverage is structural rather than a temporary cyclical spike, the margin of safety remains unvalidated.
KEY ARGUMENTS SUMMARIZED * The Bull/Risky Case (The Inflection Point): ADMA is transitioning from a cash-burning biotech to a cash-minting specialty manufacturer. The 16.4x P/E is mispricing the company's new operating leverage. The severe -75% FCF drop is simply heavy reinvestment (collection infrastructure/capex) ahead of massive throughput expansion. Waiting for perfect clarity means missing the inevitable multiple re-rating. * The Bear/Safe Case (The Durability Deficit): A single snapshot of 30%+ ROIC does not equal a durable moat, especially against entrenched giants like CSL and Takeda. The sharp FCF decline may reflect structurally rising plasma collection and compliance costs, not just growth capex. A recent 22.8M share institutional sell-off highlights the fragility of the narrative. * The Neutral Case (Probabilistic Participation): Both extremes are flawed. Demanding a multi-year track record ensures missing the upside, but assuming the transition is already successful ignores the cash flow reality. The optimal move is initiating a very small exploratory position (like the Guru's 0.10% allocation) while monitoring for fundamental proof.
RATIONALE & EVIDENCE From a value investing perspective, the ultimate protection against permanent capital loss is buying a predictable business below its intrinsic value. ADMA's valuation models currently range from negative (Damodaran) to $4 (FCF) to $35 (Buffett model). This massive dispersion is the mathematical fingerprint of a "business in transition."
While the 19.6% revenue growth and 57.4% gross margins confirm strong demand and current pricing power, the -25.7% drop in net income and -75% drop in FCF break the rule of financial predictability. In capital-intensive manufacturing, early profitability often temporarily inflates ROIC before the balance sheet fully catches up. We must separate accounting profitability from owner earnings. Furthermore, the unexplained 22.8M share breakdown-even without a negative PR catalyst-suggests institutional money is aggressively de-risking amidst this cash-flow uncertainty.
REFINE THE INVESTOR'S PLAN Let me step back and look at this the way Buffett would: ignore the chart drama, focus on the business, and ask whether this is a durable compounding machine that can reliably produce cash for the next decade.
The original plan was to wait for multi-year proof of durability. After evaluating the analyst debate, this approach is slightly too rigid and risks missing a classic "turnaround-to-compounder" transition in a structurally advantaged oligopoly. However, backing up the truck is equally foolish while cash flows are bleeding.
The Adjusted Plan: 1. Tracking Allocation: Permit a micro-allocation (e.g., 0.10% to 0.50% of the portfolio) to establish a foothold and force active monitoring, mirroring smart-money "guru" behavior. 2. Monitor FCF Conversion: The primary trigger for upgrading this stock to an Advocate stance is the stabilization of operating cash flow. Reinvestment is fine, but it must eventually yield cash, not just accounting earnings. 3. Watch Margin Defensibility: Track the mid-50% gross margins. If they compress, it means the incumbents (Takeda, Grifols) are using their massive scale to squeeze smaller players, breaking the ADMA thesis. 4. Ignore the Retail Noise: Social sentiment is crowded. Expect high volatility and do not add to the position on momentum spikes; only add on fundamental cash-flow confirmation.
LEARN FROM PAST MISTAKES * Mistake: Demanding absolute, multi-year certainty before buying. Correction: Recognizing that uncertainty is where mispricing originates. By the time a specialty pharma company has a 10-year perfect track record, it trades at 30x earnings, not 16x. * Mistake: Blindly trusting high ROIC in capital-heavy turnarounds. Correction: We now cross-reference ROIC with Free Cash Flow. High ROIC with plunging FCF often signals a temporary accounting quirk or unsustainable capital requirements, keeping us protected from value traps.
FINAL STANCE: WATCH (with clearance for a micro-tracking position)
Final Stance Scorecard#
This scorecard converts the final research view into a weighted decision frame. It does not replace the narrative judgement, but it makes the main drivers of the verdict easier to scan.
| Criterion | Score | Weight | Commentary |
|---|---|---|---|
| Business Quality | 4.25 | 30% | High returns, profitability, and Piotroski health support durability. |
| Valuation Support | 2.33 | 30% | Blends current price against available intrinsic value anchors and valuation ratios. |
| Financial Strength | 5.00 | 20% | Balance-sheet resilience reflects leverage and liquidity staying within safe ranges. |
| Growth Durability | 2.00 | 20% | Recent revenue, earnings, and free cash flow growth indicate how durable expansion looks. |
| TOTAL / FINAL STANCE | 3.37 | 100% | WATCH |
Key Takeaways#
The weighted score lands at 3.37 / 5.0, while the final stance remains WATCH. This is useful as a quick calibration aid rather than a mechanical signal.
Risk Summary#
Higher scores indicate more risk pressure. The watch threshold is a simple guardrail: above it, the position needs tighter monitoring or a wider margin of safety.
| Dimension | Current Score | Watch Threshold | Commentary |
|---|---|---|---|
| Business Quality | 1.75 | 3.00 | High returns, profitability, and Piotroski health support durability. |
| Valuation Support | 3.67 | 3.00 | Blends current price against available intrinsic value anchors and valuation ratios. |
| Financial Strength | 1.00 | 3.00 | Balance-sheet resilience reflects leverage and liquidity staying within safe ranges. |
| Growth Durability | 4.00 | 3.00 | Recent revenue, earnings, and free cash flow growth indicate how durable expansion looks. |
Key Takeaways#
This view helps readers separate where the risk sits: valuation, business quality, balance sheet, or growth durability. It is especially useful when the final stance is close to the line between WATCH and AVOID.
Frequently asked questions
Is ADMA Biologics Inc overvalued according to DeepValues Research?
The Mar 25, 2026 report is Neutral (WATCH, score 3.37/5) on ADMA Biologics Inc (ADMA): it calls the shares neither clearly undervalued nor clearly overvalued; the intrinsic-value range is in the report's valuation section. The report's intrinsic-value models give a range rather than one number; this is educational research, not investment advice.
What is DeepValues Research's stance on ADMA?
Neutral (WATCH, score 3.37/5) as of Mar 25, 2026. DeepValues stances are ADVOCATE (bullish), WATCH (neutral) or AVOID (bearish), with a weighted 0-5 scorecard; each report is a dated snapshot.
Where is the full ADMA Biologics Inc analysis?
The full report is at https://research.deepvalues.ai/company/adma/2026-03-25-en/ (markdown twin: https://research.deepvalues.ai/company/adma/2026-03-25-en/index.md); all ADMA Biologics Inc reports are at https://research.deepvalues.ai/company/adma/. Live fundamentals and intrinsic values for ADMA are in the DeepValues app (https://deepvalues.ai) and the DeepValues API (https://app.deepvalues.ai/developers).