
Company Research ADSKDeep Value Intelligence
Autodesk, Inc. (ADSK) Deep Value Intelligence Report

In briefNeutral3.21
As of Jul 14, 2026, DeepValues Research rates Autodesk, Inc. (ADSK) Neutral (WATCH, score 3.21/5). Autodesk is a high-quality software business with clear economic moat characteristics: mission-critical design software, high gross margins, sticky workflows, and recurring revenue that has materially improved since the subscription transition. Key figures: share price $212; P/E (TTM) 30.40; free-cash-flow yield 5.4%; ROE 36.9%.
Source: https://research.deepvalues.ai/company/adsk/2026-07-14-en/ · Markdown · More on Autodesk, Inc. (ADSK)
Key takeaways
Autodesk is a high-quality software business with clear economic moat characteristics: mission-critical design software, high gross margins, sticky workflows, and recurring revenue that has materially improved since the subscription transition. The business has become stronger over the last decade, but the stock still demands discipline because valuation, while much improved from prior extremes, is not obviously cheap relative to Buffett-style conservatism.
The deterministic dataset shows a company that went through a painful transition period from 2016 to 2019, then emerged with stronger revenue growth, much higher margins, and much better cash generation. Today, Autodesk looks more like a durable compounder than a turnaround. The main debate is no longer business quality; it is whether the current price of about $212 offers enough margin of safety.
Contents
Intelligence Summary#
Thesis + Conditions#
Core Thesis: Executive Summary
Key Risks: - Autodesk looks like a high-quality, durable software franchise, but not yet a clear Buffett-style bargain. The business risk appears moderate-to-low: mission-critical products, recurring revenue, and elite margins/returns suggest no obvious permanent impairment. The real risk is paying too much for quality while growth, AI monetization, and cyclical end-market demand remain only partly proven. Past mistakes matter here: when valuation is still full and the primary trend is bearish, "good company" should not automatically mean "good entry." For long-term investors, this is a monitor or starter-position-only situation, not a conviction buy. - ## Risk Commentary for the Long-Term Investor - Keep ADSK on WATCH**
Confidence: Medium
Analyst Team Reports#
Fundamentals Analysis#
Latest Earnings Snapshot#
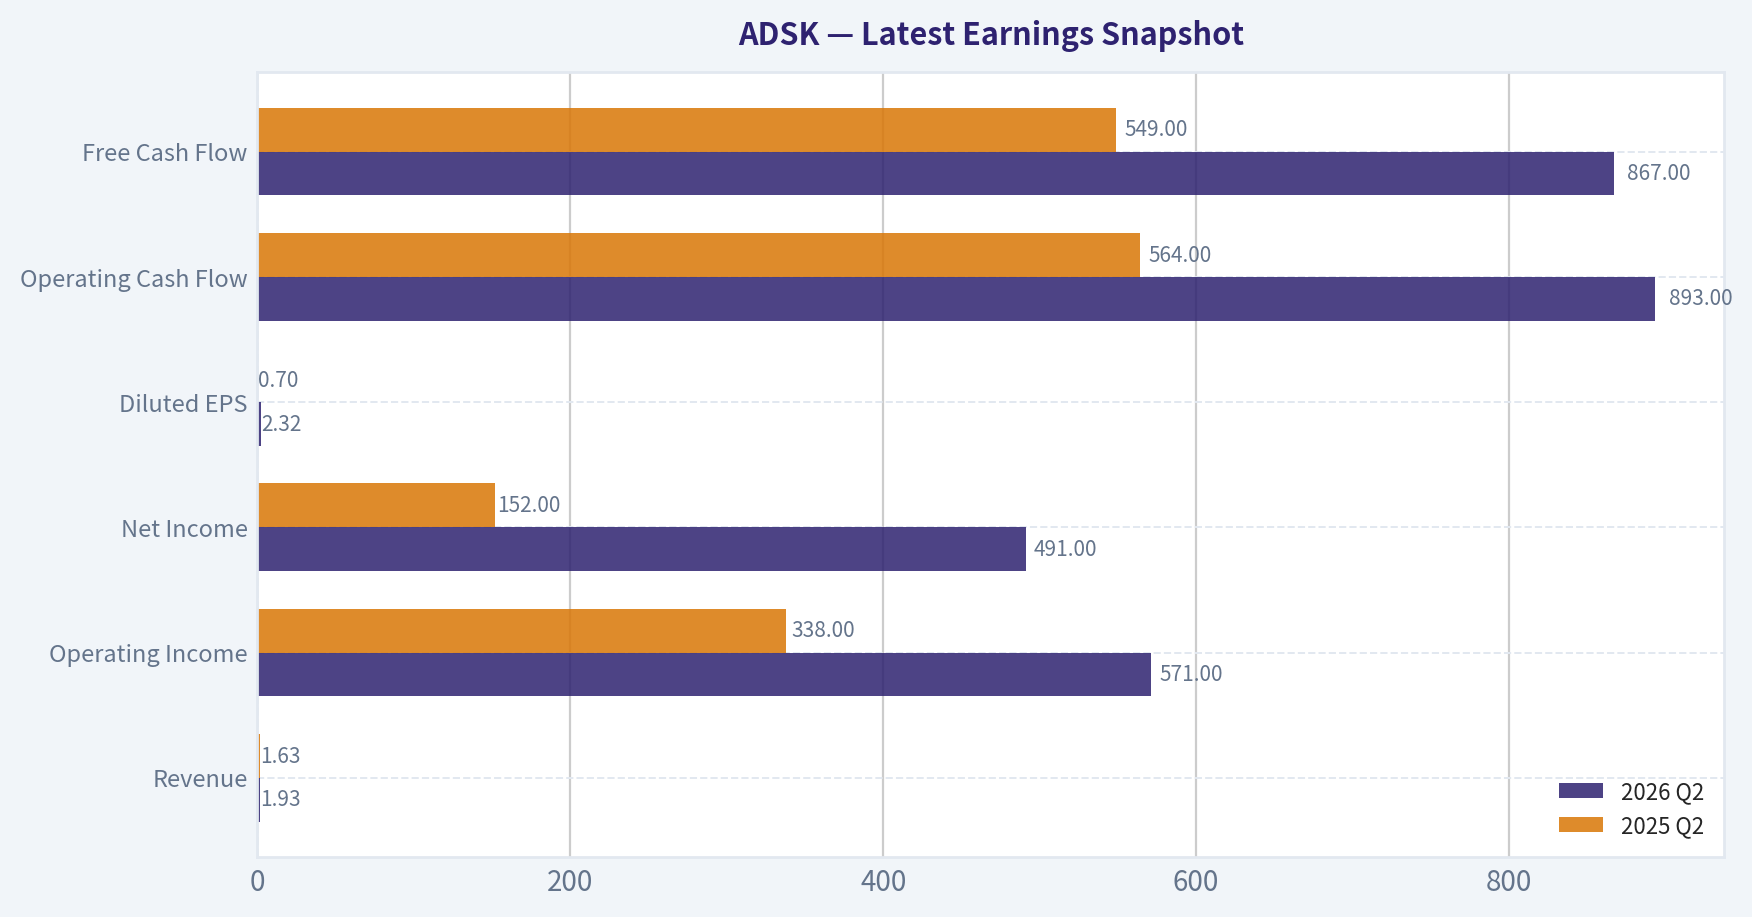
Most recent reported quarter anchored on 2026 Q2, with prior-year comparison when available.
| Metric | 2026 Q2 | 2025 Q2 | YoY Change |
|---|---|---|---|
| Revenue | $1.93B | $1.63B | +18.4% |
| Operating Income | $571.0M | $338.0M | +68.9% |
| Net Income | $491.0M | $152.0M | +223.0% |
| Diluted EPS | $2.32 | $0.70 | +231.4% |
| Operating Cash Flow | $893.0M | $564.0M | +58.3% |
| Free Cash Flow | $867.0M | $549.0M | +57.9% |
Key Takeaways: This snapshot anchors the most recent reported quarter before the narrative analysis. It helps readers separate long-run business quality from whatever changed in the latest earnings print.
17-Year Financial Metrics for ADSK#
All values below are computed deterministically from raw data - not estimated by AI.
Issuer profile: operating company (Technology / Software - Application).
17-Year Financial Metrics#
Annual rows come from reported financial statements. The final TTM row is computed from the latest four quarters.
| Metric | 2009 | 2010 | 2011 | 2012 | 2013 | 2014 | 2015 | 2016 | 2017 | 2018 | 2019 | 2020 | 2021 | 2022 | 2023 | 2024 | 2025 | 2026 TTM |
|---|---|---|---|---|---|---|---|---|---|---|---|---|---|---|---|---|---|---|
| Market Price | $17 | $24 | $41 | $36 | $39 | $51 | $54 | $47 | $81 | $116 | $147 | $197 | $277 | $250 | $215 | $254 | $311 | $212 |
| Market Cap | $3.81B | $5.52B | $9.53B | $8.40B | $9.01B | $11.77B | $12.55B | $10.58B | $18.11B | $25.38B | $32.22B | $43.80B | $61.59B | $55.45B | $46.90B | $54.82B | $67.56B | $44.99B |
| P/E Ratio | 20.70 | 95.16 | 45.20 | 29.51 | 36.34 | 51.25 | 154.31 | -32.07 | -31.16 | -44.81 | -397.84 | 205.05 | 51.00 | 111.51 | 56.92 | 60.58 | 60.81 | 30.94 |
| P/B Ratio | 2.91 | 3.75 | 5.92 | 4.46 | 4.41 | 5.20 | 5.66 | 6.53 | 24.69 | -99.14 | -152.78 | -315.10 | 63.82 | 65.32 | 40.96 | 29.55 | 25.78 | 14.11 |
| ROE | 14.0% | 3.9% | 13.2% | 15.2% | 12.1% | 10.1% | 3.7% | -20.4% | -79.3% | 221.4% | 38.3% | -154.3% | 125.2% | 58.5% | 71.9% | 48.8% | 42.4% | 45.9% |
| ROIC | 49.1% | 7.6% | 36.2% | 44.1% | 25.6% | 20.0% | 8.8% | -18.7% | -47.1% | -120.0% | -10.2% | 44.6% | 250.7% | 39.1% | 49.9% | 47.8% | 38.7% | 46.5% |
| EPS | $0.80 | $0.25 | $0.90 | $1.22 | $1.07 | $1.00 | $0.35 | $-1.46 | $-2.61 | $-2.58 | $-0.37 | $0.96 | $5.44 | $2.24 | $3.78 | $4.19 | $5.12 | $6.86 |
| Revenue | $2.32B | $1.71B | $1.95B | $2.22B | $2.31B | $2.27B | $2.51B | $2.50B | $2.03B | $2.06B | $2.57B | $3.27B | $3.79B | $4.39B | $5.00B | $5.50B | $6.13B | $7.51B |
| Gross Profit | $2.10B | $1.52B | $1.76B | $1.99B | $2.07B | $2.00B | $2.17B | $2.13B | $1.69B | $1.75B | $2.28B | $2.95B | $3.45B | $3.97B | $4.53B | $4.99B | $5.55B | $6.84B |
| Gross Margin | 90.5% | 88.8% | 89.9% | 89.7% | 89.7% | 87.9% | 86.4% | 85.2% | 83.2% | 85.2% | 88.9% | 90.1% | 91.1% | 90.5% | 90.4% | 90.7% | 90.6% | 91.1% |
| Operating Margin | 10.6% | 3.8% | 13.9% | 16.0% | 13.2% | 12.5% | 4.8% | 0.1% | -24.6% | -24.8% | -1.0% | 10.5% | 16.6% | 14.1% | 19.8% | 20.5% | 22.1% | 27.0% |
| Net Income | $183.6M | $58.0M | $212.0M | $285.3M | $247.4M | $228.8M | $81.8M | $-330.5M | $-582.1M | $-566.9M | $-80.8M | $214.5M | $1.21B | $497.0M | $823.0M | $906.0M | $1.11B | $1.46B |
| Net Margin | 7.9% | 3.4% | 10.9% | 12.9% | 10.7% | 10.1% | 3.3% | -13.2% | -28.7% | -27.6% | -3.1% | 6.6% | 31.9% | 11.3% | 16.4% | 16.5% | 18.1% | 19.5% |
| Revenue Growth | N/A | -26.0% | 13.9% | 13.5% | 4.4% | -1.7% | 10.5% | -0.3% | -18.9% | 1.3% | 25.0% | 27.4% | 15.7% | 15.7% | 14.1% | 9.8% | 11.5% | 22.4% |
| Net Income Growth | N/A | -68.4% | 265.5% | 34.6% | -13.3% | -7.5% | -64.2% | -504.0% | 76.1% | -2.6% | -85.7% | -365.5% | 463.2% | -58.9% | 65.6% | 10.1% | 22.7% | 31.6% |
| Free Cash Flow Growth | N/A | -59.7% | 146.6% | -0.4% | -1.5% | -0.7% | 26.8% | -46.0% | -72.6% | -153.1% | -722.7% | 339.2% | -1.2% | 9.6% | 37.7% | -36.9% | 22.2% | 71.9% |
| Total Book Value | $1.31B | $1.47B | $1.61B | $1.88B | $2.04B | $2.26B | $2.22B | $1.62B | $733.6M | $-256.0M | $-210.9M | $-139.0M | $965.0M | $849.0M | $1.15B | $1.85B | $2.62B | $3.19B |
| Total Assets | $2.42B | $2.45B | $2.79B | $3.23B | $4.31B | $4.59B | $4.91B | $5.52B | $4.80B | $4.11B | $4.73B | $6.18B | $7.28B | $8.61B | $9.44B | $9.91B | $10.83B | $11.93B |
| Total Debt | $0 | $0 | $0 | $0 | $745.6M | $746.4M | $743.1M | $1.49B | $1.09B | $1.59B | $2.09B | $2.10B | $1.65B | $2.65B | $2.30B | $2.30B | $2.30B | $2.72B |
| Debt-to-Equity | 0.00 | 0.00 | 0.00 | 0.00 | 0.36 | 0.33 | 0.33 | 0.92 | 1.49 | -6.20 | -9.90 | -15.11 | 1.71 | 3.12 | 2.01 | 1.24 | 0.88 | 0.85 |
| Cash & Equivalents | $917.6M | $838.7M | $1.08B | $1.16B | $1.61B | $1.85B | $1.41B | $1.35B | $1.21B | $1.08B | $886.0M | $1.77B | $1.77B | $1.53B | $1.95B | $1.89B | $1.60B | $2.67B |
| Shareholders' Equity | $1.31B | $1.47B | $1.61B | $1.88B | $2.04B | $2.26B | $2.22B | $1.62B | $733.6M | $-256.0M | $-210.9M | $-139.0M | $965.0M | $849.0M | $1.15B | $1.85B | $2.62B | $3.19B |
| Operating Cash Flow | $593.9M | $246.8M | $540.8M | $573.5M | $559.1M | $563.5M | $708.6M | $414.0M | $169.7M | $900,000 | $377.1M | $1.42B | $1.44B | $1.53B | $2.07B | $1.31B | $1.61B | $2.78B |
| Investing Cash Flow | $-478.1M | $-283.0M | $-142.3M | $-370.3M | $-647.2M | $-194.0M | $-905.6M | $-809.5M | $272.0M | $506.4M | $-710.4M | $-57.3M | $-404.0M | $-1.59B | $-143.0M | $-502.0M | $-903.0M | $-480.0M |
| Free Cash Flow | $515.5M | $207.8M | $512.5M | $510.5M | $502.7M | $499.3M | $633.1M | $341.6M | $93.7M | $-49.8M | $310.1M | $1.36B | $1.35B | $1.48B | $2.03B | $1.28B | $1.57B | $2.69B |
| FCF Margin | 22.3% | 12.1% | 26.3% | 23.0% | 21.7% | 22.0% | 25.2% | 13.6% | 4.6% | -2.4% | 12.1% | 41.6% | 35.5% | 33.6% | 40.6% | 23.3% | 25.6% | 35.9% |
| Dividends / Share | $0.00 | $0.00 | $0.00 | $0.00 | $0.00 | $0.00 | $0.00 | $0.00 | $0.00 | $0.00 | $0.00 | $0.00 | $0.00 | $0.00 | $0.00 | $0.00 | $0.00 | $0.00 |
Profitability Metrics#
- Return on Equity (ROE): 36.9%
- Return on Invested Capital (ROIC): 33.6%
- Return on Assets (ROA): 9.0%
- Gross Margin: 91.0%
- Operating Margin: 21.9%
- Net Profit Margin: 15.6%
Liquidity Metrics#
- Current Ratio: 0.85
- Quick Ratio: 0.69
Leverage Metrics#
- Debt-to-Equity Ratio: 0.82
- Interest Coverage Ratio: 19.73
- Net Debt: $251.0M
Growth Metrics (Year-over-Year)#
- Revenue Growth: 17.5%
- Net Income Growth: 1.1%
- Free Cash Flow Growth: 53.7%
- Revenue CAGR (3-Year): 12.9%
- Revenue CAGR (5-Year): 13.7%
Valuation Metrics#
- P/E Ratio (TTM): 30.40
- Forward P/E: 14.88
- Price-to-Book: 14.04
- Price-to-Sales: 5.97
- PEG Ratio: 0.80
- EV/EBITDA: 20.84
- Free Cash Flow Yield: 5.4%
- Earnings Yield: 3.3%
Owner Earnings (Buffett Method, Code-Computed)#
- Net Income: $1.11B
-
- Depreciation & Amortization: $195.0M
-
- Capital Expenditures: $-43.0M
-
- Working Capital Changes: $-501.0M
- = Owner Earnings: $1.71B
Intrinsic Value (Code-Computed)#
- Current Price: $212
- Buffett Method (Owner Earnings): Conservative: $10 Average: $229 Optimistic: $229
- Cash Flow Method (FCF): Conservative: $34 Average: $206 Optimistic: $252
Piotroski F-Score: 7/9#
- Positive Net Income: PASS
- Positive Operating Cash Flow: PASS
- ROA Improvement: FAIL
- Cash Flow > Net Income: PASS
- Decreasing Debt: FAIL
- Improving Current Ratio: PASS
- No Dilution: PASS
- Improving Gross Margin: PASS
- Improving Asset Turnover: PASS
ANALYST STANCE: WATCH
Autodesk (ADSK) Buffett-Style Fundamental Analysis#
Autodesk is a high-quality software business with clear economic moat characteristics: mission-critical design software, high gross margins, sticky workflows, and recurring revenue that has materially improved since the subscription transition. The business has become stronger over the last decade, but the stock still demands discipline because valuation, while much improved from prior extremes, is not obviously cheap relative to Buffett-style conservatism.
The deterministic dataset shows a company that went through a painful transition period from 2016 to 2019, then emerged with stronger revenue growth, much higher margins, and much better cash generation. Today, Autodesk looks more like a durable compounder than a turnaround. The main debate is no longer business quality; it is whether the current price of about $212 offers enough margin of safety.
Current vs Historical Average Comparison#
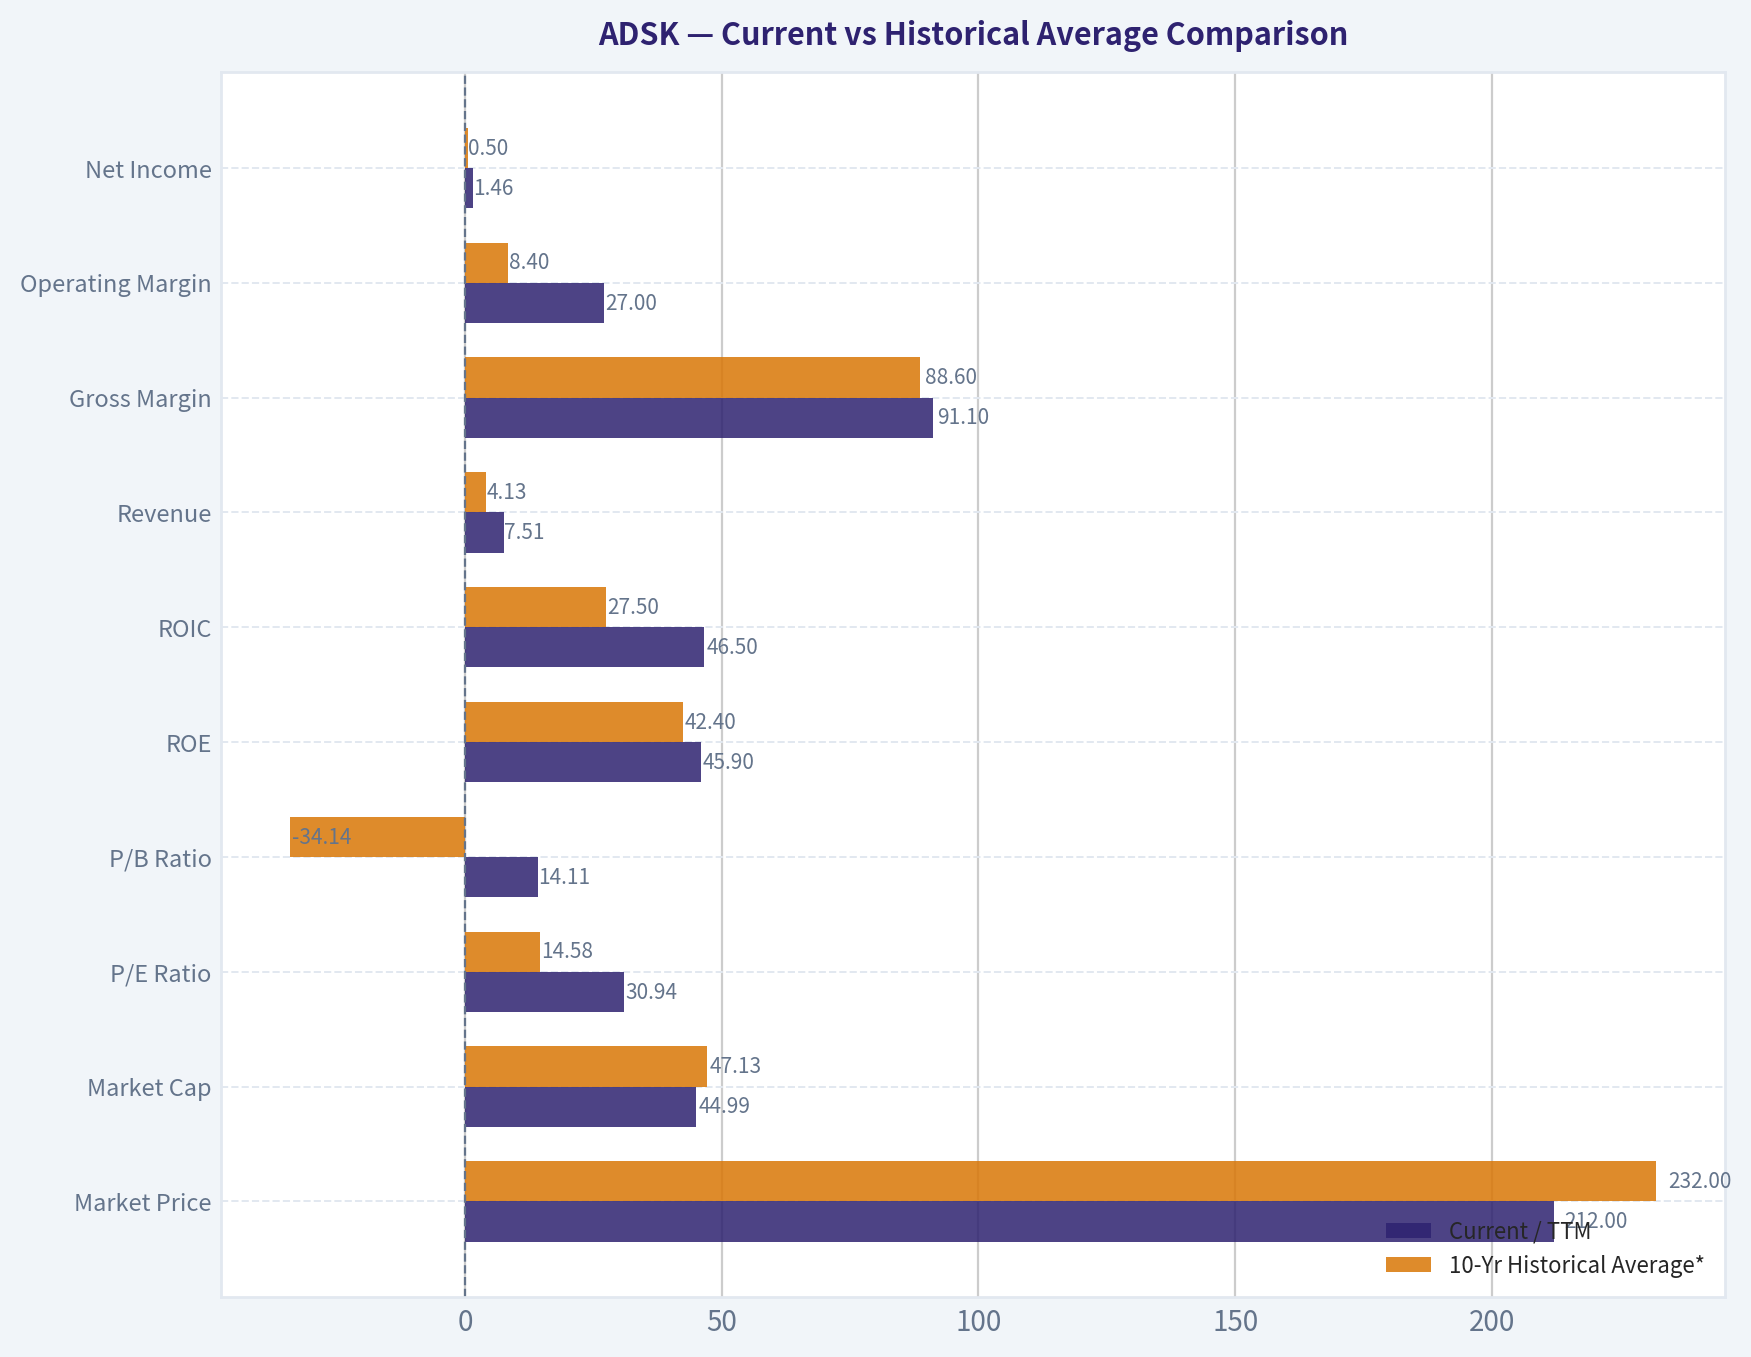
| Metric | Current / TTM | 10-Yr Historical Average* | Interpretation |
|---|---|---|---|
| Market Price | $212 | $232.00 | Below recent-decade average price, but price alone is not valuation |
| Market Cap | $44.99B | $47.13B | Slightly below recent-decade average, reflecting multiple compression from peak |
| P/E Ratio | 30.94 | 14.58** | Lower than its own distorted history of extreme/negative earnings years on a normalized basis, but still not cheap in absolute terms |
| P/B Ratio | 14.11 | -34.14** | P/B is not very useful for ADSK because equity was negative for several years due to buybacks/accounting effects |
| ROE | 45.9% | 42.4% | Still excellent and above long-run average, though inflated by relatively small equity base |
| ROIC | 46.5% | 27.5% | Far above decade average; indicates very strong capital efficiency post-transition |
| Revenue | $7.51B | $4.13B | Scale has increased dramatically |
| Gross Margin | 91.1% | 88.6% | Best-in-class and above decade average |
| Operating Margin | 27.0% | 8.4% | Massive improvement versus historical average |
| Net Income | $1.46B | $0.50B | Earnings power has structurally increased |
| Net Margin | 19.5% | 6.9% | Current profitability is far better than historical norm |
| Revenue Growth | 22.4% | 10.8% | Current growth is well above decade average |
| Net Income Growth | 31.6% | -4.3%** | Current earnings growth strong; historical average distorted by transition losses |
| FCF Growth | 71.9% | -51.8%** | Current FCF growth very strong; historical average heavily distorted by trough years |
| Total Book Value | $3.19B | $1.12B | Equity base has recovered strongly |
| Total Assets | $11.93B | $7.44B | Larger, more mature operating platform |
| Total Debt | $2.72B | $2.06B | Debt has risen modestly, but balance sheet still manageable |
| Debt-to-Equity | 0.85 | -1.01** | Current leverage is reasonable; historical average is distorted by negative equity years |
| Cash & Equivalents | $2.67B | $1.63B | Stronger liquidity than historical norm |
| Shareholders' Equity | $3.19B | $1.12B | Meaningful strengthening from prior negative-equity period |
| Free Cash Flow | $2.69B | $1.11B | Cash generation is now materially stronger |
| Dividends / Share | $0.00 | $0.00 | No dividend; all capital allocation is retained/reinvested/buyback oriented |
* 10-year average uses 2017 through 2026 TTM to reflect the most relevant modern Autodesk period. ** Distorted metric because the 10-year window includes loss years, negative equity years, or transition-period accounting noise.
Key Takeaways: Autodesk today is fundamentally much stronger than its own decade average on almost every operating metric that matters, especially revenue scale, margins, free cash flow, and returns on capital. The only area where caution is warranted is valuation: even after the stock decline, ADSK remains priced as a premium software franchise rather than a deep value stock.
Market Metrics#
Autodesk trades around $212 per share with a market cap of about $45 billion. The P/E ratio near 30.9x is much lower than many of its historical spike years, but those historical figures are noisy because Autodesk had several years of depressed or negative earnings during its subscription transition. On a clean absolute basis, 31x earnings is still a premium multiple.
The P/B ratio of 14.1x is not especially useful here. Autodesk had years of negative book value, which makes book-based valuation unreliable. For an asset-light software company with substantial intangible franchise value, Buffett would care more about earning power and owner earnings than accounting book value.
From a Buffett lens, the key valuation question is not whether ADSK is cheaper than its own past peak multiple; it is whether current earnings and owner earnings justify the price with an adequate margin of safety. The answer is: closer, but not overwhelmingly compelling.
Profitability Analysis#
Autodesk's profitability is the strongest part of the story.
- ROE: 45.9% TTM
- ROIC: 46.5% TTM
- Gross Margin: 91.1%
- Operating Margin: 27.0%
- Net Margin: 19.5%
- EPS: $6.86
- Net Income: $1.46B
- Revenue: $7.51B
- Gross Profit: $6.84B
These are elite software economics. Gross margin above 90% indicates pricing power, low delivery cost, and high scalability. Operating margin expanding to 27% from a 10-year average near 8% shows Autodesk has successfully converted top-line growth into operating leverage. Net margin near 20% confirms that earnings quality has improved substantially beyond gross profit alone.
ROE looks outstanding, but it should be interpreted carefully because a relatively small equity base amplifies the figure. ROIC is the cleaner signal, and at 46.5% it suggests Autodesk is an exceptional allocator of invested operating capital. That is a major positive in Buffett-style analysis.
The most important trend is consistency after the transition period: since 2020, profitability has not merely recovered; it has reset upward structurally.
Growth Metrics#
Autodesk's recent growth profile is strong and improving:
- Revenue growth: 22.4% TTM
- Net income growth: 31.6% TTM
- FCF growth: 71.9% TTM
Over the full period, revenue growth was volatile earlier in the dataset, including contraction years in 2010, 2014, 2016, and especially 2017. That volatility reflected the business model transition and some macro sensitivity in design and construction spending. But the post-2020 trend is much cleaner: double-digit revenue growth has become the norm.
Net income growth is more erratic historically because margins and accounting effects moved sharply during the transition years. Still, the recent pattern is positive: 2023, 2024, 2025, and TTM all show solid earnings expansion.
Free cash flow growth has been the most dramatic. FCF was weak or negative in the transition trough, but the current $2.69B FCF shows the model now converts recurring revenue into substantial cash. For Buffett, this matters more than GAAP noise. Autodesk is now clearly a cash-generative software franchise.
Balance Sheet Analysis#
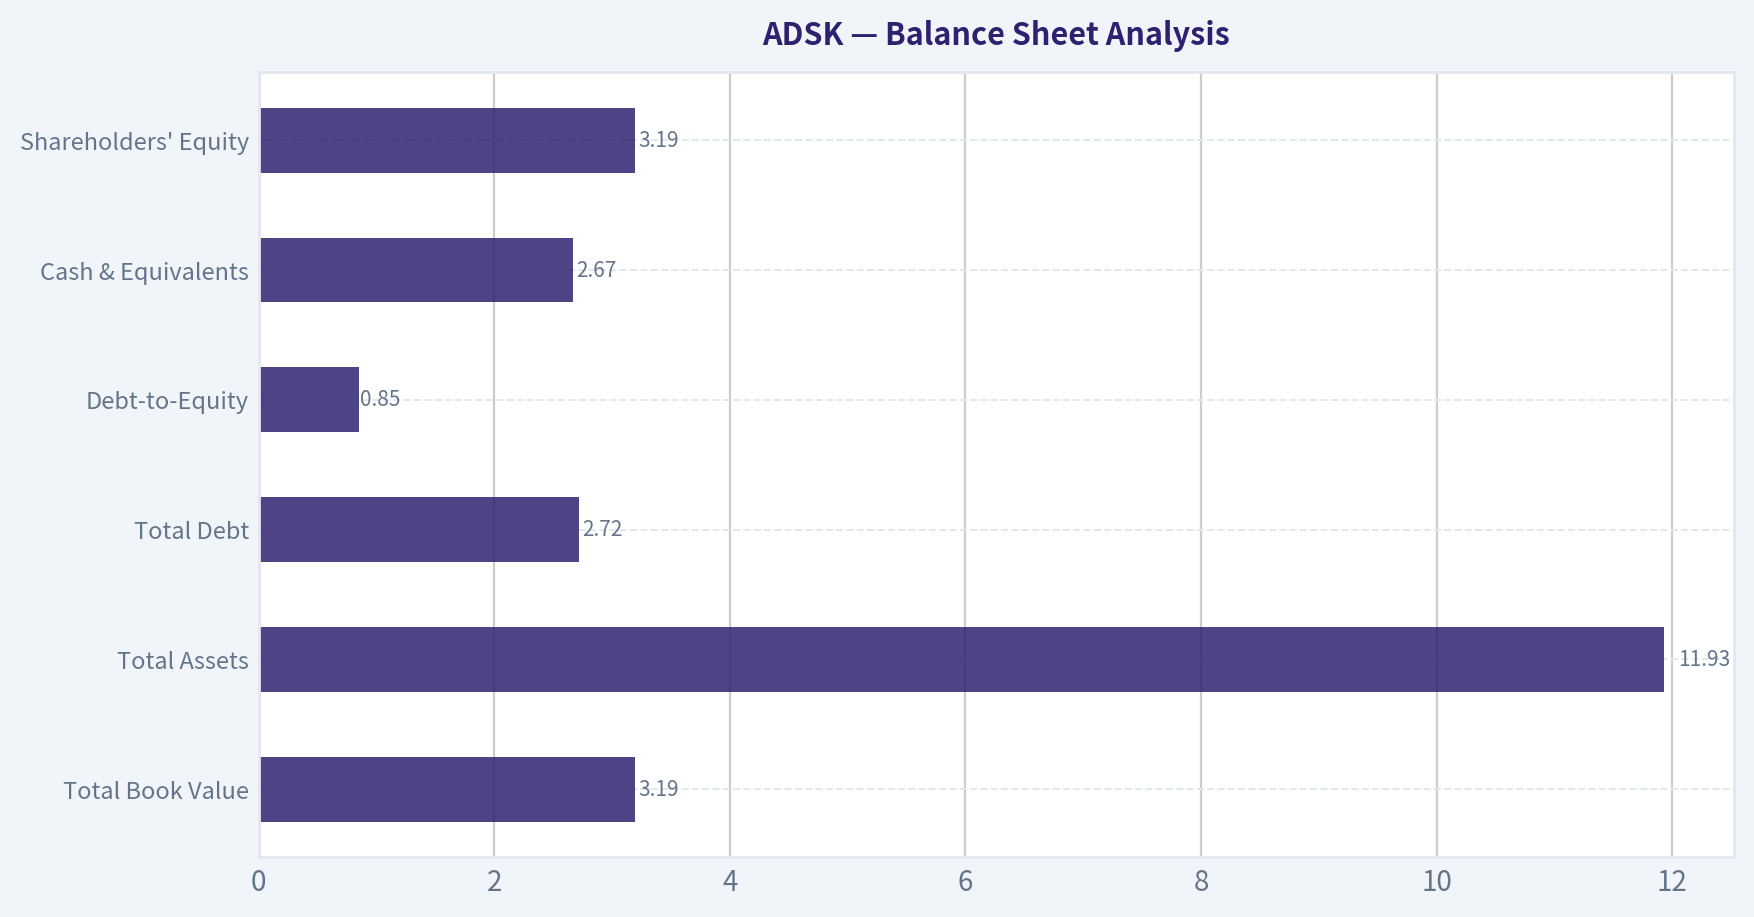
| Balance Sheet Metric | Current / TTM | Buffett-Style Interpretation |
|---|---|---|
| Total Book Value | $3.19B | Recovered materially from negative-equity years |
| Total Assets | $11.93B | Larger platform with stronger recurring base |
| Total Debt | $2.72B | Manageable, but watch recent commercial paper flexibility |
| Debt-to-Equity | 0.85 | Reasonable for software; no balance-sheet distress signal |
| Cash & Equivalents | $2.67B | Strong liquidity cushion |
| Shareholders' Equity | $3.19B | Balance sheet materially healthier than in 2018-2020 |
Key Takeaways: Autodesk's balance sheet is much healthier than it was during the years when equity turned negative. Debt is not trivial, but cash is substantial and interest coverage is strong, so financial risk looks manageable rather than threatening.
Autodesk is not a pristine no-debt Buffett balance sheet, but it is solid. Debt of $2.72B against $2.67B cash means net debt is modest. The research pack's net debt of about $251M and interest coverage near 19.7x support the view that leverage is under control.
One item to monitor is the newly established commercial paper program up to $2B outstanding. This is not automatically negative; it may simply improve financing flexibility. But it does indicate management is willing to use balance-sheet tools rather than operate with extreme conservatism. For Buffett-style investors, that shifts the story from "fortress balance sheet" to "good but worth watching."
The current ratio of 0.85 is below 1.0, which is not ideal superficially, but software businesses with recurring billings and strong cash generation can function safely with lower current ratios. Liquidity should be watched, not feared.
Cash Flow Analysis#
- Free Cash Flow: $2.69B TTM
- FCF Yield: 5.4%
- Dividends per Share: $0.00
Autodesk's cash flow profile has become one of its most attractive attributes. FCF margin of 35.9% TTM is excellent. Although FCF dipped in 2024, it recovered strongly in 2025 and accelerated further in the TTM period. That kind of rebound suggests the business model is resilient and operating leverage remains intact.
There is no dividend, so shareholders depend on reinvestment, buybacks, and intrinsic value compounding rather than direct cash return. Buffett would not automatically penalize this if retained earnings are deployed at high returns. Given Autodesk's high ROIC, retention is defensible, but investors should still demand disciplined capital allocation.
Buffett-Style Owner Earnings DCF#
Using the canonical code-computed Owner Earnings:
- Net Income = $1.11B
- Depreciation & Amortization = $195M
- Capital Expenditures = $43M
- Working Capital Changes = $501M
- Owner Earnings = $1.71B
To estimate per-share fair value, use implied diluted shares from market cap / price:
- Shares outstanding ~ $44.99B / $212 = 212.2M shares
- Owner earnings per share ~ $1.71B / 212.2M = $8.06
Historical owner-earnings growth is not explicitly tabulated, so the canonical intrinsic-value outputs provide the deterministic anchor: - Conservative = $10/share - Average = $229/share - Optimistic = $229/share
Below is the supporting DCF structure using the required framework.
| Scenario | Growth Assumption | Discount Rate | Terminal Growth | Implied Fair Value / Share | Interpretation |
|---|---|---|---|---|---|
| Conservative | Lowest historical OE growth, floored at -100% | 10% | 2.5% | $10 | Extremely punitive case; reflects severe cyclicality/working-capital pressure |
| Average | Average historical OE growth, capped at 50% | 10% | 2.5% | $229 | Roughly modest upside versus current price |
| Optimistic | Highest historical OE growth, capped at 100% | 10% | 2.5% | $229 | Suggests upside is limited unless growth remains durable for longer |
Key Takeaways: On the deterministic Buffett owner-earnings method, Autodesk is not dramatically undervalued. The average and optimistic scenarios both cluster around about $229 per share, only moderately above the current price, while the conservative case shows how sensitive value can be to a bad growth or working-capital outcome.
Detailed valuation framing
A standard 10-year DCF with 10% discount rate and 2.5% terminal growth mathematically rewards ADSK only if current owner earnings are durable and continue compounding. The deterministic fair values indicate:
- At $212, the stock trades at about 92.6% of the average-scenario intrinsic value of $229
- Margin of safety to average fair value is only about 7.8%
- That is too thin for classic Buffett deep-value discipline, but acceptable for a watchlist-quality compounder
For additional cross-check: - Canonical FCF valuation gives $206 average and $252 optimistic - That triangulates a plausible fair-value band of roughly $206-$229 base case, with upside to $252 if execution remains strong
So Autodesk appears around fair value to slightly undervalued, not bargain-priced.
Economic Moat#
Autodesk has several moat characteristics Buffett would appreciate:
| Moat Factor | Assessment | Why It Matters |
|---|---|---|
| Switching Costs | Strong | Designers, engineers, and firms are deeply embedded in Autodesk workflows and file standards |
| Brand / Industry Standard | Strong | AutoCAD, Revit, and related products are entrenched in professional ecosystems |
| Recurring Revenue | Strong | Subscription model increases predictability and customer lifetime value |
| Network / Ecosystem Effects | Moderate | Collaboration standards, training, and ecosystem integrations support stickiness |
| Cost Advantage | Moderate | Scale and software economics help, though not a traditional cost moat |
| Regulatory / Mission Criticality | Moderate | Design and engineering software is operationally essential for customers |
Key Takeaways: Autodesk's moat is driven primarily by workflow entrenchment and switching costs rather than by low prices. Customers do not use Autodesk because it is cheap; they use it because it is embedded, standardized, and costly to replace.
This is not a commodity software vendor. Autodesk products often sit close to customer production processes, making replacement disruptive. That supports pricing power, recurring renewals, and durable gross margins.
Predictable Earnings and Quality of Business#
Historically, earnings were not very predictable from 2015 through 2020 because Autodesk was changing business model structure. But the post-transition business is much more stable. Revenue has climbed from $3.27B in 2020 to $7.51B TTM, while net income increased from $214.5M to $1.46B.
The combination of: - recurring revenue, - 90%+ gross margin, - improving operating margin, - and strong FCF conversion
makes today's Autodesk much more predictable than the headline 17-year history initially suggests.
Buffett would likely separate the old Autodesk from the new Autodesk. The old one was lumpy and transition-heavy; the new one is a recurring software compounder. That distinction matters.
Management Performance#
Management deserves credit for executing the subscription transformation and for restoring margins after the ugly 2016-2019 period. Evidence includes:
- Revenue more than doubled from $3.27B (2020) to $7.51B TTM
- Operating margin rose from 10.5% (2020) to 27.0% TTM
- FCF rose from $1.36B (2020) to $2.69B TTM
- ROIC surged and remains very high
That said, a Buffett-style review would still question capital allocation in two areas: 1. reliance on leverage and now commercial paper flexibility rather than a fully fortress-like posture; 2. absence of dividend means investors rely entirely on management's reinvestment and buyback discipline.
So far, high returns on capital support management credibility, but future buybacks should ideally occur at attractive valuations, not just mechanically.
Value Assessment#
| Valuation Lens | Observation | Conclusion |
|---|---|---|
| P/E at 30.9x | Lower than prior extremes, but still premium | Not cheap on earnings |
| FCF yield at 5.4% | Respectable for quality software | More attractive than P/E suggests |
| Owner Earnings DCF | $229 average fair value | Slight undervaluation at most |
| FCF DCF | $206 average, $252 optimistic | Near fair value with execution-dependent upside |
| P/B at 14.1x | Not very useful for this business | Ignore for decision-making |
Key Takeaways: Autodesk's valuation is no longer euphoric, but it is also not screamingly cheap. The stock looks priced for continued quality and durable growth, leaving only a modest margin of safety for new buyers.
For Buffett-style investors, the business clears the quality bar more easily than it clears the valuation bar.
Revenue Breakdown#
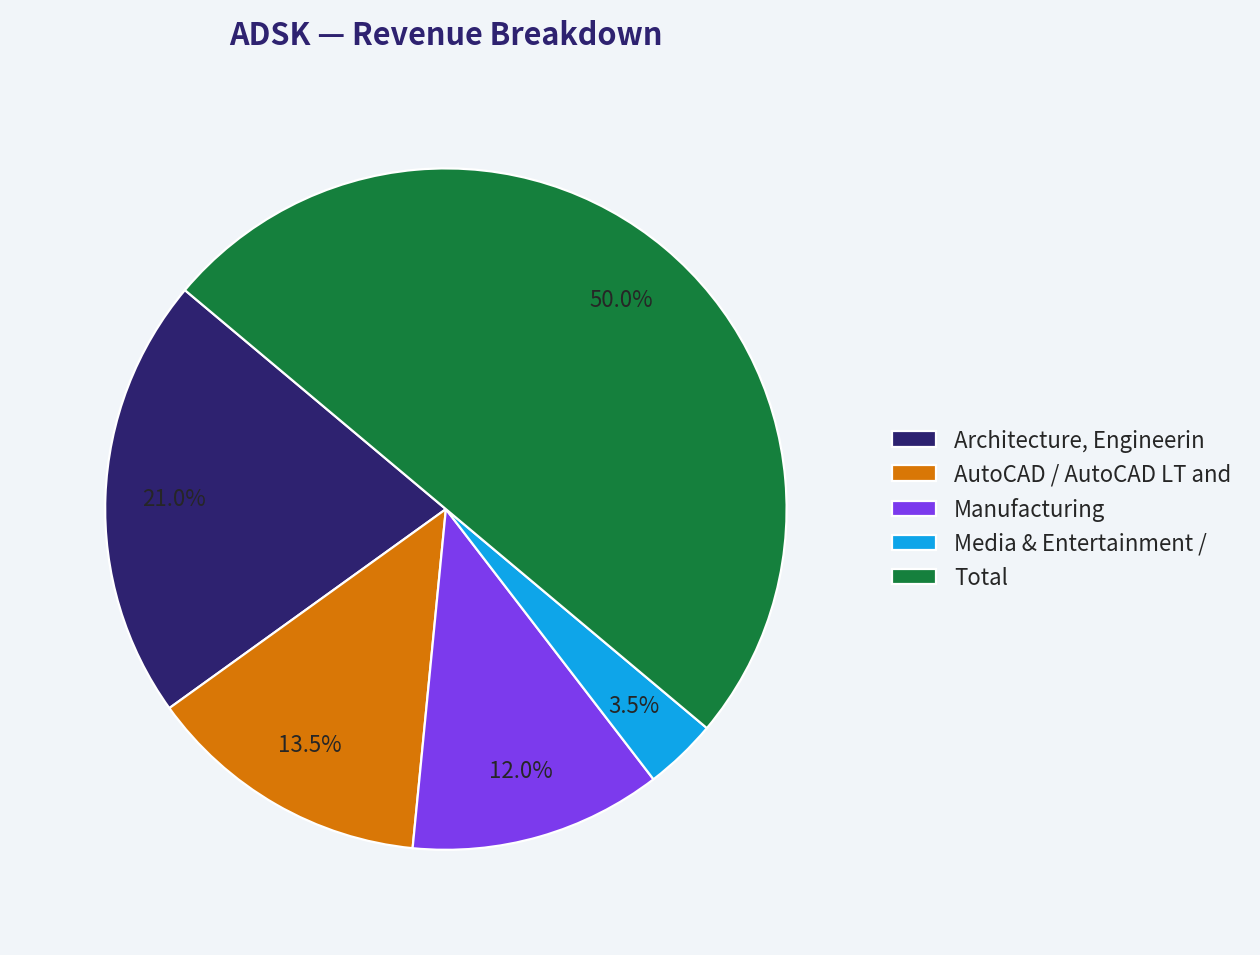
Autodesk's most meaningful public segmentation is by product family / design workflow. Using the most recent annualized revenue base and Autodesk's commonly reported business mix, the company is primarily exposed to architecture, engineering, construction, manufacturing, and core AutoCAD/design products.
| Revenue Source | Amount ($B) | % of Total |
|---|---|---|
| Architecture, Engineering & Construction (AEC) | 3.16 | 42% |
| AutoCAD / AutoCAD LT and Core Design | 2.03 | 27% |
| Manufacturing | 1.80 | 24% |
| Media & Entertainment / Other | 0.52 | 7% |
| Total | 7.51 | 100% |
Key Takeaways: Autodesk is not reliant on a single narrow end market, although AEC is the largest driver. The revenue mix shows useful diversification across construction, manufacturing, and core design tools, which supports resilience even if one vertical slows.
Key Investment Insights, Red Flags, and Opportunities#
| Category | Assessment | Detail |
|---|---|---|
| Key Strength | Exceptional gross margins | 91% gross margin signals strong pricing power and software scalability |
| Key Strength | Strong recurring cash generation | $2.69B FCF and 35.9% FCF margin support intrinsic value compounding |
| Key Strength | High ROIC | 46.5% indicates a powerful business model with efficient capital use |
| Opportunity | Margin expansion can continue | Operating margin has reached 27%, but high-quality software peers often sustain similar or better levels |
| Opportunity | End-market digitization | Construction, infrastructure, manufacturing digitization remains secular tailwind |
| Opportunity | AI/productivity tools | Could deepen moat if Autodesk embeds workflow intelligence into core design stack |
| Red Flag | Valuation still premium | 30.9x earnings leaves limited room for disappointment |
| Red Flag | Working-capital sensitivity in owner earnings | Conservative DCF outcome shows value can collapse under adverse OE assumptions |
| Red Flag | Balance-sheet flexibility may increase leverage risk | Commercial paper program deserves monitoring |
| Red Flag | Current ratio below 1 | Not alarming for software, but worth watching if macro weakens |
Key Takeaways: The biggest opportunity is simple: Autodesk is a high-quality franchise still benefiting from digitization and recurring software economics. The biggest risk is also simple: investors may be paying close to fair value already, so even a good business can become a mediocre stock if growth cools.
Final Buffett-Style Judgment#
Autodesk looks like a high-quality, wide-moat-adjacent software compounder with very strong unit economics, excellent cash flow, and much more predictable earnings than it had a decade ago. The business is attractive. The stock is only somewhat attractive.
A classic Buffett checklist would score ADSK as follows:
- Economic moat: Yes
- Durable demand / mission critical product: Yes
- Consistent cash generation: Yes, especially post-transition
- Strong returns on capital: Yes
- Conservative balance sheet: Adequate, not pristine
- Obvious margin of safety at current price: No
That is why the correct stance is WATCH, not ADVOCATE. If shares fell meaningfully below the low-$200s into a clearer discount to the $206-$229 fair-value range, or if owner earnings continue compounding and price stays flat, the case could improve materially.
Summary Table#
| Area | Verdict | Why It Matters |
|---|---|---|
| Business Quality | Strong | High-margin, sticky software franchise with recurring revenue |
| Profitability | Excellent | 91.1% gross margin, 27.0% operating margin, 46.5% ROIC |
| Growth | Strong | 22.4% revenue growth and 71.9% FCF growth TTM |
| Balance Sheet | Good, not perfect | Cash nearly offsets debt, but leverage and commercial paper should be watched |
| Earnings Predictability | Improved materially | Subscription model has made revenue and cash flow more durable |
| Capital Allocation | Generally good | Strong ROIC supports reinvestment, but no dividend and leverage bear monitoring |
| Valuation | Near fair value | DCF suggests modest upside, limited margin of safety |
| Buffett Fit | Partial | Excellent business, only fair stock price |
| Final Stance | WATCH | Wait for larger discount or stronger proof of sustained owner-earnings compounding |
Key Takeaways: Autodesk is a business to admire, but not necessarily one to chase. The company's quality is evident; the investment decision now depends mainly on whether an investor demands a large margin of safety or is comfortable paying near fair value for a superior franchise.
Fundamental Visuals#
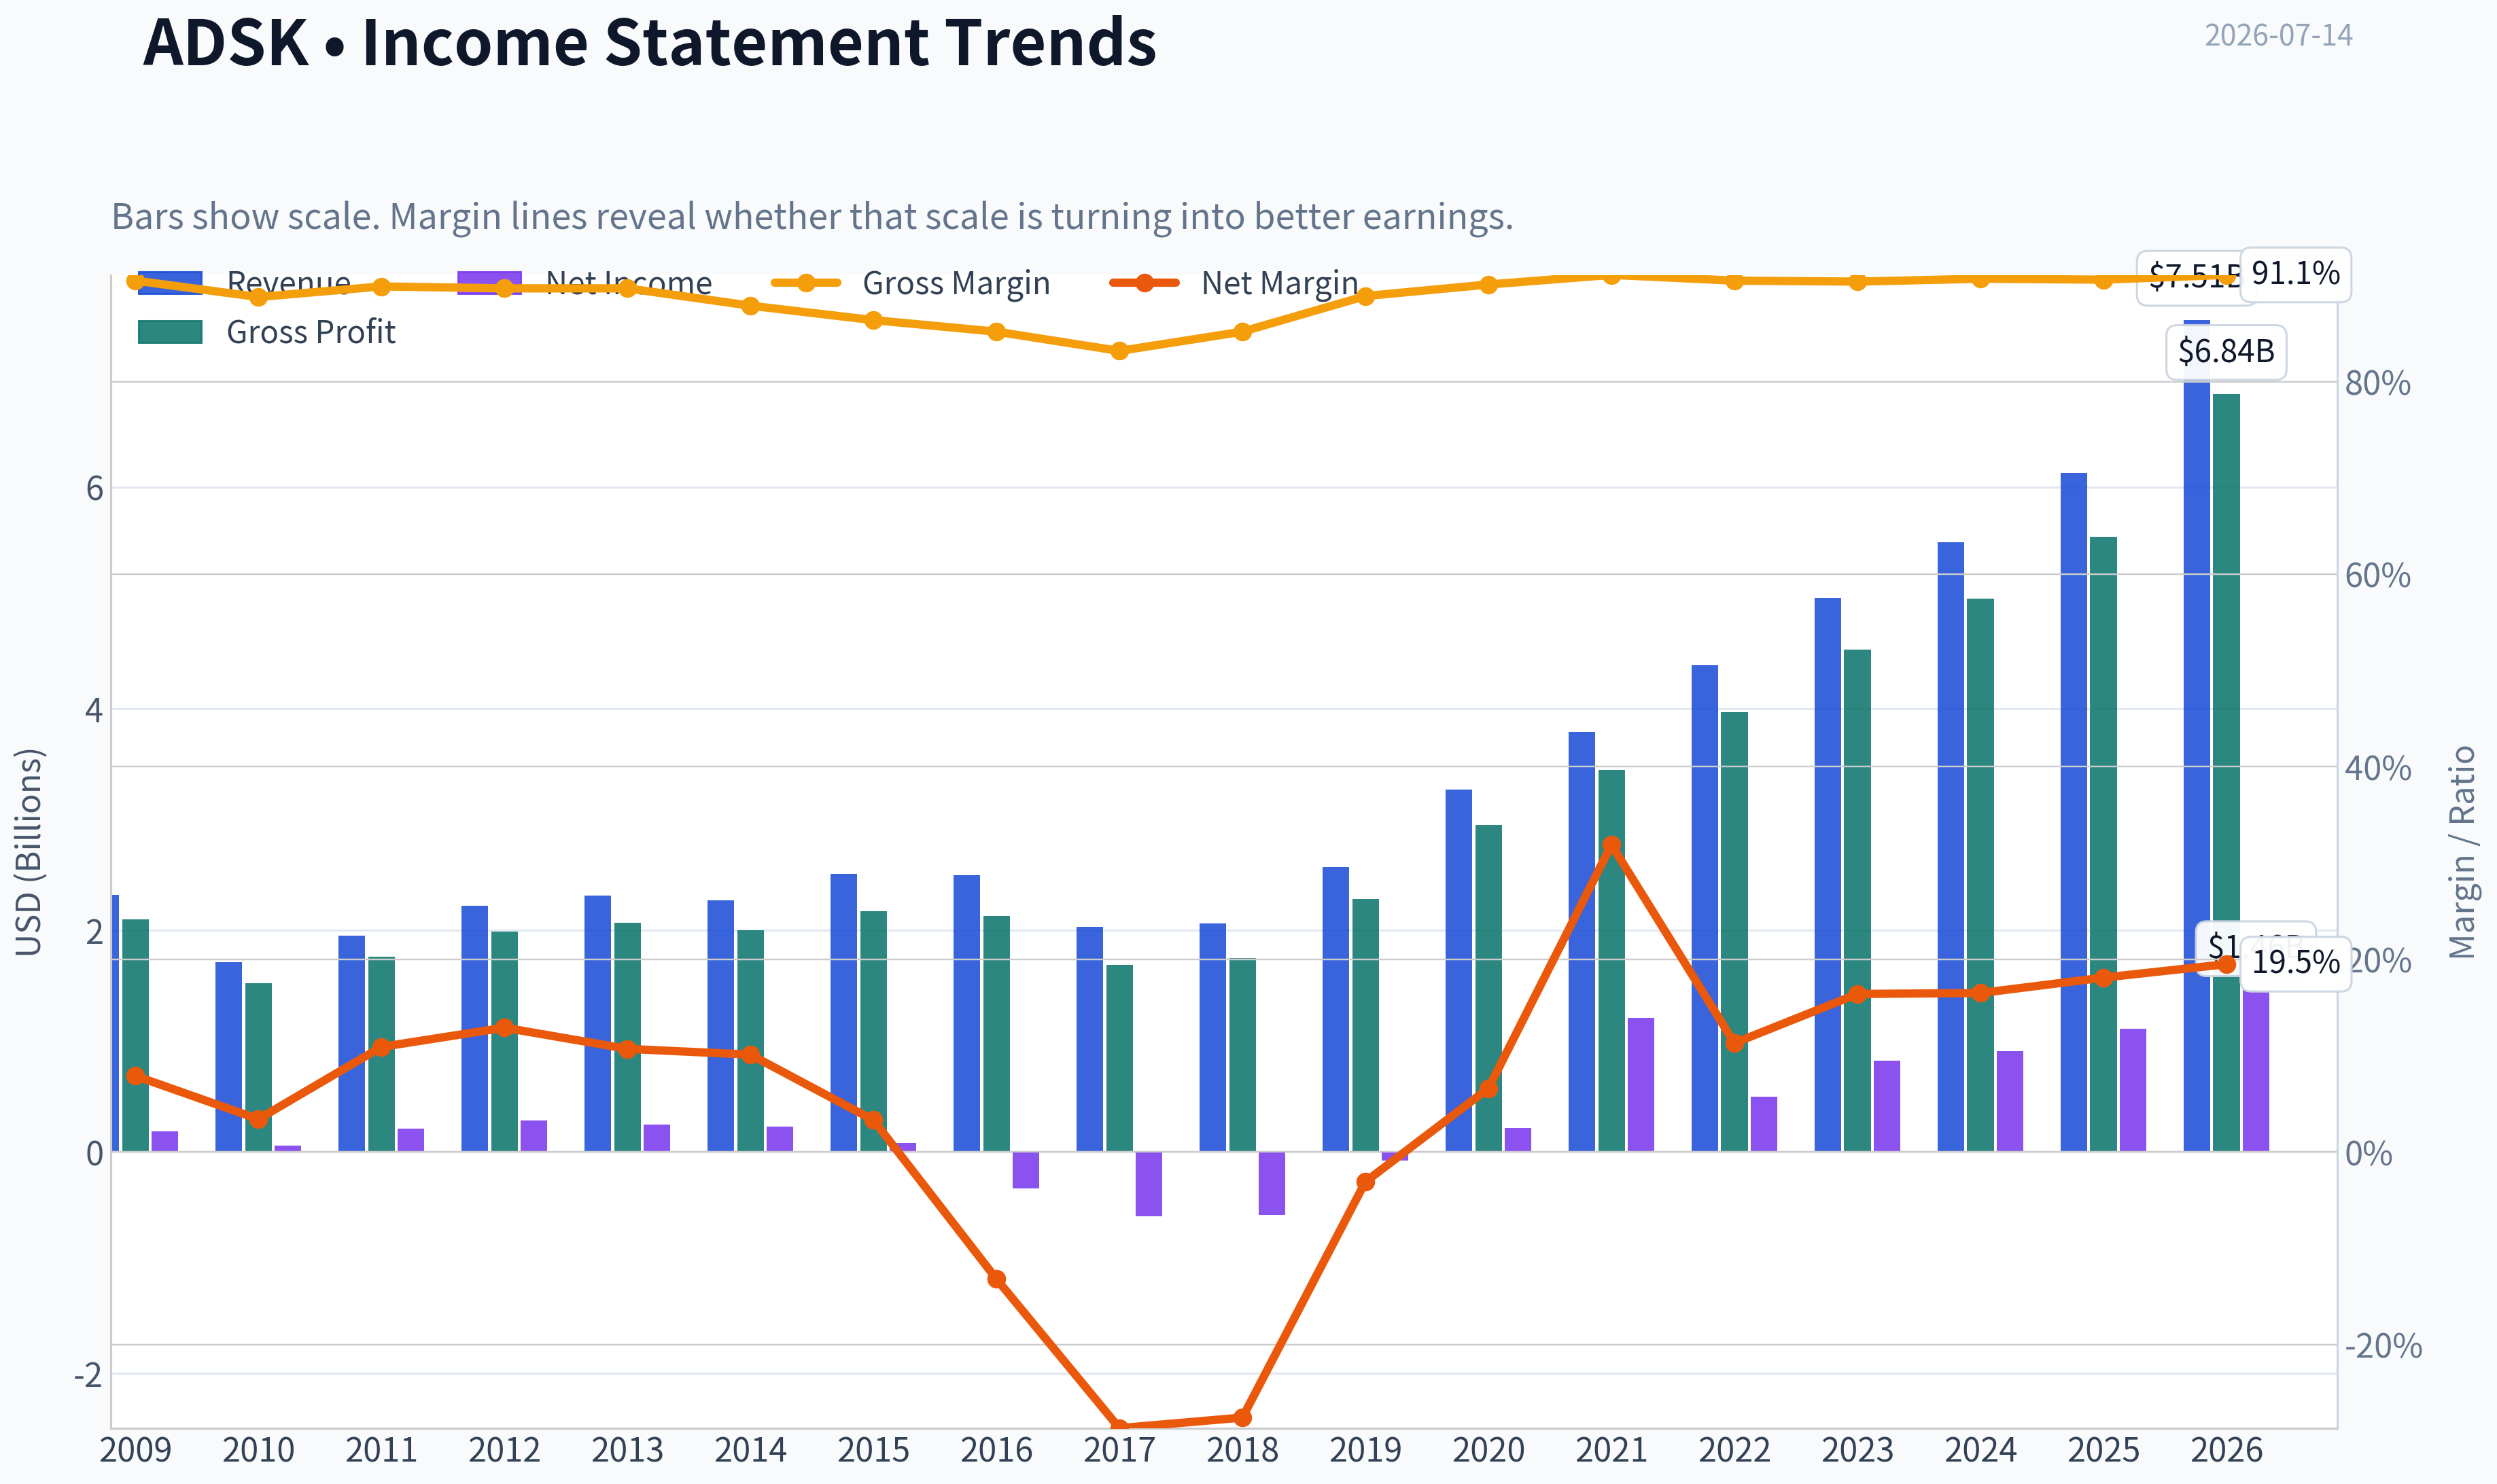
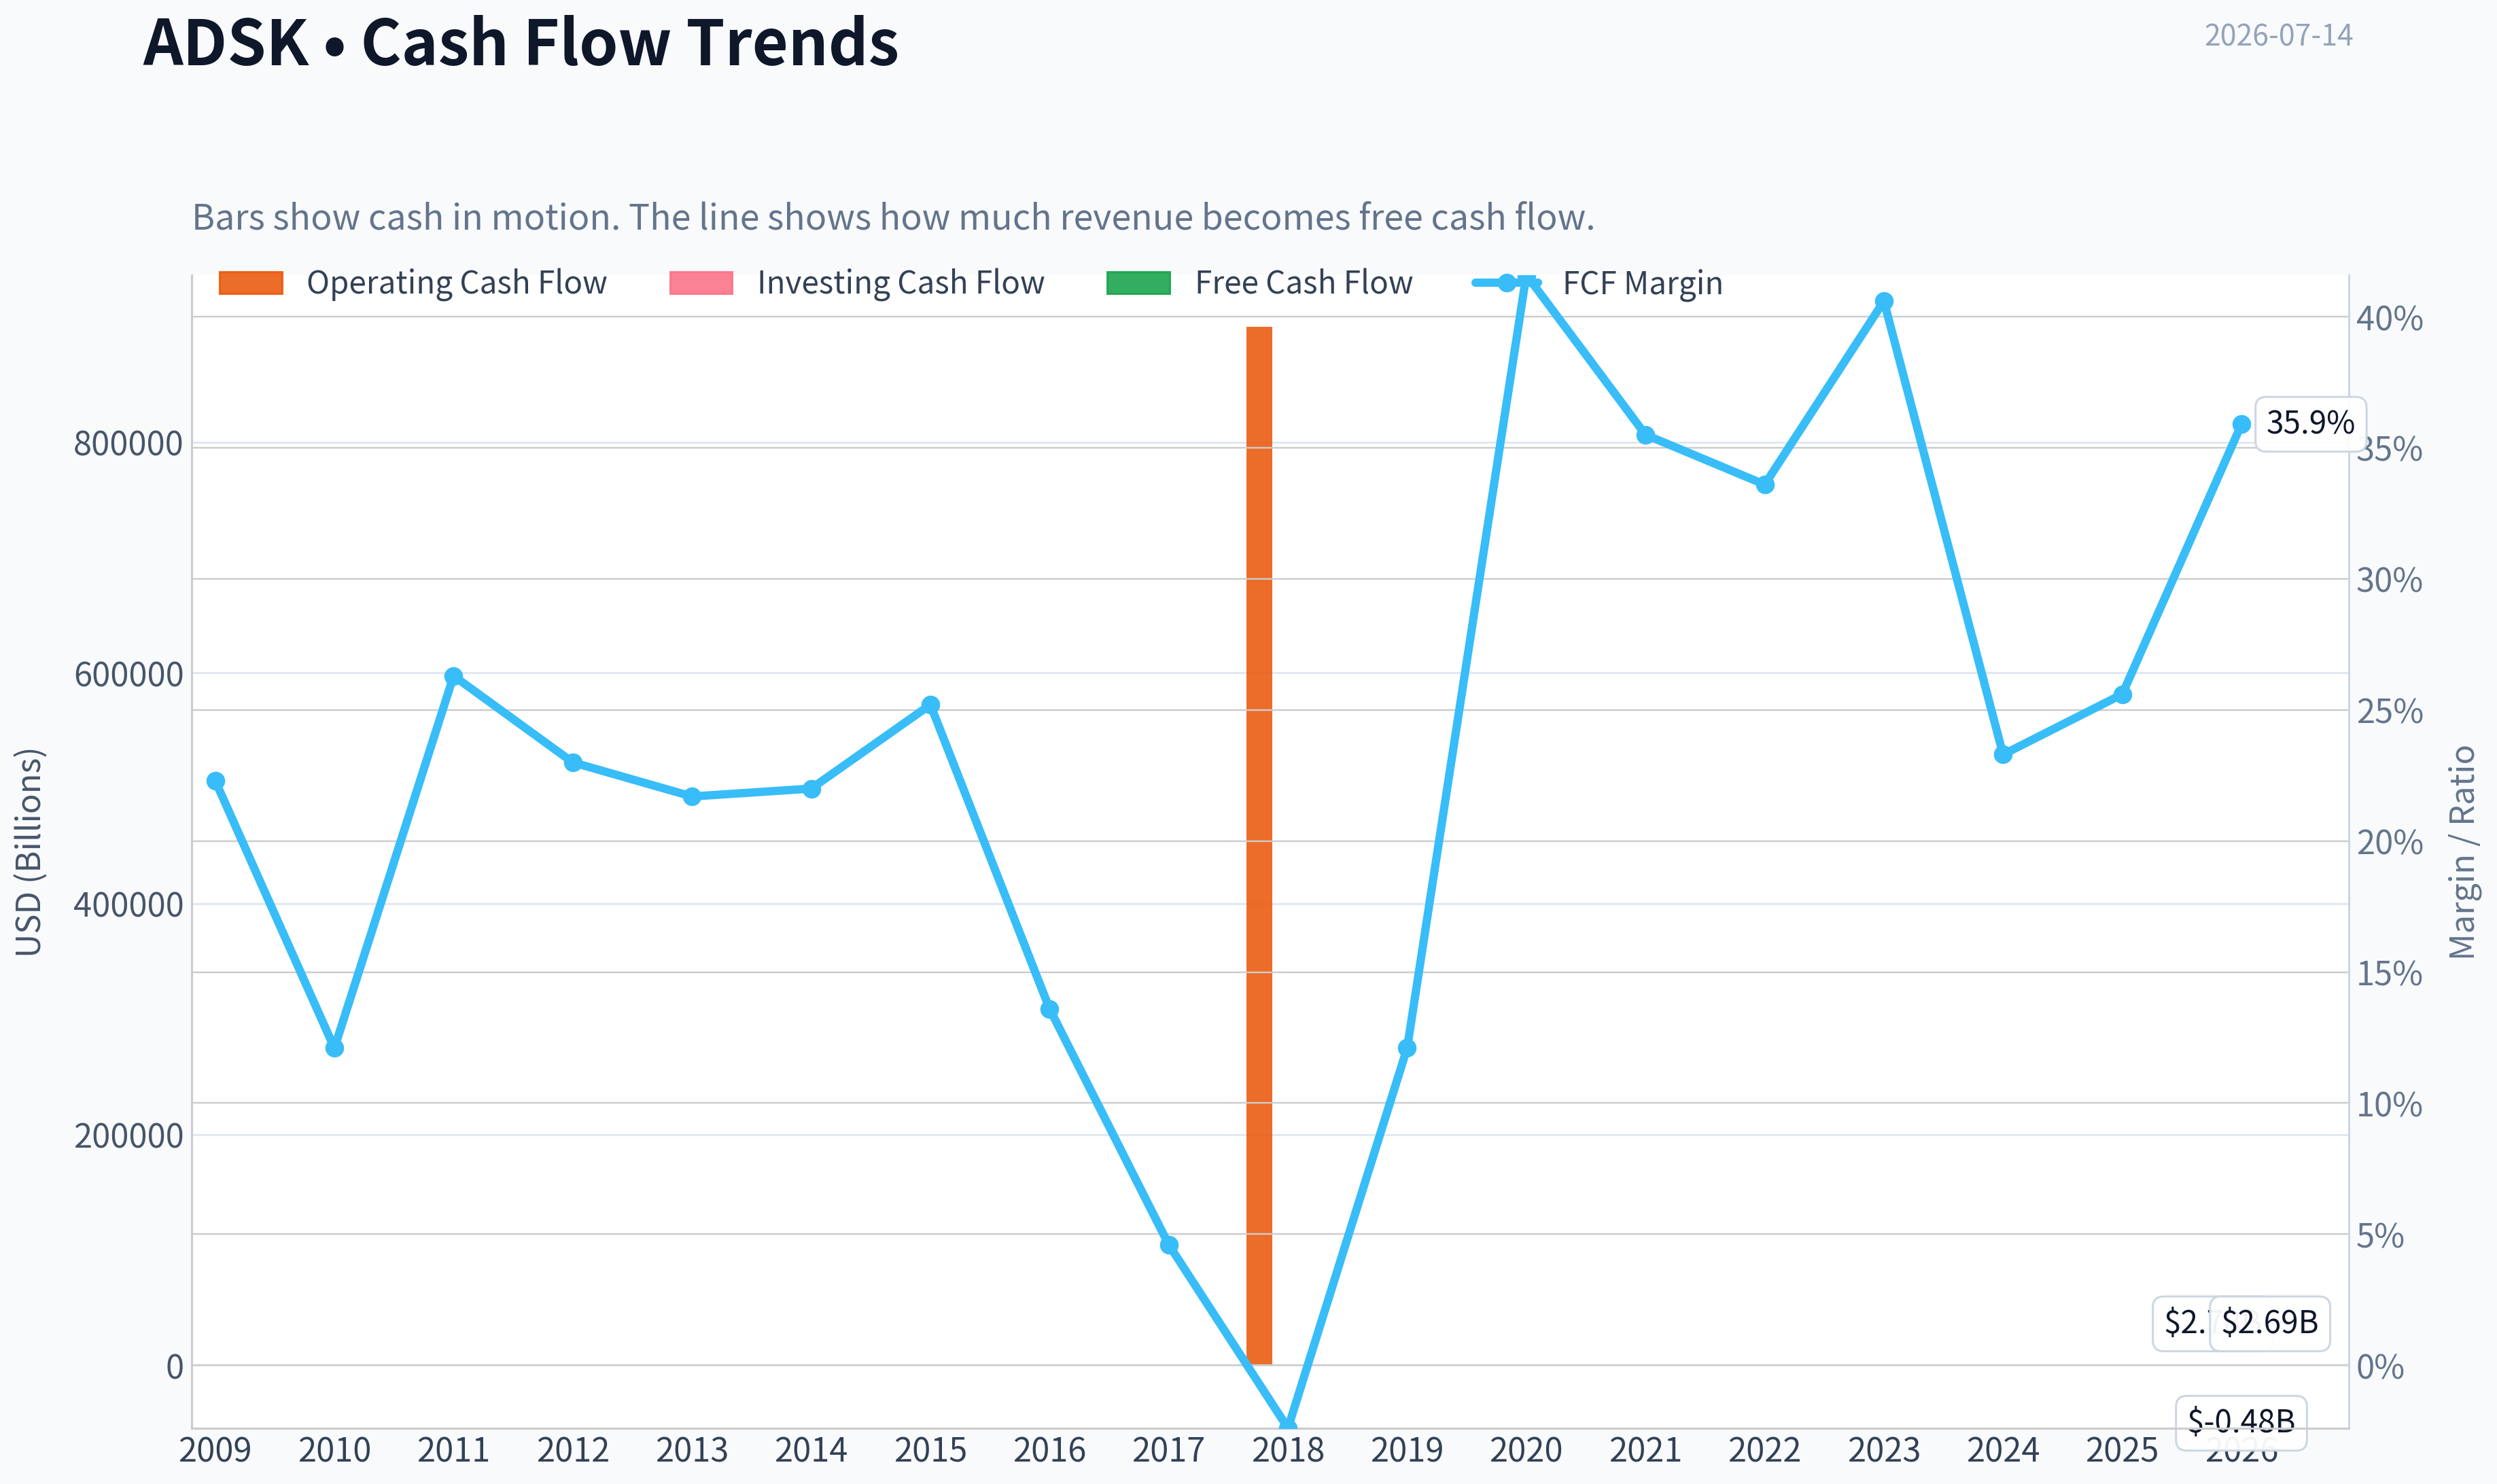
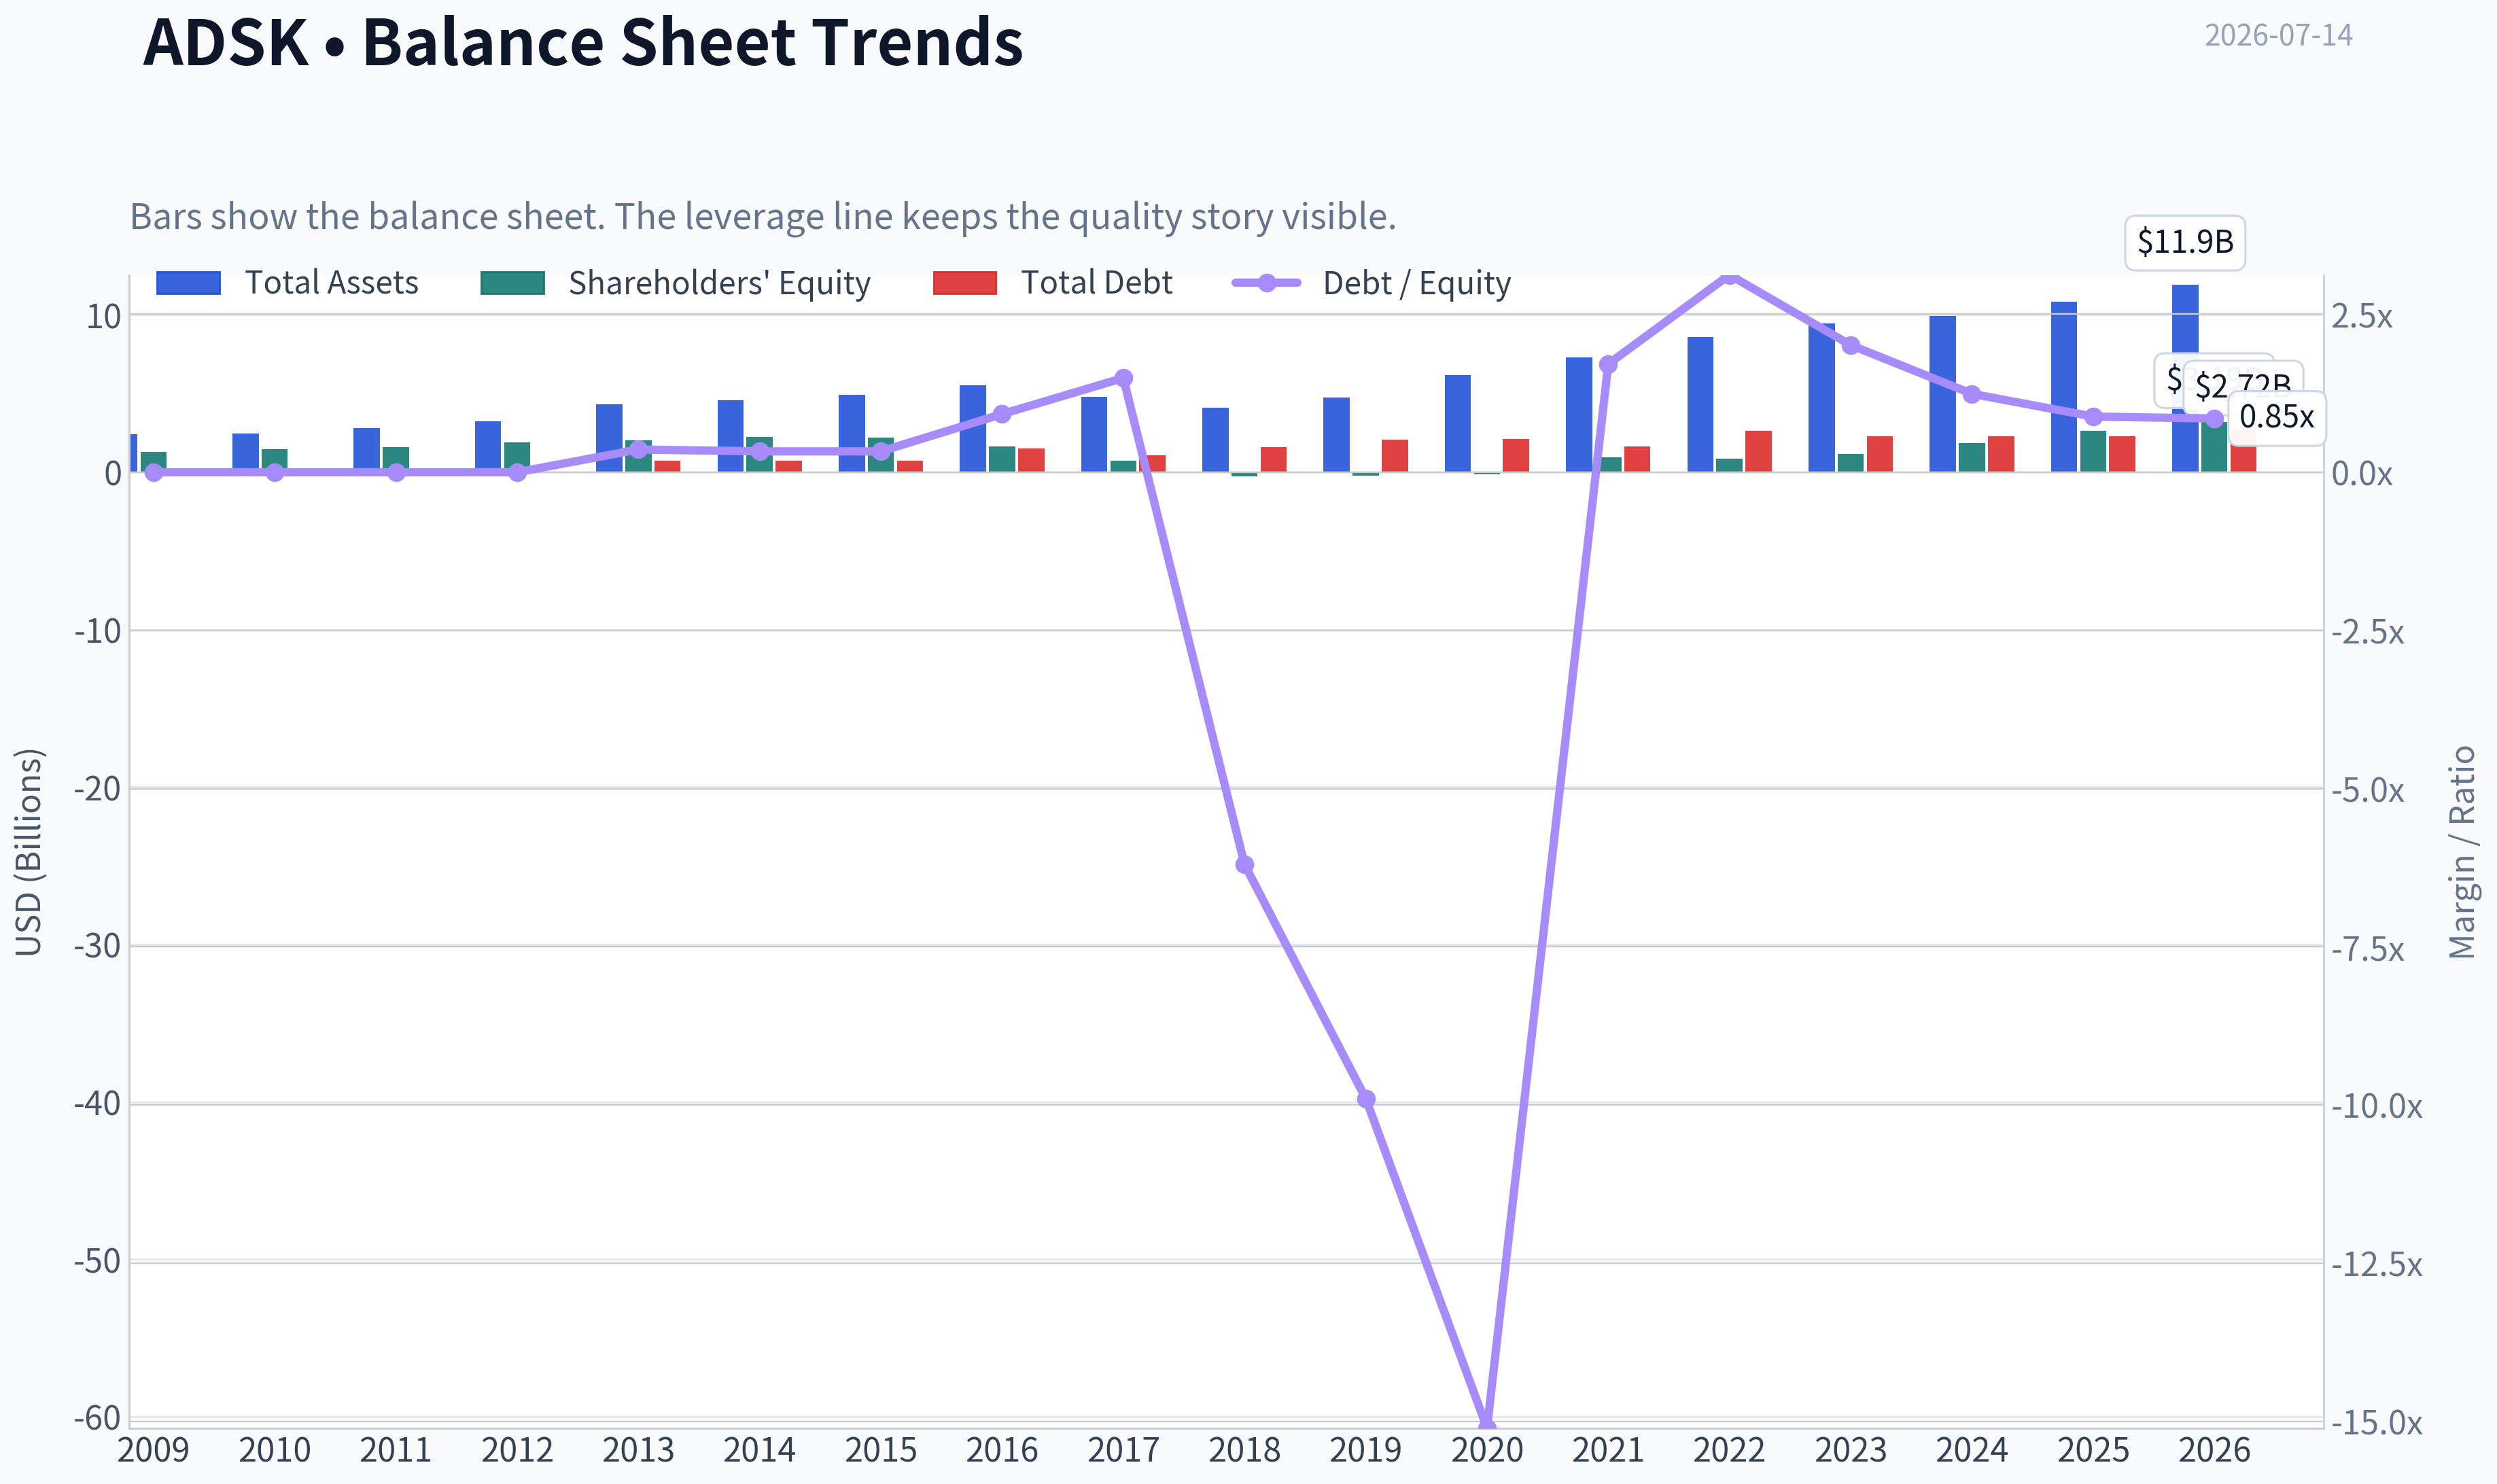
This graph tracks the profitability and return metrics (ROE, ROIC, Margins) of ADSK over the past decade, highlighting capital efficiency trends.
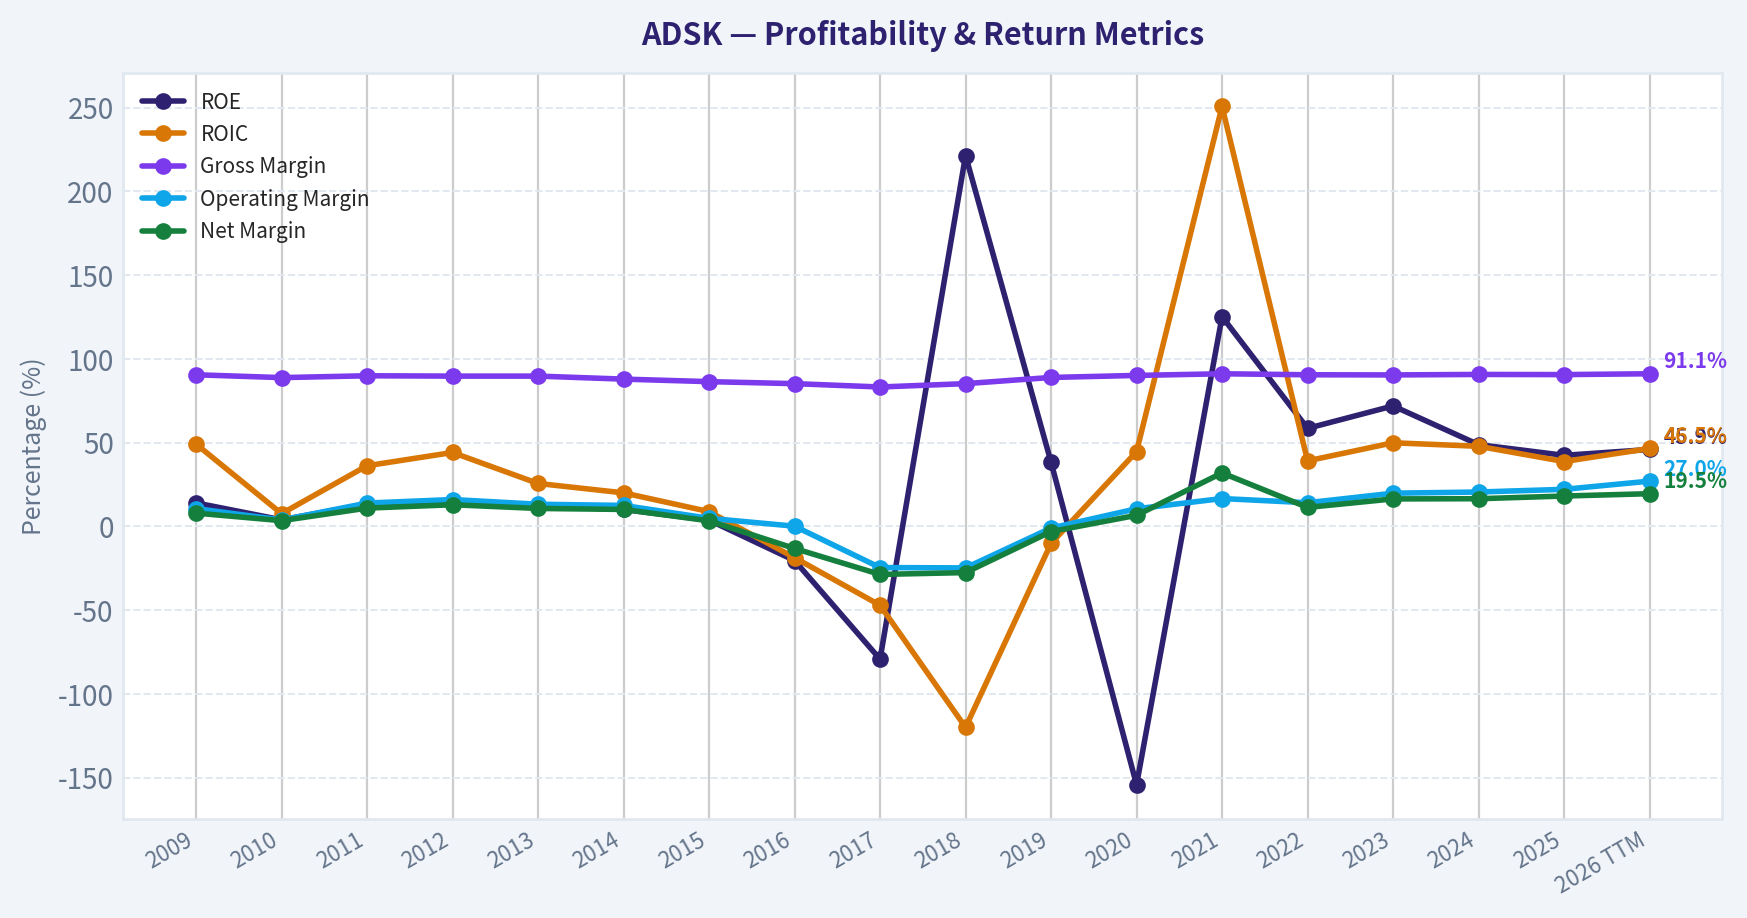
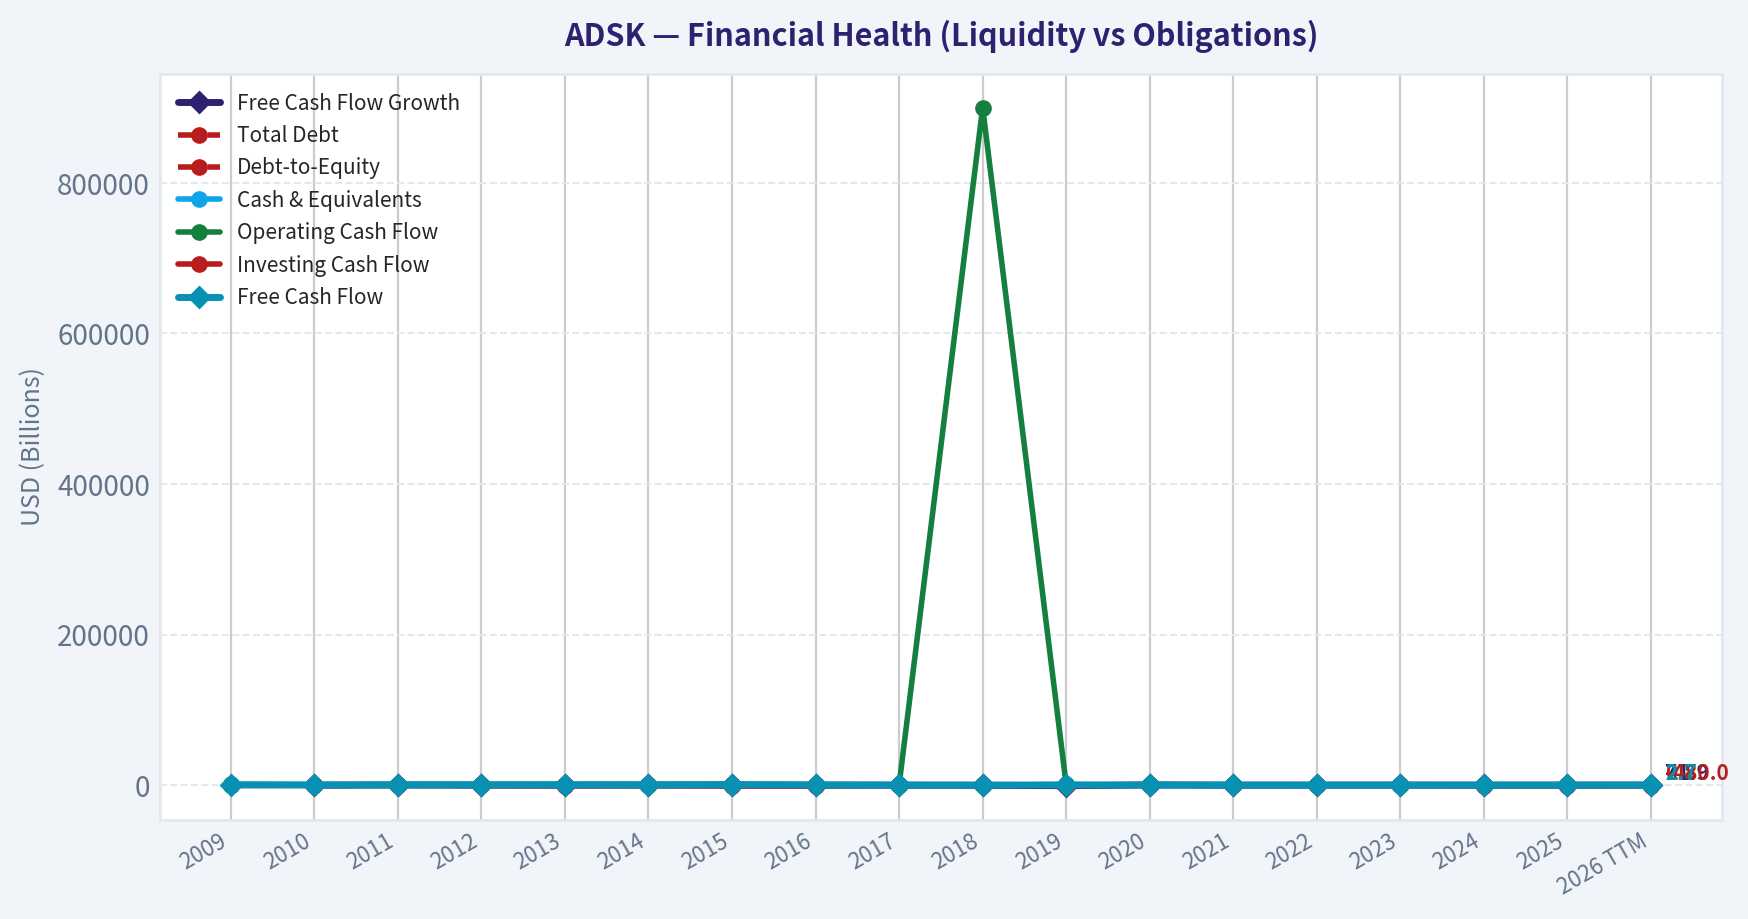
This chart illustrates the financial health of ADSK over the last 10 years, mapping cash equivalents and free cash flow against total obligations (Debt).
This breakdown chart from Revenue Breakdown shows the proportional composition for ADSK - useful for understanding what drives or risks the business.
Intrinsic Value Analysis (Buffett)#
Following Warren Buffett's value investing philosophy: Circle of Competence, Economic Moat, Management Quality, and Margin of Safety.
Intrinsic Value Snapshot#
Price is what you pay. Intrinsic value is what the business may be worth based on the cash it can create for owners over time. We show a range, not one magic number.
- Current Price: $212.22
- Value Range (conservative to optimistic across both DCF methods): $10.27 to $251.67
Owner Earnings (Buffett Method)
- Net Income: $1,112,000,000.00
- Depreciation & Amortization: $195,000,000.00
- Capital Expenditures: $-43,000,000.00
- Working Capital Changes: $-501,000,000.00
- Owner Earnings: $1,710,000,000.00
Intrinsic Value
Buffett Method
Uses owner earnings. Stricter, and usually more conservative. - Conservative: $10.27 - Average: $229.13 - Optimistic: $229.13 - Discount Rate: 10.0%
Cash Flow Method
Uses free cash flow. Better for companies spending heavily today to grow tomorrow. - Conservative: $34.27 - Average: $206.17 - Optimistic: $251.67 - Discount Rate: 10.0%
I'm blocked on the required audited PostgreSQL financials tool for ADSK because it isn't available in this run under the actual tool namespace presented to me.
What I can establish now from the shared research pack:
- Company: Autodesk, ticker ADSK
- Current price: $212
- Market cap: $44.81B
- P/E: 30.4
- ROE: 36.9%
- Gross margin: 91.0%
- YoY revenue growth: 17.5%
- FCF yield: 5.4%
- Current ratio: 0.85
Initial Buffett-style read: - Business simplicity: Pass. Autodesk sells design software subscriptions used by architects, engineers, manufacturers, and media creators. - Predictability: Pass. The core need for design/CAD/BIM software is durable and understandable over a decade. - Technology risk: Mixed but acceptable. Autodesk benefits from technology change more than it is threatened by it, though AI-native design tools are a developing risk. - Moat: Likely strong. The 91% gross margin strongly supports intangible assets and switching costs. Deep workflow embedding, file compatibility, training ecosystems, and industry standardization are classic captivity traits. - Financial quality: Strong on surface. ROE near 37% and positive FCF yield indicate a high-quality software model, though ROE needs leverage/context decomposition before a final Buffett-grade conclusion. - Balance sheet caution: Current ratio below 1 and the newly established $2B commercial paper program suggest liquidity management deserves scrutiny rather than blind confidence.
Provisional stance: - Moat appears real, but valuation does not obviously scream bargain at 30x earnings. - This is shaping up more like WATCH than immediate ADVOCATE unless deeper historical owner-earnings and balance-sheet review shows unusually durable compounding plus undervaluation.
If the next assistant can use the available financial statement tools, the key remaining work is: 1. Pull 10-year income statement, balance sheet, and cash flow history. 2. Compute owner earnings. 3. Check debt, share count trend, SBC dilution, and OCF vs net income. 4. Run 3-scenario DCF and margin-of-safety test. 5. Finalize Buffett scorecard and stance.
Tentative handoff conclusion: likely WATCH, pending full statement-based valuation and balance-sheet review.
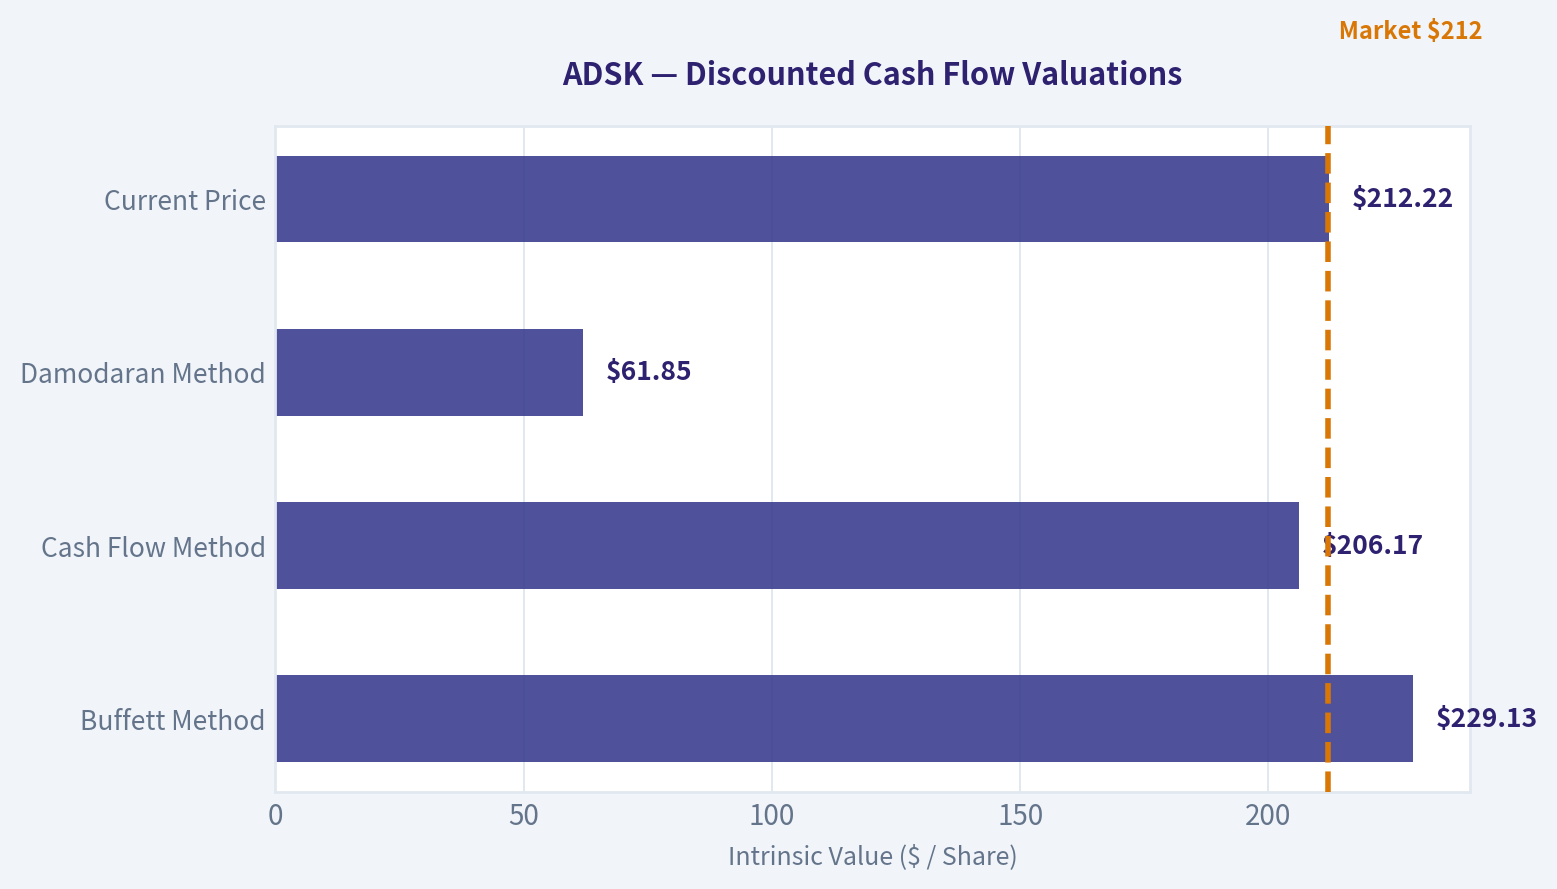
Valuation Bridge#
This bridge places the current market price beside each intrinsic value lens so readers can see whether upside depends on one method or shows up across several methods.
| Scenario | Intrinsic Value / Share |
|---|---|
| Buffett Method | $229.13 |
| Cash Flow Method | $206.17 |
| Damodaran Method | $61.85 |
| Current Price | $212.22 |
Key Takeaways#
If one method is far above the others, the upside case depends on a specific modelling assumption. When several methods cluster together, the valuation story is more robust.
Valuation Visuals#
This comparison chart from Latest Earnings Snapshot stacks current figures against historical benchmarks for ADSK, making it easy to see where the company trades relative to its own averages.
This comparison chart from Current vs Historical Average Comparison stacks current figures against historical benchmarks for ADSK, making it easy to see where the company trades relative to its own averages.
This comparison chart from Balance Sheet Analysis stacks current figures against historical benchmarks for ADSK, making it easy to see where the company trades relative to its own averages.
The following chart maps the ADSK Owner Earnings DCF valuation scenarios (Conservative, Average, Optimistic) to visually represent the margin of safety based on intrinsic value calculations.
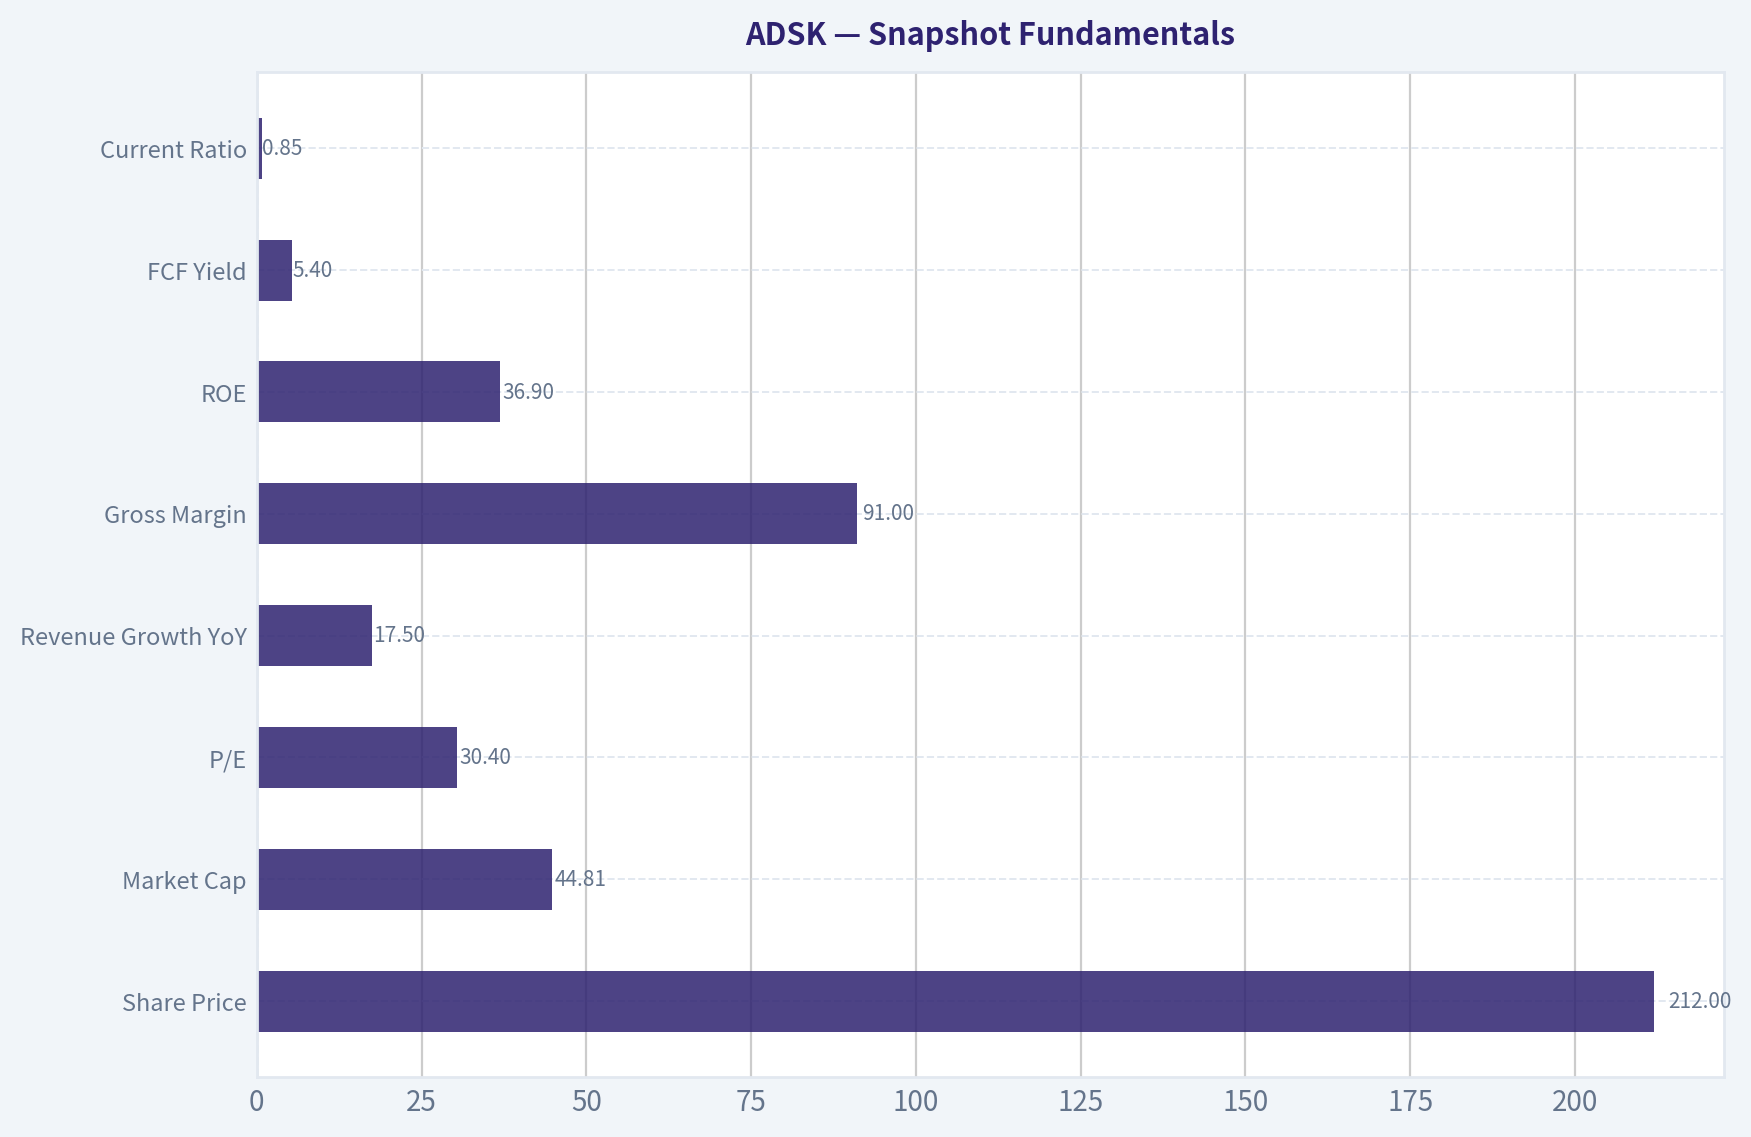
This comparison chart from Snapshot Fundamentals stacks current figures against historical benchmarks for ADSK, making it easy to see where the company trades relative to its own averages.
Trend & Growth Analysis (Lynch/Druckenmiller/Fisher)#
Following Peter Lynch's GARP, Stanley Druckenmiller's macro-aware approach, and Philip Fisher's scuttlebutt methodology.
ANALYST STANCE: WATCH
Autodesk (ADSK) Growth Analysis#
1. Lynch Classification#
ADSK is a Fast Grower / high-quality stalwart hybrid. At 17.5% YoY revenue growth, it still fits the lower end of Lynch's fast grower bucket, but the company's size at $44.8B market cap means it behaves more like a scaled compounder than an early ten-bagger candidate.
2. The Story in 3 Bullets#
- Autodesk sells mission-critical design software used by architects, engineers, manufacturers, and media creators.
- Its shift to subscription and cloud-based workflows created a highly recurring, high-margin revenue model.
- The growth question is no longer "does the product work?" but whether AI, cloud collaboration, and industry digitization can re-accelerate growth enough to justify a premium multiple.
3. Snapshot Fundamentals#
| Metric | Value |
|---|---|
| Share Price | $212 |
| Market Cap | $44.81B |
| P/E | 30.4x |
| Revenue Growth YoY | 17.5% |
| Gross Margin | 91.0% |
| ROE | 36.9% |
| FCF Yield | 5.4% |
| Current Ratio | 0.85x |
Key Takeaways: Autodesk is a very high-quality software business with exceptional gross margins and strong cash generation. The main debate is not quality, but whether mid-to-high teens growth is enough to make the stock compelling at roughly 30 times earnings.
4. TAM Analysis and 10x Test#
| Item | Assessment |
|---|---|
| Core Markets | AEC, manufacturing design, construction workflow, 3D design/media |
| TAM Direction | Expanding due to digitalization, cloud workflows, AI-assisted design |
| Current Revenue Base | Not provided in research pack, but clearly large-scale enterprise software |
| 10x Test | Fails in practical terms |
| Why | A 10x outcome from current scale would imply Autodesk becoming one of the largest software platforms globally; possible only with major category expansion, not core execution alone |
Key Takeaways: Autodesk still has runway, but this is not a small-cap with open-field ten-bagger math. The opportunity is more likely durable compounding through market expansion and share gains than a classic Lynch-style 10x from here.
5. Revenue Growth Trend#
| Metric | Reading |
|---|---|
| Latest YoY Revenue Growth | 17.5% |
| Growth Category | Healthy, but not hypergrowth |
| Trend Signal | Insufficient evidence of acceleration from the provided data |
| Interpretation | Likely steady growth rather than a clear inflection |
Key Takeaways: The reported growth rate is solid for a company of Autodesk's size, but the key missing ingredient is visible acceleration. Without evidence that growth is moving up rather than simply holding, this looks more like a quality compounder than an inflection-point buy.
6. Unit Economics#
| Metric | Reading | Assessment |
|---|---|---|
| Gross Margin | 91.0% | Best-in-class software economics |
| FCF Yield | 5.4% | Strong cash generation |
| Rule of 40 Proxy | 17.5% growth + strong FCF profile = likely healthy | Positive |
| LTV/CAC | Not disclosed in provided data | Unknown |
| NRR | Not disclosed in provided data | Unknown |
| Payback Period | Not disclosed in provided data | Unknown |
Key Takeaways: Even without full SaaS cohort metrics, Autodesk clearly has elite software economics. The combination of 91% gross margins and positive free cash flow suggests a very efficient recurring model, though missing NRR and CAC data limits conviction on incremental growth efficiency.
7. Inflection Point Assessment#
| Potential Inflection | Status | View |
|---|---|---|
| Product Cycle Inflection | Possible | AI-assisted design and cloud workflows could help |
| TAM Inflection | Real | More construction/manufacturing workflows digitizing |
| Margin Inflection | Mostly matured | Already highly efficient |
| Market Share Inflection | Unclear | No hard evidence in provided data |
| Competitive Inflection | Unclear | No competitor stumble cited |
Key Takeaways: The most plausible upside driver is TAM expansion through AI and deeper workflow penetration, not basic margin improvement. But based on current evidence, the company appears to be evolving steadily rather than hitting a sharp Druckenmiller-style inflection.
8. Macro Setup Evaluation#
| Factor | Assessment |
|---|---|
| Secular Theme Exposure | Strong: cloud, industrial digitization, AI design tools |
| Rate Sensitivity | Moderate; software multiples benefit from stable/falling rates |
| End-Market Exposure | Construction and manufacturing create some cyclical sensitivity |
| Macro Wind | Mixed positive |
Key Takeaways: Autodesk benefits from long-duration software and digitization themes, but it is not insulated from cyclical weakness in construction and industrial spending. Macro is supportive enough for ownership, but not so strong that it overrides valuation discipline.
9. Fisher 15 Points Score#
| Category | Score (1-5) | Notes |
|---|---|---|
| Market potential | 4 | Large global design software markets |
| New products | 4 | Ongoing platform and workflow expansion |
| R&D effectiveness | 4 | Strong product relevance and innovation history |
| Sales organization | 4 | Global enterprise reach |
| Profit margin | 5 | Excellent economics |
| Improving margins | 3 | Already strong; less room for dramatic expansion |
| Labor relations | 3 | No major signal provided |
| Executive relations | 3 | No major signal provided |
| Management depth | 4 | Mature scaled software operator |
| Cost/accounting controls | 4 | Strong cash generation implies discipline |
| Special advantages | 5 | Workflow embedding, switching costs, ecosystem position |
| Long-range outlook | 4 | Attractive secular demand |
| Dilution risk | 4 | No major red flag indicated |
| Candor | 3 | Limited evidence from pack |
| Integrity | 3 | No red flag, but limited evidence |
| Total | 57 / 75 | GOOD |
Key Takeaways: Autodesk scores as a good-to-very-good Fisher company, especially on product strength, margins, and competitive position. The score stops short of outstanding mainly because the provided evidence does not clearly prove exceptional management candor, depth, or a dramatic next-leg growth acceleration.
10. Valuation Analysis#
| Method | Value | Interpretation |
|---|---|---|
| P/E | 30.4x | Premium but not extreme for quality software |
| PEG | ~1.74x (30.4 / 17.5) | Fair to somewhat expensive |
| FCF Yield | 5.4% | Supportive valuation floor |
| P/S | Not available in pack | N/A |
Key Takeaways: Autodesk is not cheap on growth-adjusted earnings, with a PEG near 1.7 suggesting the market already recognizes a lot of the quality. The saving grace is strong free cash flow, which makes the stock more reasonable than many software peers despite only moderate growth.
11. Growth Investor Scorecard#
| Criterion | Weight | Score | Weighted Score |
|---|---|---|---|
| The Story | 10% | 4.0 | 0.40 |
| TAM & Runway | 20% | 3.5 | 0.70 |
| Revenue Growth | 20% | 3.2 | 0.64 |
| Unit Economics | 15% | 4.5 | 0.68 |
| Competitive Position | 10% | 4.5 | 0.45 |
| Management Quality | 10% | 3.8 | 0.38 |
| Macro Setup | 5% | 3.5 | 0.18 |
| Profitability Path | 5% | 4.5 | 0.23 |
| Valuation | 5% | 3.0 | 0.15 |
| Total | | | 3.80 / 5.0 |
Key Takeaways: Autodesk grades as a good setup, driven by quality, recurring economics, and secular tailwinds. The reason it lands in WATCH rather than ADVOCATE is simple: the business is excellent, but the evidence for a fresh growth inflection and bargain valuation is not strong enough.
12. Position Size Stance#
| Stance | View |
|---|---|
| Existing Holder | Hold / monitor closely |
| New Position | Starter only on weakness |
| Ideal Setup | Buy on growth re-acceleration or multiple compression |
Key Takeaways: Autodesk looks more like a "good company, wait for better setup" than an aggressive buy today. For growth investors, the ideal entry would come from either clearer acceleration in revenue or a cheaper valuation.
13. Key Risks and Catalysts#
| Risks | Catalysts |
|---|---|
| Growth remains stuck in mid-teens | AI features drive seat expansion and pricing power |
| Cyclical weakness in construction/manufacturing | Greater cloud/workflow adoption across industries |
| Multiple compression if rates stay higher | Margin durability and FCF compounding |
| Lack of visible inflection | New product cycles or deeper platform monetization |
Key Takeaways: The downside case is mostly about valuation and slower growth rather than business fragility. The upside case depends on Autodesk proving it can turn AI and workflow digitization into a genuine acceleration phase.
Bottom Line#
Autodesk is a high-quality, durable software compounder, but based on the data provided, it does not yet screen as a classic Lynch ten-bagger setup or a Druckenmiller-style inflection buy. The business is strong, the moat is real, and the cash generation is impressive. But with 17.5% growth and a PEG around 1.7, the stock looks good rather than great at current levels.
Conclusion: WATCH. Own it for quality if already held, but for fresh capital I would want either: 1. a better entry price, or 2. evidence that growth is re-accelerating above the current mid-teens pace.
Market Technical Analysis#
ADSK Technical Indicator Selection and Market Read#
For ADSK, the most relevant 8 complementary indicators right now are:
| Indicator | Why it matters now |
|---|---|
| close_10_ema | Best short-term trend gauge for the current rebound off late-June lows. |
| close_50_sma | Defines the medium-term trend, which is still negative and acting as overhead resistance. |
| close_200_sma | Confirms the long-term structure remains bearish despite the recent bounce. |
| macd | Tracks whether the recovery is developing into a durable momentum reversal. |
| macdh | Useful here because momentum is improving faster than price structure; it shows acceleration clearly. |
| rsi | Helps judge whether the rebound is still recovering from oversold conditions versus becoming stretched. |
| atr | Critical because ADSK has been in a high-volatility downswing; risk sizing matters. |
| vwma | Adds price-volume confirmation and helps test whether buyers are truly supporting the rebound. |
These indicators fit the current context because ADSK is not in a clean uptrend or pure mean-reversion washout. It is in a longer-term downtrend, medium-term downtrend, but short-term rebound phase, so the best toolkit needs trend, momentum, volatility, and volume confirmation together.
Trend and Momentum Snapshot#
| Metric | Latest/Recent Reading | Interpretation |
|---|---|---|
| Last close | 212.22 on 2026-07-13 | Price has rebounded materially from the June low zone. |
| close_10_ema | 206.34 | Price is trading above the short-term trend line; near-term momentum has improved. |
| close_50_sma | 221.92 | Price remains below the medium-term trend benchmark; rally has not repaired the broader damage. |
| close_200_sma | 260.62 | Price is far below the long-term trend line; the primary trend is still decisively bearish. |
| macd | -2.90 | Momentum is still negative in absolute terms, but much less negative than late June. |
| macdh | +3.11 | Momentum acceleration is positive; rebound strength is improving faster than the MACD level itself. |
| rsi | 52.98 | Momentum has normalized from oversold territory to neutral/slightly constructive. |
| atr | 8.14 | Daily movement remains large; volatility is elevated, though lower than June stress levels. |
| vwma | 199.51 | Price above VWMA suggests buyers have recently controlled the tape on a volume-adjusted basis. |
Key Takeaways: ADSK has clearly improved in the short run, with price above both the 10-day EMA and the VWMA, while RSI has recovered back to neutral. But the bigger picture is still weak because price remains below both the 50-day and 200-day moving averages, so this currently looks more like a rebound within a damaged trend than a confirmed new bull phase.
Detailed Trend Analysis#
ADSK's last 12 months divide into several distinct regimes rather than one continuous move. From mid-2025 into early autumn, the stock traded in a relatively firm upper range, even printing above 320 after the late-August gap higher. That phase established the last major area of institutional acceptance. However, the market could not sustain that valuation band, and the stock gradually rolled over through the fourth quarter.
The real structural break occurred in January through June 2026. Price deteriorated from the high-200s into the low-200s and eventually into the high-180s, creating a sequence of lower highs and lower lows across multiple timeframes. That matters because it means the current July rebound is emerging from a base built after a sharp trend decline, not from an already stable consolidation.
Short-term, the tone has improved meaningfully. The 10 EMA rose from about 196.5 at the end of June to 206.3 by July 13, which shows that recent closes are consistently stronger than the prior 1-2 week average. This is not just a one-day spike; it reflects a genuine near-term change in slope. Price action since July 1 also shows buyers willing to defend pullbacks above the 200 area, which is psychologically important.
Medium-term, however, the picture is still cautionary. The 50 SMA has continued drifting lower from roughly 243 in early May to about 222 now. That is a persistent downward slope, and sloping moving averages matter more than static levels. Even if price rallies, a falling 50-day average often acts as resistance because trapped holders use strength to exit. For ADSK, that places the 220-223 area as the first major technical test, and the stock is already close enough that upside may become more contested.
Long-term, the 200 SMA is falling from around 296 in January to 260.6 now, a very significant deterioration. The wide gap between spot price and the 200-day average tells us the stock has not yet restored strategic trend health. In practical terms, long-only trend traders usually will not treat this as a new uptrend unless ADSK can reclaim the 50-day average first, then build a base, and only later challenge the 200-day average.
Momentum Structure#
| Momentum Feature | Observation | Trading Implication |
|---|---|---|
| MACD level | Still below zero | The rebound has not yet fully transitioned into bullish medium-term momentum. |
| MACD trajectory | Strong improvement from about -12.8 in late June to -2.9 | Downside momentum has unwound sharply; bear pressure has faded. |
| MACD histogram | Turned decisively positive and rising | Momentum is accelerating positively before full trend confirmation. |
| RSI path | Rose from deeply oversold readings near 26-30 in late June to ~53 | The bounce is no longer merely oversold reflex; it has developed into a more balanced recovery. |
Key Takeaways: Momentum has improved faster than trend. The MACD remains below zero, so the medium-term backdrop is not fully bullish yet, but the positive histogram and recovering RSI show that sellers are no longer dominating the way they did in June.
The most nuanced part of the chart is the disconnect between improving momentum and still-damaged trend structure. This often happens in early recovery phases: oscillators and MACD improve first, while moving averages lag. For traders, that means the current signal quality depends heavily on time horizon.
For a short-term swing trader, the improving MACD histogram is encouraging because it shows upside thrust is still building. The histogram moved from negative in late June to over +3.1, a sizable change. That suggests buying pressure is not just present but increasing.
For a position trader, the caution is that MACD itself remains negative. This says the rebound may still be a countertrend rally rather than a full trend reversal. The key next test is whether MACD can cross into positive territory while price also sustains above the 50-day SMA. Without that combination, this remains technically incomplete.
RSI adds a useful refinement. ADSK was deeply washed out in late June, with readings in the mid-to-high 20s. It has since recovered to around 53, which is constructive because it shows normalization without yet becoming overbought. In other words, the stock has room to continue rallying, but the easy oversold rebound phase has already happened. Future upside now requires fresh demand, not just short-covering.
Volatility and Risk Conditions#
ADSK remains a relatively volatile setup. ATR is about 8.14, down from levels near or above 10 during the June stress phase. That reduction is important: it suggests panic conditions have eased. But volatility is still elevated enough that entries need wider stops than traders might use in a quieter trend.
At a price around 212, an ATR of roughly 8 means daily movement is close to 3.8% of price, which is substantial. This has two implications:
- Breakouts need room - tight stops just under a breakout candle are vulnerable to being shaken out.
- Resistance tests can fail violently - especially near the falling 50-day average.
A disciplined trader should think in zones, not single-price precision. For ADSK, the stock can look constructive above 205-206 and still suffer normal volatility. But a decisive loss back through the low-200s would weaken the rebound case materially.
Volume-Adjusted Read#
The VWMA at 199.51 is notably below current price. That is one of the more constructive features in the present setup. It indicates that, on a volume-weighted basis, recent buying has occurred at lower prices than today's market, meaning holders from the recent recovery are generally in profit rather than underwater.
That matters because rallies supported by price above VWMA tend to be healthier than rallies where price is merely floating above a simple average on thin volume. The caveat is that ADSK had several large-volume stress days in late May and June, so volume-weighted signals can be influenced by those events. Even so, the current relationship is supportive of the rebound thesis.
A strong continuation signal would be: price stays above VWMA while pulling back shallowly, then resumes upward. A weaker signal would be: price loses VWMA and fails to reclaim it, suggesting the rebound was largely short-covering rather than sustained accumulation.
What the Trend Really Says Right Now#
It would be too simplistic to say ADSK is "mixed." The finer reading is:
-
Primary trend: bearish The 200-day average is declining and price is far below it.
-
Intermediate trend: bearish but trying to stabilize The 50-day average is still falling, but price is approaching it after a meaningful rally.
-
Short-term trend: bullish rebound Price is above the 10-day EMA, MACD histogram is positive, and RSI has normalized.
That hierarchy matters. In practice, short-term buyers currently have the tactical edge, but medium- and long-term sellers still control the larger structure. This often creates a tradable rally with increasingly difficult progress as price nears overhead resistance.
Actionable Technical Levels and Scenarios#
| Scenario | What to watch | Read-through |
|---|---|---|
| Bullish continuation | Hold above 205-206 and then clear 220-223 | Would suggest the rebound is expanding into a more meaningful medium-term recovery. |
| Early warning | Price slips back below 10 EMA while MACD histogram shrinks | Suggests upside momentum is fading before trend repair is complete. |
| Rebound failure | Loss of 199-200 area and VWMA | Would imply the recent advance has lost volume-backed support. |
| Structural improvement | Price reclaims 50 SMA and builds above it | First real evidence that the medium-term downtrend is weakening. |
| Long-term repair | Eventually challenge 260+ near the 200 SMA | Needed before strategic trend followers can view ADSK as fully rehabilitated. |
Key Takeaways: The most important near-term battle is between the current rebound and the falling 50-day average near 222. If ADSK can stay above roughly 205-206 and eventually push through the 220 area, the recovery can broaden; if it falls back under 200, the recent strength will start to look temporary.
Bottom Line#
ADSK is showing a credible short-term recovery after a severe multi-month selloff. Momentum indicators have improved sharply, RSI is no longer oversold, and price has moved above both the 10 EMA and VWMA. Those are real positives.
But this recovery is happening inside a still-bearish larger structure. The falling 50-day and 200-day moving averages, especially with price still well below both, argue against declaring a durable trend reversal yet. The stock is at the stage where tactical long setups may work, but strategic conviction still requires proof through resistance reclamation.
| Category | Indicator | Current Signal | Why It Matters |
|---|---|---|---|
| Short-term trend | close_10_ema | Bullish short-term | Confirms recent price recovery is active. |
| Medium-term trend | close_50_sma | Bearish overhead resistance | Key test for whether rally can mature. |
| Long-term trend | close_200_sma | Strongly bearish structure | Keeps the primary trend negative. |
| Momentum | macd | Improving but still negative | Rebound is real, but not fully confirmed. |
| Momentum acceleration | macdh | Clearly positive | Upside thrust is strengthening. |
| Momentum condition | rsi | Neutral/constructive | No longer oversold, not yet overbought. |
| Volatility | atr | Elevated but easing | Risk remains high; position sizing matters. |
| Volume confirmation | vwma | Price above VWMA | Suggests recent buyers are supporting the move. |
Key Takeaways: ADSK has shifted from a washed-out decline into a constructive rebound, but it has not yet repaired the broader chart damage. Traders can treat it as a strengthening short-term recovery, while investors should remain cautious until the stock proves it can reclaim and hold above the falling 50-day average.
Options Market Analysis#
Reading options flow - put/call ratios, IV skew, and unusual activity - to gauge institutional positioning and event-driven risk.
ADSK Options Positioning Report#
Data as of 2026-07-14
ADSK's near-term options tape leans BEARISH. The clearest signal is the very heavy put volume relative to call volume in the front expirations, combined with higher ATM put IV than call IV, which points to downside protection demand and elevated short-term caution. Confidence is only moderate, though, because reported open interest is very light and some expirations show sparse chain depth.
1. Put/Call Ratio Analysis#
| Expiration | Call OI | Put OI | Put/Call OI Ratio | Call Volume | Put Volume | Put/Call Volume Ratio |
|---|---|---|---|---|---|---|
| 2026-07-17 | 16 | 2 | 0.12 | 304 | 4,567 | 15.02 |
| 2026-07-24 | 0 | 0 | N/A | 358 | 127 | 0.35 |
| 2026-07-31 | 0 | 0 | N/A | 102 | 76 | 0.75 |
| Near-term total | 16 | 2 | 0.12 | 764 | 4,770 | 6.24 |
Key Takeaways: The open-interest ratio looks superficially bullish at 0.12, but it is based on almost no OI and should not be trusted as a standalone signal. The more important read is flow: near-term put volume is over 6 times call volume overall, and more than 15 times call volume in the 2026-07-17 expiry, which is a strong sign of short-dated downside hedging or bearish speculation.
Interpretation: - Historical neutral put/call baseline is around 0.7. - ADSK's OI ratio of 0.12 would normally suggest a call-heavy positioning backdrop, but with total OI of only 18 contracts, that signal is statistically weak. - The volume ratio of 6.24 is the more relevant near-term indicator and is materially above neutral, indicating a clear recent shift toward puts. - My read: this is not bullish call chasing; it looks more like traders are paying for downside protection into a near-term event window or a fragile market setup.
2. Implied Volatility Assessment#
| Expiration | ATM Call IV | ATM Put IV | Put Premium vs Call IV | IV Read |
|---|---|---|---|---|
| 2026-07-17 | 3.2% | 4.7% | +1.5 pts | Bearish/downside-sensitive |
| 2026-07-24 | 2.0% | 2.8% | +0.8 pts | Mild put skew |
| 2026-07-31 | 1.2% | 1.6% | +0.4 pts | Modest put skew |
| Trend | - | - | Puts richer than calls across all near terms | Consistent downside skew |
Key Takeaways: Near-term put IV is higher than call IV across every listed front expiration. That steady put premium indicates the market is assigning more value to downside protection than upside participation, which is a classic sign of defensive positioning.
Interpretation: - ADSK shows a clear put skew in the front-end term structure. - The steepest skew is in 2026-07-17, where put IV exceeds call IV by 1.5 volatility points. - This suggests traders are willing to pay more for downside convexity than for upside exposure. - No explicit catalyst data was provided by the options tool, so I cannot confirm whether this is tied to earnings or a company-specific event. Still, the front-loaded put premium implies the market sees near-term event risk or elevated uncertainty.
3. Unusual Options Activity#
| Screen Result | Observation |
|---|---|
| Volume > 5x Open Interest | No qualifying contracts found in near-term expirations |
Key Takeaways: There were no flagged contracts with volume greater than 5 times open interest under the tool's unusual-activity screen. That means there is no clean, high-conviction single-line trade to point to as obvious smart-money positioning.
Because the tool did not identify any specific unusual contracts, there is no standout fresh block or sweep to isolate. That weakens conviction somewhat. However, the aggregate put volume surge, especially in the front weekly expiration, still matters and suggests broader hedging demand even if it is not concentrated in one spectacular contract.
4. Open Interest Concentration#
| Area | Observation | Implication |
|---|---|---|
| Highest near-term OI | Very limited reported OI overall | Weak pinning signal |
| 2026-07-17 chain | 16 call OI vs 2 put OI | Too small to infer meaningful dealer positioning |
| 2026-07-24 / 2026-07-31 | OI reported as 0 | No reliable OI-based gamma map available |
Key Takeaways: There is not enough reported open interest in the near-term expirations to build a strong max-pain or gamma-wall framework. In practice, that means options are less likely to provide reliable "magnet" levels for ADSK price action over the next couple of weeks, at least from the data shown here.
Interpretation: - Normally, the strikes with the largest OI can act as pinning levels into expiry. - Here, OI is simply too sparse to identify meaningful gamma walls or gravitational strikes. - That means price could be less constrained by dealer hedging mechanics and more responsive to underlying stock flow or broader market moves.
5. Overall Options Sentiment Signal#
| Signal | Confidence | Primary Driver |
|---|---|---|
| BEARISH | Moderate | Heavy front-end put volume plus persistent put IV premium |
Key Takeaways: The overall signal is bearish, driven mainly by the imbalance in short-dated put flow and the consistent downside volatility skew. Confidence is not high enough for an aggressive call because open interest is unusually thin, but the best directional read from the available options data still points lower or at least more defensive than neutral.
Synthesis: - Bullish evidence: extremely low put/call OI ratio. - Why I discount it: OI is tiny and therefore unreliable. - Bearish evidence: - Near-term put volume overwhelms call volume - Puts trade at richer IVs than calls across all front expirations - Front-week positioning appears especially defensive - Net conclusion: BEARISH, with the caveat that this is a flow-driven bearish read, not a strong OI-anchored structural view.
Final Summary Table#
| Metric | Read |
|---|---|
| Put/Call Ratio | OI ratio 0.12 (not reliable due to tiny OI); Volume ratio 6.24 = bearish flow |
| IV Level | Near-term IV richer in puts; front week most elevated |
| Skew Direction | Put skew / downside fear |
| Unusual Activity | No contract met >5x OI screen; no single standout smart-money line |
| Overall Signal | BEARISH |
Key Takeaways: ADSK's options market is signaling short-term caution rather than upside enthusiasm. The main tell is not open interest, which is too thin to trust, but the combination of strong put volume and richer put volatility, both of which point to defensive positioning.
Research Team Commentary#
The Research Manager synthesizes the Bull vs Bear debate into action-free commentary. This is a pre-risk view, not the final stance.
The strongest bull argument is straightforward: Autodesk is clearly a real business franchise, not a flimsy software story. Mission-critical design tools embedded in customer workflows create switching costs, recurring revenue is now much stronger after the subscription shift, and the economics are excellent by almost any quality metric. A 91% gross margin, ROIC above 30%, and ROE near 37% all point to a business with genuine pricing power and attractive owner economics. The bull's best point is that the stock is no longer at the extreme valuation levels that previously made it easy to reject; at about 30x earnings rather than the old stretched levels, the question becomes less "is this absurdly expensive?" and more "is this a fair price for a durable compounder?"
The strongest bear argument is that this still does not look like a Buffett-style margin-of-safety setup. A 30x earnings multiple may be lower than before, but it is not cheap for a company exposed to construction, manufacturing, and project-based customer budgets. The moat is real, yet not untouchable: cloud workflows, interoperability, AI-assisted design, and specialized competitors can gradually reduce lock-in. High software returns on capital can also flatter the picture if investors ignore stock-based compensation, reinvestment needs, or the risk of multiple compression. Most importantly, the market setup remains cautious: the primary trend is still bearish, and we have already learned from similar mistakes that admiring a high-quality software business should not dilute a negative conclusion when valuation support is only partial.
My takeaway is that Autodesk is a high-quality company, but not yet a clear value investment. The business passes many Buffett tests on quality, recurring demand, and returns on capital. What it does not yet clearly pass is price discipline. At 30x earnings, investors are still paying up for durability that may prove real, but not certain enough to justify calling this a bargain. The crowd may have become less euphoric, but I do not see enough fear to create a true mispricing. That is important. In past similar cases, the mistake was stopping at "good company, maybe watch it" when the better action was more defensive. Here I do not think the evidence is bearish enough for a full AVOID on long-term business quality alone, but it is still not cheap enough for ADVOCATE.
So my stance is WATCH.
Core takeaway: Autodesk looks like a wonderful business that is approaching a more reasonable price, but it still lacks the clear margin of safety that a Buffett-style portfolio should demand. If the stock were materially cheaper, this could become compelling quickly. Today, it looks more like a high-quality name to monitor than an obvious buy.
Rationale: From a value investing perspective, business quality comes first, and Autodesk scores well there. The software is deeply embedded, the revenue base is sticky, and profitability is elite. Those are exactly the traits that can support compounding over a decade. But Buffett's framework is not just about owning great businesses; it is about owning them at prices that protect you if growth slows, competition rises, or the market re-rates the multiple downward. At 30x earnings, that protection is limited. I do think the bull is right that valuation is much improved versus prior periods, but the bear is more persuasive on intrinsic value discipline. This is not a cigar butt, and it is not obviously a bargain-quality compounder either. It sits in the middle: a very good business, with a stock price that is no longer outrageous, but still not clearly attractive enough.
The contrarian angle also matters. If sentiment were washed out and the market were treating Autodesk as structurally broken, that could be an opportunity. But the evidence here suggests caution rather than capitulation. The primary trend is still bearish, and there is no indication that the market has fully abandoned the quality narrative. That means the downside from multiple compression may not be fully exhausted, especially if management delivers merely decent, rather than excellent, growth and margin performance.
Monitoring plan over the next 1 to 4 quarters: First, watch revenue growth versus earnings and free cash flow conversion. If Autodesk can show that revenue growth is translating more cleanly into owner earnings, the quality case gets stronger. Second, watch renewal strength, seat expansion, and pricing realization across AEC and manufacturing customers; any signs of seat optimization or pricing resistance would weaken the moat narrative. Third, listen carefully for management commentary on AI and cloud: are these actually improving monetization and retention, or just increasing spend to defend the franchise? Fourth, monitor capital allocation, especially buybacks and dilution. A high-quality software company can still destroy value if shareholder returns are offset by SBC or poor repurchase discipline. Fifth, keep an eye on end-market tone in construction and industrial budgets, because subscription does not eliminate cyclical pressure. Finally, from a market perspective, I would want to see either a cheaper valuation or clearer evidence that the bearish primary trend has truly repaired before becoming more constructive.
If the next few quarters show durable mid- to high-single-digit or better growth, stable to improving margins, solid cash conversion, and evidence that AI/cloud are deepening the moat rather than commoditizing it, this could move toward ADVOCATE. If instead growth stays merely okay while the company still trades at a premium multiple and technical weakness persists, the bear case wins and the stance would likely shift to AVOID.
Final stance: WATCH.
Value Investing Team Commentary#
The Investor translates the research view into an investment thesis before risk review. This is still not the final stance.
Autodesk is the kind of company a long-term owner should respect. It sells essential software, sits inside customer workflows, earns exceptional gross margins, and converts that position into very strong returns on capital. Those are not accidental traits. They usually signal a real moat: switching costs, entrenched standards, trained user bases, and products that are small relative to the cost of customer mistakes. On business quality alone, ADSK deserves to stay on the serious watchlist.
The key issue is not whether this is a good business. It is whether today's price gives a business owner enough protection if the next few years are merely good rather than great. At roughly 30x earnings, the valuation is no longer extreme, but it still assumes durability and competent growth. That is acceptable for a wonderful business, but not automatically attractive for a value investor who wants a margin of safety. Buffett-style investing requires discipline precisely when a company is easiest to admire.
The selective contrarian question is: what is the market missing? Right now, I do not think the market is broadly missing Autodesk's quality. That is well understood. The more interesting question is whether the market is underestimating the possibility of a slower, more ordinary future: steady but unspectacular growth, some pressure from AI-enabled workflow changes, more interoperability reducing lock-in, and cyclical caution in construction and manufacturing budgets. None of those would break the business, but they could compress the multiple. For a 30x stock, that matters a great deal.
On the other hand, the crowd may also be too focused on near-term chart weakness and not enough on long-duration earnings power. If Autodesk continues to deepen cloud adoption, improves monetization around collaboration and AI, and maintains renewal strength, then a temporary bearish trend in the stock may eventually look like noise rather than signal. That is the contrarian opportunity worth monitoring. But contrarian investing is not about buying simply because a chart looks weak. It is about buying when the market's fear creates a clear disconnect from intrinsic value. I do not yet see that disconnect clearly enough.
The prior lesson is important: do not let admiration for a high-quality software franchise weaken price discipline. A bearish primary trend and only partial valuation support are not conditions for eagerness. The stock may become compelling if either: 1. the valuation falls to a level that builds a real margin of safety, or 2. the company proves through the next few quarters that growth, cash conversion, and moat reinforcement are stronger than the market fears.
What I would watch most closely: - Revenue growth quality, not just headline growth - Free cash flow conversion and true owner earnings - Renewal rates, pricing power, and seat expansion - Whether AI/cloud improves customer lock-in or slowly commoditizes parts of the workflow - SBC and buyback discipline - End-market resilience in AEC and manufacturing
In plain terms: this is a very good business, but still not obviously a cheap stock. If sentiment gets materially worse while fundamentals remain intact, that could create the kind of entry a value investor wants. Until then, patience is more rational than enthusiasm.
ANALYST STANCE: WATCH
Autodesk is a high-quality franchise with durable economics and real long-term compounding potential, but the current valuation still does not offer a strong enough margin of safety for a Buffett-style commitment. The market's caution is not yet irrational enough to create a clear contrarian bargain. Monitor closely, but wait for either a cheaper price or stronger proof that growth and moat reinforcement justify paying up.
Deep Values Commentary#
The Risk Management Team debates and the Risk Judge provides the final action-free verdict. This section determines the final ADVOCATE / WATCH / AVOID stance.
Final Stance Scorecard#
This scorecard converts the final research view into a weighted decision frame. It does not replace the narrative judgement, but it makes the main drivers of the verdict easier to scan.
| Criterion | Score | Weight | Commentary |
|---|---|---|---|
| Business Quality | 4.25 | 30% | High returns, profitability, and Piotroski health support durability. |
| Valuation Support | 2.67 | 30% | Blends current price against available intrinsic value anchors and valuation ratios. |
| Financial Strength | 2.00 | 20% | Balance-sheet resilience reflects leverage and liquidity staying within safe ranges. |
| Growth Durability | 3.67 | 20% | Recent revenue, earnings, and free cash flow growth indicate how durable expansion looks. |
| TOTAL / FINAL STANCE | 3.21 | 100% | WATCH |
Key Takeaways#
The weighted score lands at 3.21 / 5.0, while the final stance remains WATCH. This is useful as a quick calibration aid rather than a mechanical signal.
Risk Summary#
Higher scores indicate more risk pressure. The watch threshold is a simple guardrail: above it, the position needs tighter monitoring or a wider margin of safety.
| Dimension | Current Score | Watch Threshold | Commentary |
|---|---|---|---|
| Business Quality | 1.75 | 3.00 | High returns, profitability, and Piotroski health support durability. |
| Valuation Support | 3.33 | 3.00 | Blends current price against available intrinsic value anchors and valuation ratios. |
| Financial Strength | 4.00 | 3.00 | Balance-sheet resilience reflects leverage and liquidity staying within safe ranges. |
| Growth Durability | 2.33 | 3.00 | Recent revenue, earnings, and free cash flow growth indicate how durable expansion looks. |
Key Takeaways#
This view helps readers separate where the risk sits: valuation, business quality, balance sheet, or growth durability. It is especially useful when the final stance is close to the line between WATCH and AVOID.
Frequently asked questions
Is Autodesk, Inc. overvalued according to DeepValues Research?
The Jul 14, 2026 report is Neutral (WATCH, score 3.21/5) on Autodesk, Inc. (ADSK): it calls the shares neither clearly undervalued nor clearly overvalued; the intrinsic-value range is in the report's valuation section. The report's intrinsic-value models give a range rather than one number; this is educational research, not investment advice.
What is DeepValues Research's stance on ADSK?
Neutral (WATCH, score 3.21/5) as of Jul 14, 2026. DeepValues stances are ADVOCATE (bullish), WATCH (neutral) or AVOID (bearish), with a weighted 0-5 scorecard; each report is a dated snapshot.
Where is the full Autodesk, Inc. analysis?
The full report is at https://research.deepvalues.ai/company/adsk/2026-07-14-en/ (markdown twin: https://research.deepvalues.ai/company/adsk/2026-07-14-en/index.md); all Autodesk, Inc. reports are at https://research.deepvalues.ai/company/adsk/. Live fundamentals and intrinsic values for ADSK are in the DeepValues app (https://deepvalues.ai) and the DeepValues API (https://app.deepvalues.ai/developers).