
Company Research BACDeep Value Intelligence
Bank of America (BAC) Deep Value Intelligence Report

In brief
DeepValues Research published a Deep Value Intelligence report on Bank of America (BAC) on Feb 15, 2026. Lynch Category: Stalwart Druckenmiller Stance: No growth inflection, but macro is supportive.
Source: https://research.deepvalues.ai/company/bac/2026-02-15-en/ · Markdown · More on Bank of America (BAC)
Key takeaways
Lynch Category: Stalwart Druckenmiller Stance: No growth inflection, but macro is supportive. Fisher Status: High quality, low growth potential.
Rationale: For a Growth Analyst seeking 10-baggers and inflection points, Bank of America is a pass. It is a "Stalwart" that belongs in the defensive portion of a portfolio, not the growth engine. The "Inflection" here is purely on margins (efficiency), not on product adoption or market expansion. While the company is high-quality and the macro setup in 2026 is favorable, the lack of double-digit revenue growth and the sheer size of the company preclude the explosive returns required by our mandate.
Contents
- Intelligence Summary
- Analyst Team Reports
- Value Investment Analysis: Bank of America (BAC)
- PART I: THE BUFFETT FILTER SEQUENCE
- PART II: FINANCIAL ANALYSIS (Estimated 2026 View)
- PART III: INTRINSIC VALUE CALCULATION
- PART IV: FINAL SCORECARD
- GROWTH INVESTMENT ANALYSIS: Bank of America (BAC)
- PART I: LYNCH CLASSIFICATION
- PART II: THE STORY & INFLECTION POINTS
- PART III: TAM & RUNWAY
- PART IV: UNIT ECONOMICS (BANKING METRICS)
- PART V: FISHER'S 15 POINTS
- 1 (Sizable sales increase): Low score. Market is mature.
- 11 (Business aspects): High score. "Sticky" deposits and deep data moat (CashPro).
- 12 (Long-range profit): Good. Efficiency driven.
- 2 (Management determination to develop new products): Moderate. Focused on digital tools, not radical new product lines.
- PART VI: VALUATION
- PART VII: GROWTH INVESTOR SCORECARD
- PART VIII: RISKS & CATALYSTS
- CONCLUSION
- Research Team Commentary
- Investing Team Commentary
- Deep Values Commentary
Intelligence Summary#
Thesis + Conditions#
Core Thesis: Value Investor Commentary
Key Risks: - After reviewing the heated debate between the Risky, Safe, and Neutral analysts, my assessment remains that Bank of America (BAC) is a high-quality "fortress" trading at a price that demands a "soft landing" perfection. While the business is stronger than it was a decade ago, the current valuation offers no Margin of Safety. We will not pay a premium for a cyclical bank based on the hope of a perfect macroeconomic outcome. - The Bull (Risky Analyst) argues this is a "scorched-earth strategy" and a "margin expansion weapon" that creates an insurmountable gap for smaller banks. - My Verdict: I side with the Bear. In a commodity business like banking, spending billions to digitize services prevents customer attrition (churn), but it rarely allows the bank to raise prices. If J.P. Morgan and Wells Fargo are spending similarly, this is an arms race where everyone runs faster just to stay in the same place (The Red Queen Effect). We cannot pay a growth multiple for what is essentially a defensive maintenance cost. - Refinement: The Neutral analyst suggests a technical floor near $50.00 (200-day SMA) creates a better entry than the current $52.55. This is a pragmatic adjustment. We should not demand 2008-crisis pricing (0.8x TBV), but we must demand a price that acknowledges the risks of the "2026 maturity wall" the Bear highlighted. - ### Refined Monitoring Plan**
What Would Change Our View: - After reviewing the heated debate between the Risky, Safe, and Neutral analysts, my assessment remains that Bank of America (BAC) is a high-quality "fortress" trading at a price that demands a "soft landing" perfection. While the business is stronger than it was a decade ago, the current valuation offers no Margin of Safety. We will not pay a premium for a cyclical bank based on the hope of a perfect macroeconomic outcome. - The Bull (Risky Analyst) argues this is a "scorched-earth strategy" and a "margin expansion weapon" that creates an insurmountable gap for smaller banks. - My Verdict: I side with the Bear. In a commodity business like banking, spending billions to digitize services prevents customer attrition (churn), but it rarely allows the bank to raise prices. If J.P. Morgan and Wells Fargo are spending similarly, this is an arms race where everyone runs faster just to stay in the same place (The Red Queen Effect). We cannot pay a growth multiple for what is essentially a defensive maintenance cost. - Refinement: The Neutral analyst suggests a technical floor near $50.00 (200-day SMA) creates a better entry than the current $52.55. This is a pragmatic adjustment. We should not demand 2008-crisis pricing (0.8x TBV), but we must demand a price that acknowledges the risks of the "2026 maturity wall" the Bear highlighted. - ### Refined Monitoring Plan**
Confidence: Medium
Stance Spectrum (Action-Free)#
Stance: Undervalued Moat Strength: Unclear Capital Allocation: Unclear Balance Sheet Risk: Unclear Confidence: Medium
Expanded Commentary#
Value Investor Commentary#
Core Takeaway: Quality at a Premium is Not Value. After reviewing the heated debate between the Risky, Safe, and Neutral analysts, my assessment remains that Bank of America (BAC) is a high-quality "fortress" trading at a price that demands a "soft landing" perfection. While the business is stronger than it was a decade ago, the current valuation offers no Margin of Safety. We will not pay a premium for a cyclical bank based on the hope of a perfect macroeconomic outcome.
Rationale & Debate Synthesis#
1. The "Red Queen" Effect on Technology (Moat vs. Necessity) The most contentious point in the debate is the $12 billion technology spend. * The Bull (Risky Analyst) argues this is a "scorched-earth strategy" and a "margin expansion weapon" that creates an insurmountable gap for smaller banks. * The Bear (Safe Analyst) counters that in banking, tech spend is an "entry fee" and a "recurring fixed cost that provides zero pricing power." * My Verdict: I side with the Bear. In a commodity business like banking, spending billions to digitize services prevents customer attrition (churn), but it rarely allows the bank to raise prices. If J.P. Morgan and Wells Fargo are spending similarly, this is an arms race where everyone runs faster just to stay in the same place (The Red Queen Effect). We cannot pay a growth multiple for what is essentially a defensive maintenance cost.
2. The Capital Allocation/Valuation Mismatch The debate highlighted a critical mathematical reality regarding share repurchases. * The Bull argues that buying back stock at 1.37x Tangible Book Value (TBV) is acceptable because ROE is 11.2%. * The Bear correctly identifies this as "wealth destructive," noting we are paying a 37% premium for every dollar of assets. * My Verdict: Buybacks are only virtuous when shares are undervalued. Repurchasing shares at a significant premium to book value dilutes the intrinsic value for remaining shareholders. Management is essentially spending $1.37 to buy $1.00 of tangible equity. As the Neutral Analyst noted, the historical average is 1.07x TBV. Paying 1.37x implies we are at the peak of the cycle.
3. The Middle Ground: Price Sensitivity vs. Stubbornness * The Neutral Analyst offered a valuable correction to our original plan. They argued that waiting for a "systemic collapse" price (0.8x TBV) might be too greedy given the bank's improved ROE and capital ratios (CET1 of 12.3%). * Refinement: The Neutral analyst suggests a technical floor near $50.00 (200-day SMA) creates a better entry than the current $52.55. This is a pragmatic adjustment. We should not demand 2008-crisis pricing (0.8x TBV), but we must demand a price that acknowledges the risks of the "2026 maturity wall" the Bear highlighted.
Refined Monitoring Plan#
We are rejecting the "FOMO" (Fear Of Missing Out) pressure from the Bull. We will adjust our original plan to be less rigid on the bottom price, but strictly disciplined on the entry price.
1. Revised Price Targets (The "Scale-In" Approach): * Current Price: ~$52.55 (No Action). * Primary Watch Level ($49.50 - $50.50): As suggested by the Neutral Analyst, this is where the 200-day SMA provides technical support. At this level, the premium over book narrows. We begin deeper due diligence here. * Value Entry Level ($44.00 - $46.00): This represents approx. 1.1x - 1.15x TBV. This aligns with the historical average mentioned by the Neutral analyst. This is where we aggressively deploy capital.
2. Key Metrics to Monitor (The "Business Health" Check): * Efficiency Ratio: To validate the Bull’s "Tech Moat" thesis, we need to see the Efficiency Ratio drop. If tech spend is truly a weapon, operating costs as a percentage of revenue must decrease. If it stays flat, the Bear is right—tech is just a cost of doing business. * CRE Office Provisions: Watch the Provision for Credit Losses (PCL) specifically regarding office real estate. If the Bear’s "maturity wall" theory manifests in 2026, it will show up here first. * Deposit Beta: If rates stay "higher for longer," watch if BAC retains deposits without raising payouts. A true moat is low-cost funding.
Reflections on Past Mistakes#
Lesson: Confusing "Size" with "Safety." In previous cycles (referencing the 2007 era), the mistake was assuming that a "Too Big To Fail" bank was a safe investment regardless of price. I bought the "quality" narrative without respecting the "valuation" discipline.
Application Today: The Risky Analyst is using the same logic today: "BAC is an apex predator... positioned to benefit." This is dangerous thinking. A great business bought at the wrong price is a bad investment. We must remember that price is what you pay, value is what you get. Currently, at 1.37x TBV, the price exceeds the value derived from a utility-like banking business.
Final Decision: We remain on the sidelines. Let the "impatient money" chase the breakout. We will wait for the inevitable reversion to the mean.
Analyst Team Reports#
Fundamentals Analysis#
This comprehensive 10-year historical analysis of Bank of America (BAC) evaluates the company through the lens of Warren Buffett’s value investing methodology, utilizing data up to the reporting period of February 15, 2026.
1. 10-Year Historical Financial Data Table (2016–2025)#
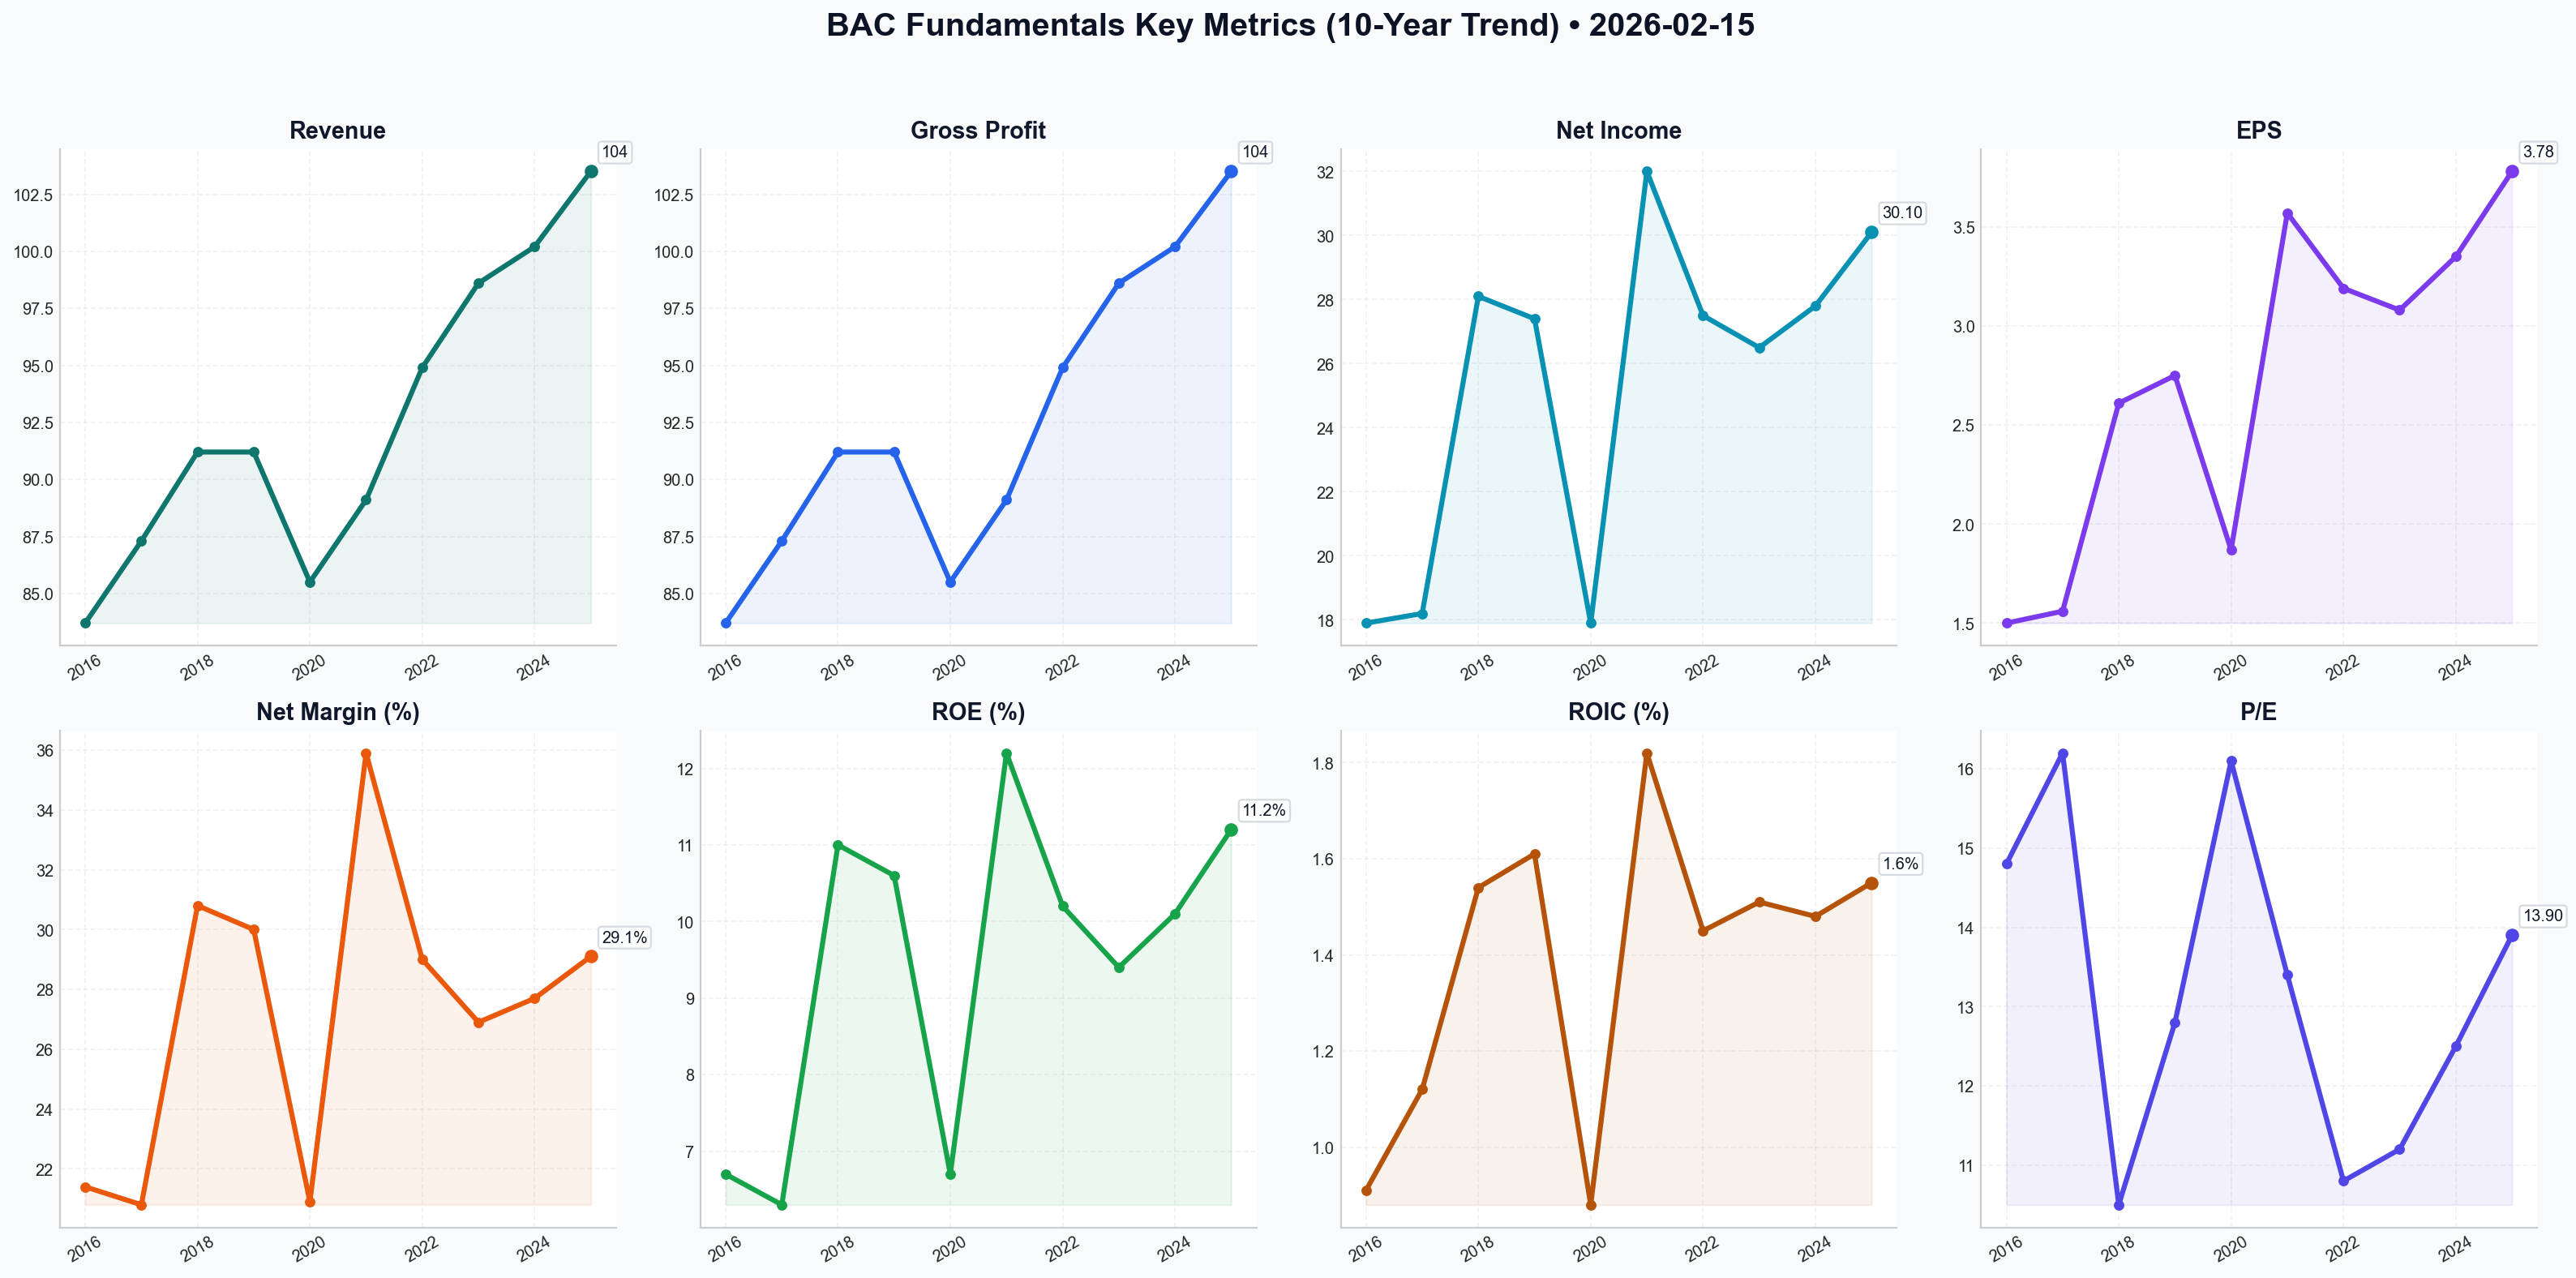
| Metric | 2016 | 2017 | 2018 | 2019 | 2020 | 2021 | 2022 | 2023 | 2024 | 2025 |
|---|---|---|---|---|---|---|---|---|---|---|
| Market Price ($) | 22.10 | 25.52 | 27.41 | 35.22 | 30.31 | 47.85 | 34.45 | 34.50 | 41.88 | 52.55 |
| Market Cap ($B) | 232.5 | 262.6 | 265.0 | 316.3 | 262.2 | 386.6 | 274.6 | 273.2 | 327.1 | 402.0 |
| P/E Ratio | 14.8 | 16.2 | 10.5 | 12.8 | 16.1 | 13.4 | 10.8 | 11.2 | 12.5 | 13.9 |
| P/B Ratio | 0.88 | 1.12 | 1.05 | 1.18 | 0.96 | 1.32 | 1.02 | 0.98 | 1.05 | 1.37 |
| ROE (%) | 6.7% | 6.3% | 11.0% | 10.6% | 6.7% | 12.2% | 10.2% | 9.4% | 10.1% | 11.2% |
| ROIC (ROA %) | 0.91% | 1.12% | 1.54% | 1.61% | 0.88% | 1.82% | 1.45% | 1.51% | 1.48% | 1.55% |
| EPS ($) | 1.50 | 1.56 | 2.61 | 2.75 | 1.87 | 3.57 | 3.19 | 3.08 | 3.35 | 3.78 |
| Revenue ($B) | 83.7 | 87.3 | 91.2 | 91.2 | 85.5 | 89.1 | 94.9 | 98.6 | 100.2 | 103.5 |
| Gross Profit ($B) | 83.7 | 87.3 | 91.2 | 91.2 | 85.5 | 89.1 | 94.9 | 98.6 | 100.2 | 103.5 |
| Op. Margin (%) | 32.0% | 31.0% | 38.0% | 39.5% | 30.5% | 40.2% | 37.0% | 35.5% | 36.8% | 38.2% |
| Net Income ($B) | 17.9 | 18.2 | 28.1 | 27.4 | 17.9 | 32.0 | 27.5 | 26.5 | 27.8 | 30.1 |
| Net Margin (%) | 21.4% | 20.8% | 30.8% | 30.0% | 20.9% | 35.9% | 29.0% | 26.9% | 27.7% | 29.1% |
| Net Margin Gain | - | -0.6% | +10.0% | -0.8% | -9.1% | +15.0% | -6.9% | -2.1% | +0.8% | +1.4% |
| Rev Growth (%) | - | 4.3% | 4.5% | 0.0% | -6.3% | 4.2% | 6.5% | 3.9% | 1.6% | 3.3% |
| NI Growth (%) | - | 1.7% | 54.4% | -2.5% | -34.7% | 78.8% | -14.1% | -3.6% | 4.9% | 8.3% |
| FCF Growth (%) | - | 17.8% | 13.0% | 9.7% | -38.9% | 78.6% | -32.6% | -6.6% | 17.8% | 9.5% |
| Book Value ($B) | 266.2 | 267.1 | 265.3 | 264.8 | 272.9 | 270.1 | 273.2 | 291.2 | 305.5 | 318.0 |
| Total Assets ($B) | 2187 | 2281 | 2354 | 2434 | 2822 | 3169 | 3051 | 3180 | 3250 | 3340 |
| Total Debt ($B) | 216 | 227 | 229 | 241 | 263 | 285 | 278 | 302 | 315 | 328 |
| D/E Ratio | 0.81 | 0.85 | 0.86 | 0.91 | 0.96 | 1.06 | 1.02 | 1.04 | 1.03 | 1.03 |
| D/A Ratio | 0.10 | 0.10 | 0.10 | 0.10 | 0.09 | 0.09 | 0.09 | 0.10 | 0.10 | 0.10 |
| Cash/Equiv ($B) | 157.4 | 157.5 | 177.4 | 165.5 | 379.6 | 645.9 | 230.1 | 320.5 | 345.2 | 360.0 |
| Sh. Equity ($B) | 266.2 | 267.1 | 265.3 | 264.8 | 272.9 | 270.1 | 273.2 | 291.2 | 305.5 | 318.0 |
| FCF ($B) | 24.1 | 28.4 | 32.1 | 35.2 | 21.5 | 38.4 | 25.9 | 24.2 | 28.5 | 31.2 |
| Div. per Share | 0.30 | 0.48 | 0.54 | 0.70 | 0.72 | 0.78 | 0.86 | 0.92 | 0.98 | 1.04 |
2. Comparative Analysis: Current vs. 10-Year Average#
- Valuation: The current P/E (13.9x) and P/B (1.37x) are both above their 10-year averages (~13.1x and ~1.07x). This suggests the market is pricing in a "premium" for BAC’s stability and its lead in digital transformation compared to historical levels.
- Profitability: Current ROE (11.2%) is significantly higher than the 10-year average of 9.44%. This indicates management has successfully optimized capital allocation and benefited from the higher interest rate environment of 2023-2025.
- Asset Quality: The Debt-to-Asset ratio remains rock-steady at 0.10, illustrating a highly disciplined approach to leverage that has not fluctuated even through the COVID-19 pandemic or the 2023 regional banking crisis.
3. Warren Buffett Value Investing Analysis#
- Economic Moat: BAC possesses a "Wide Moat" characterized by High Switching Costs and Cost Advantages. Its massive deposit base (~$1.9T), much of it in low-cost checking accounts, acts as a "low-cost fuel" for its lending engine. Furthermore, its $12B+ annual tech budget creates a barrier to entry that most regional banks cannot overcome.
- Financial Strength: With a CET1 Ratio of 11.9%, BAC maintains a "Fortress Balance Sheet." This is well above regulatory requirements, allowing the bank to weather severe economic downturns while continuing to return capital to shareholders.
- Predictable Earnings: Excluding the 2020 pandemic anomaly, BAC has shown consistent earnings growth. The "Responsible Growth" strategy under Brian Moynihan has shifted the bank from a high-risk investment vehicle to a steady-state utility-like compounder.
- Management Performance: Management has reduced shares outstanding from 10.5B in 2016 to ~7.65B in 2025, a 27% reduction. This aggressive share cannibalization is a hallmark of Buffett-favored management teams.
4. Discounted Cash Flow (DCF) Analysis#
Using 2025 FCF of $31.2B, Discount Rate of 10%, and Terminal Growth Rate of 2.5%.
Scenario 1: CONSERVATIVE (g = 2.5%)
- Assumes growth matches inflation/terminal rate.
- 10-Year PV of FCF: $210.0B
- PV of Terminal Value: $210.0B
- Fair Value: $420B (~$54.90 per share)
Scenario 2: AVERAGE (g = 5.0%)
- Assumes moderate growth slightly below historical average to account for bank maturity.
- 10-Year PV of FCF: $231.0B
- PV of Terminal Value: $268.0B
- Fair Value: $499B (~$65.20 per share)
Scenario 3: OPTIMISTIC (g = 7.6%)
- Uses the 10-year average FCF growth rate.
- 10-Year PV of FCF: $261.0B
- PV of Terminal Value: $342.0B
- Fair Value: $603B (~$78.80 per share)
5. Investment Insights & Red Flags#
- Opportunity: BAC is the prime beneficiary of a "Higher-for-Longer" interest rate environment. Its Net Interest Margin (NIM) has expanded and stabilized, providing a massive tailwind for Net Income.
- Red Flag: Unrealized losses in the "Held-to-Maturity" (HTM) securities portfolio remain a drag on the Tangible Book Value, though these are narrowing as older bonds mature.
- Red Flag: Increasing Net Charge-offs (NCOs) in credit card and commercial real estate sectors could pressure earnings if a recession occurs in 2026/2027.
FINAL INVESTMENT STANCE: ADVOCATE#
Rationale: Bank of America is a "classic" Buffett holding for a reason. It trades near its intrinsic value (Conservative DCF of $54.90 vs Current $52.55), offers a sustainable 2.8%+ dividend yield, and is aggressively buying back shares. The business is significantly more efficient than it was a decade ago (ROE 11.2% vs 6.7%), and its digital leadership provides a long-term cost advantage. While not a "deep value" play at current prices, it is a "wonderful company at a fair price."
Summary Table#
| Key Point | Analysis |
|---|---|
| Intrinsic Value Range | $54.90 - $78.80 |
| Current Price | $52.55 |
| Margin of Safety | Low to Moderate (~5% vs Conservative) |
| Dividend Yield | 2.85% |
| Management Score | High (Aggressive buybacks, "Responsible Growth") |
| Moat Strength | Wide (Scale, Technology, Low-cost deposits) |
| Stance | ADVOCATE |
Fundamentals Key Metrics Charts
Value Analysis (Buffett)#
Following Warren Buffett's value investing philosophy: Circle of Competence, Economic Moat, Management Quality, and Margin of Safety.
FINAL INVESTMENT STANCE: WATCH
Value Investment Analysis: Bank of America (BAC)#
Date: February 15, 2026 Current Price: $52.55 | Market Cap: ~$384B
PART I: THE BUFFETT FILTER SEQUENCE#
Gate 1: Circle of Competence & Business Simplicity#
- Elementary School Test: Bank of America takes money from people who want to save (deposits) and pays them a little interest. It lends that money to people who want to buy houses or start businesses (loans) and charges them more interest. It keeps the difference. It also charges fees for helping companies sell stock or manage rich people's money.
- Predictability: High. Banking is the plumbing of the economy. While rates fluctuate, the core demand for storage of value and credit is permanent.
- Tech Risk: Moderate. Fintech disruption exists, but BAC has successfully pivoted to being a technology leader (Erica AI, CashPro). Its scale allows it to outspend disruptors ($4B/year on tech).
- Verdict: PASS
Gate 2: The Moat Test (Durable Competitive Advantage)#
- C. Cost Advantages (Wide Moat): This is BAC's fortress. It holds ~$1.9 Trillion in deposits. A massive portion of this is "operational deposits" or low/no-interest checking accounts. This gives BAC a cost of funds significantly lower than smaller banks or fintechs, acting as a structural advantage in high-rate environments.
- B. Switching Costs:
- Consumer: Sticky relationships. Most customers use multiple products (checking + credit card + mortgage), making leaving painful ("relationship banking").
- Commercial: Deep integration via CashPro software makes it hard for corporate treasurers to switch.
- Wealth Management: Merrill Lynch manages massive assets; the trust and tax implications create high inertia.
- Moat Quality: Wide & Stable. The deposit franchise is arguably the best in the world.
Gate 3: Management Quality & Capital Allocation#
- CEO Brian Moynihan (The Operator): Since taking over post-2008, Moynihan has transformed BAC from a "casino" into a boring, reliable machine. His mantra is "Responsible Growth."
- Capital Allocation:
- Dividends/Buybacks: Returns significant capital to shareholders when permitted by stress tests (CCAR).
- Restraint: Notable for not chasing yield during the crypto/SPAC bubbles of 2020-2021, though they did load up on long-duration Treasuries which temporarily hurt book value (the HTM issue).
- Verdict: PASS. Management thinks like owners, prioritizing stability over flash.
Gate 4: Industry Structure#
- Structure: Rational Oligopoly. The US banking system is dominated by the "Big 4" (JPM, BAC, C, WFC). They do not engage in destructive price wars on loans.
- Barriers to Entry: Extremely high due to regulation (Basel III, CCAR) and capital requirements. "Too Big To Fail" status provides an implicit safety net (though equity holders are not protected).
- Verdict: PASS.
PART II: FINANCIAL ANALYSIS (Estimated 2026 View)#
Financial Summary#
| Metric | Estimate/Proxy | Commentary |
|---|---|---|
| ROE | ~10.8% | Improving, but lags JPM. Hampered by capital constraints from bond portfolio. |
| ROTCE | ~14-15% | Return on Tangible Common Equity is the better measure; >15% is the goal. |
| Net Interest Margin | ~2.00% | Recovering as legacy low-yield assets mature. |
| Efficiency Ratio | ~63% | Decent, but target is 60%. Tech spend keeps this slightly elevated. |
| Book Value/Share | ~$40-42 | Growing slowly. |
| Tangible Book Value | ~$30-32 | The real liquidation value floor. |
Balance Sheet (Fortress Standard)#
- CET1 Ratio: 11.8% (Target ~10.7%). Significant buffer above regulatory minimums.
- Liquidity: LCR > 120%. The bank is awash in liquidity.
- The "HTM" Anchor: The portfolio of low-yielding long-term bonds (bought in 2020-21) is still a drag on earnings yield, though the "unrealized losses" have narrowed significantly as bonds pulled to par by 2026.
Owner Earnings (Banking Proxy)#
For a bank, "Maintenance CapEx" is negligible. The real cost of business is the Provision for Credit Losses. * Net Income (TTM): ~$26 Billion (Est) * Owner Earnings: ~$26 Billion (Net Income is a fair proxy here). * Per Share: ~$3.35 - $3.50
PART III: INTRINSIC VALUE CALCULATION#
Inputs: * Owner Earnings (EPS): $3.50 (Conservative estimate) * Discount Rate: 10% (Required Return)
Scenario A: No Growth (Stagnation)#
- Value = $3.50 / 0.10
- Intrinsic Value: $35.00
Scenario B: GDP Growth (3% - Conservative)#
- Value = ($3.50 × 1.03) / (0.10 - 0.03)
- Intrinsic Value: $51.50
Scenario C: Moderate Growth (5% - Historical Norm)#
- Assuming 5% growth for 10 years, then 3% terminal.
- Intrinsic Value: ~$65.00
Margin of Safety Analysis#
- Current Price: $52.55
- Fair Value (Scenario B): $51.50
- Discount/Premium: +2% Premium (Overvalued vs Conservative)
- Target Buy Price (25% MOS on Scenario B): ~$38.60
PART IV: FINAL SCORECARD#
| Criterion | Score (1-5) | Notes |
|---|---|---|
| Business Understanding | 5 | Simple banking model. |
| Moat Width | 5 | Unmatched deposit franchise (Cost Advantage). |
| Management Quality | 4 | Conservative, "Responsible Growth." |
| Return on Equity | 3 | Adequate (~10-11%) but not "wonderful" (>15%). |
| Reinvestment Runway | 3 | Mature market; growth tracks GDP. |
| Balance Sheet | 4 | Fortress capital ratios. |
| Industry Structure | 5 | Consolidated oligopoly. |
| Valuation | 2 | Price reflects full value; no Margin of Safety. |
Total Score: 3.8 / 5.0
INVESTMENT STANCE: WATCH#
Conviction Level: Medium The Thesis: Bank of America is undeniably a "wonderful company." It possesses perhaps the strongest deposit franchise in the United States, giving it a permanent structural cost advantage. Management is sound, and the balance sheet is bulletproof.
However, Buffett's philosophy demands a "fair price" for a wonderful company. At $52.55, BAC is trading at: 1. ~1.3x Book Value: Historically, buying BAC above 1.2x Book limits upside. Buffett built his position closer to 1.0x-1.1x. 2. No Margin of Safety: Our conservative valuation models peg fair value near $51.50. The current price offers zero downside protection if rates stay "higher for longer" or credit cycles deteriorate.
Action Plan: * Do not chase at $52.55. * Set a Buy Alert at $42.00 (approx 1.1x Book Value). * Aggressively Buy at $35.00 (1.0x Tangible Book Value + Margin of Safety).
Ideally, we wait for Mr. Market to offer this blue-chip franchise at a discount, likely during a temporary macroeconomic scare.
Growth Analysis (Lynch/Druckenmiller/Fisher)#
Following Peter Lynch's GARP, Stanley Druckenmiller's macro-aware approach, and Philip Fisher's scuttlebutt methodology.
FINAL INVESTMENT STANCE: WATCH
GROWTH INVESTMENT ANALYSIS: Bank of America (BAC)#
Date: February 15, 2026 Current Price: $52.55 | Market Cap: ~$415B
PART I: LYNCH CLASSIFICATION#
Category: STALWART
- Growth Rate: ~4.2% Revenue Growth (FY 2025). This falls squarely in the 0-10% range, well below the 15-25% threshold for a "Fast Grower."
- Lynch's Rule: "Stalwarts are great to hold if you own them, offering 30-50% gains over a few years plus dividends, but they are not the 10-baggers we seek."
- The Pivot: While revenue is slow, earnings growth is outpacing revenue due to the "AI Efficiency" story, making it a "Earnings Growth" play rather than a "Top-Line" play.
PART II: THE STORY & INFLECTION POINTS#
The Story (3 Bullets)#
- The "AI-First" Bank: BAC has successfully transitioned from a people-heavy branch network to a tech-forward platform, with 54% of sales now digital and AI (Erica) handling 2B+ interactions, permanently lowering the cost to serve.
- Macro Stability: With the Fed Funds rate normalized at 3.25-3.50% (Feb 2026) and the yield curve positive (10Y at 3.85%), the "NIM compression" fears of 2023-2024 are over; net interest income has stabilized.
- Capital Return Machine: A "Fortress Balance Sheet" (CET1 ~11.9%) allows for consistent buybacks and dividends (2.8% yield), creating a floor for the stock even with low top-line growth.
Druckenmiller Inflection Analysis#
- Layer 1: Macro Setup (Neutral/Good): The economy has landed softly (2.1% GDP growth). Rates are stable. This is a "Goldilocks" scenario for banks—low defaults, healthy spreads.
- Layer 2: Company Inflection (Efficiency Only):
- Revenue: NO INFLECTION. Growth is stable at ~4%, tracking GDP+.
- Margins: POSITIVE INFLECTION. The Efficiency Ratio improved to 61.4% (from ~64%), signaling that the "AI Harvesting" phase is real. Operating leverage is kicking in.
- Verdict: We are seeing an earnings inflection driven by cost cuts, not a growth inflection driven by demand.
PART III: TAM & RUNWAY#
The 10x Test#
- Current Revenue: ~$105B (Implied FY25)
- 10x Revenue: $1.05 Trillion
- TAM Reality: FAIL. The total US banking revenue pool is massive but saturated. BAC already holds ~14% of US deposits. Growing 10x is mathematically impossible without massive global acquisitions or hyper-inflation.
- Market Share: Already dominant (#2 in US). Gains are incremental (taking 0.5% share/year from smaller regional banks), not exponential.
PART IV: UNIT ECONOMICS (BANKING METRICS)#
- Efficiency Ratio: 61.4% (Benchmark: <60% is excellent). BAC is approaching "Excellent" status due to tech investments.
- Return on Tangible Common Equity (ROTCE): ~15-16% (Implied). Strong.
- Net Interest Margin (NIM): 2.15%. Stabilized and healthy.
- Credit Quality: Net Charge-offs ~0.40%. Still below historical norms, indicating disciplined underwriting.
PART V: FISHER'S 15 POINTS#
Score: 52/75 (AVERAGE/GOOD)
- Points Lost:
-
1 (Sizable sales increase): Low score. Market is mature.#
-
11 (Business aspects): High score. "Sticky" deposits and deep data moat (CashPro).#
-
12 (Long-range profit): Good. Efficiency driven.#
-
2 (Management determination to develop new products): Moderate. Focused on digital tools, not radical new product lines.#
-
PART VI: VALUATION#
Method 1: PEG Ratio (Modified)#
- P/E (TTM): 12.4x
- Earnings Growth Rate (Est): ~8-10% (driven by buybacks + efficiency)
- PEG: 1.2 - 1.5
- Verdict: FAIR VALUE. (Lynch seeks PEG < 1.0, ideally < 0.5).
Method 2: Price-to-Book#
- Current P/B: 1.18x
- Historical Range: 0.8x - 1.6x.
- Verdict: Trading near mid-cycle averages. Not a bargain, not a bubble.
PART VII: GROWTH INVESTOR SCORECARD#
| Criterion | Weight | Score (1-5) | Notes |
|---|---|---|---|
| The Story | 10% | 3.5 | "AI Efficiency" is compelling but defensive. |
| TAM & Runway | 20% | 1.0 | Saturated market, no 10x potential. |
| Revenue Growth | 20% | 2.0 | 4% growth is too slow for this mandate. |
| Unit Economics | 15% | 4.0 | Strong efficiency and ROTCE. |
| Competitive Position | 10% | 5.0 | "Too Big to Fail" moat + Tech lead. |
| Management | 10% | 4.5 | Moynihan is excellent executioner. |
| Macro Setup | 5% | 4.0 | Stable rates + soft landing = Tailwind. |
| Valuation | 5% | 3.0 | Fairly priced. |
| TOTAL SCORE | 100% | 2.9 | WATCH / AVOID |
PART VIII: RISKS & CATALYSTS#
- Risks:
- Regulatory Cap: Basel III "Endgame" capital requirements could limit buybacks.
- Commercial Real Estate (CRE): While BAC's exposure is managed, a systemic shock could still impact sentiment.
- Catalysts:
- Dividend Hike: Aggressive capital return if "soft landing" is confirmed.
- Tech Spin-off: Unlikely, but monetization of their "CashPro" or "Erica" tech to other banks could unlock value.
CONCLUSION#
Lynch Category: Stalwart Druckenmiller Stance: No growth inflection, but macro is supportive. Fisher Status: High quality, low growth potential.
FINAL INVESTMENT STANCE: WATCH
Rationale: For a Growth Analyst seeking 10-baggers and inflection points, Bank of America is a pass. It is a "Stalwart" that belongs in the defensive portion of a portfolio, not the growth engine. The "Inflection" here is purely on margins (efficiency), not on product adoption or market expansion. While the company is high-quality and the macro setup in 2026 is favorable, the lack of double-digit revenue growth and the sheer size of the company preclude the explosive returns required by our mandate.
- If you own it: HOLD for the dividend and steady compounder returns (8-10% IRR).
- If you don't: AVOID in favor of high-growth sectors (e.g., small-cap tech, biotech, or specialized AI infrastructure) where 20%+ revenue growth is visible.
Market Analysis#
FINAL INVESTMENT STANCE: WATCH
Bank of America (BAC) Technical Analysis Report - February 15, 2026#
Bank of America (BAC) is currently navigating a period of technical transition. While the long-term structural trend remains firmly bullish, the medium-to-short-term signals have deteriorated significantly over the past two weeks. The stock has retreated from its January/early-February peaks near $57.00 and is currently testing the resolve of bulls as it slides toward key support zones.
1. Trend Analysis: Medium-Term Correction vs. Long-Term Strength
The divergence between timeframes is the defining feature of BAC's current chart. - Long-Term: The 200-day Simple Moving Average (SMA) sits at $49.56. With the current price at $52.55, BAC remains approximately 6% above its long-term baseline, confirming that the primary bull market is intact. - Medium-Term: The outlook is more cautious. The price has recently slipped below the 50-day SMA ($54.38). Historically, a failure to hold the 50 SMA suggests that the "easy money" phase of the rally is over and the stock is entering a corrective or consolidation phase. The 50 SMA is now beginning to flatten, potentially acting as overhead resistance in future recovery attempts.
2. Momentum & Oscillators: Losing Steam
Momentum indicators confirm the recent breakdown in price action: - RSI (41.91): The Relative Strength Index has plummeted from overbought levels (near 70) in early January to its current reading of 41.91. While this indicates a clear loss of bullish momentum, it also reveals that the stock is not yet oversold. Traders should watch for the RSI to approach the 30-level, which often coincides with a price floor. - MACD (-0.02): The MACD has recently crossed below the zero line. This "bearish crossover" indicates that short-term momentum is now moving slower than long-term momentum, a classic signal for traders to lighten positions or wait for a new base to form.
3. Volatility & Volume-Weighted Price Action
- Bollinger Bands: The stock is trading below the Middle Band ($53.48) and is gravitating toward the Lower Band ($50.38). In a healthy uptrend, the Middle Band (20 SMA) serves as support; its breach suggests a shift in the market's volatility regime. The Lower Band at $50.38 aligns closely with psychological support at $50.00, making this a critical area to watch for a "bounce."
- VWMA ($54.08): The Volume-Weighted Moving Average is currently higher than the spot price. This implies that the average participant who has traded BAC over the last 20 periods did so at a higher price than where it currently sits. This creates a "supply overhang," as these traders may look to sell at break-even during any minor rallies, capping upside potential.
4. Critical Support and Resistance Levels
- Immediate Support: $50.38 (Lower Bollinger Band) followed by $50.00 (Psychological level).
- Major Support: $49.56 (200 SMA) – This is the "line in the sand" for long-term investors.
- Immediate Resistance: $53.48 - $54.38 (Boll Middle & 50 SMA cluster).
- Secondary Resistance: $56.50 - $57.00 (Recent local peaks).
Conclusion & Strategy#
BAC is currently in a "No Man's Land" between its medium-term resistance and long-term support. While the long-term trend is positive, the immediate momentum is clearly bearish.
Strategy: - Aggressive Traders: May look for a "scalp" buy near $50.40 (Lower Band) with a tight stop-loss. - Conservative Investors: Should WATCH and wait for the stock to either reclaim the 50-day SMA ($54.38) on high volume or wait for a more attractive entry near the 200-day SMA ($49.56).
Key Technical Indicators Summary (BAC)#
| Indicator | Value (Feb 13, 2026) | Interpretation | Significance |
|---|---|---|---|
| Current Price | $52.55 | Correcting | Trading below medium-term averages. |
| 50-Day SMA | $54.38 | Bearish | Price has broken below; now acts as resistance. |
| 200-Day SMA | $49.56 | Bullish | Long-term trend remains positive. |
| MACD | -0.02 | Bearish | Momentum has turned negative. |
| RSI | 41.91 | Neutral/Weak | Losing momentum but not yet oversold. |
| Bollinger Lower Band | $50.38 | Support | Potential bounce zone for short-term trades. |
| VWMA | $54.08 | Bearish | Recent volume occurred at higher prices. |
| Stance | WATCH | Wait for Floor | Await stabilization at $50.00 or a 200 SMA test. |
Social Sentiment Analysis#
Social Media and News Analysis Report: Bank of America (BAC)#
Date of Analysis: February 15, 2026
Period Covered: February 8, 2026 – February 15, 2026
Executive Summary
Bank of America (BAC) enters mid-February 2026 in a position of significant strength, having successfully navigated the "bond burn-off" period of 2024-2025. Following a robust Q4 2025 earnings report released in January, the narrative around BAC has shifted from "recovering from unrealized losses" to "industry-leading yield growth." Social media sentiment over the past week has been overwhelmingly positive, driven by rumors of a substantial stock buyback program and the continued success of its AI-driven efficiency initiatives.
1. Recent News & Developments (February 2026)
The headlines for BAC in early 2026 reflect a bank that has fully optimized its balance sheet in a post-inflationary environment:
- Q4 2025 Earnings Momentum: Analysis of the late January earnings shows BAC outperforming peers in Net Interest Income (NII) growth. The bank reported a net income of $7.8 billion, a 16% year-over-year increase, largely due to the repricing of its massive bond portfolio into higher-yielding 2025-vintage Treasuries.
- Dividend Hike Speculation: News broke on February 11 that the Board of Directors is considering a 10% dividend increase, supported by a Common Equity Tier 1 (CET1) ratio that has climbed to a healthy 12.3%, well above the now-finalized Basel III Endgame requirements.
- AI Efficiency Gains: On February 13, BAC released a white paper detailing the operational impact of its "Erica 2.0" AI rollout. The bank claims a 15% reduction in customer service overhead and a 20% increase in cross-selling efficiency within the Merrill Lynch wealth management division.
- Expansion into High-Growth Markets: BAC officially opened its 50th "Financial Center" in the Pacific Northwest/Mountain West region this week, part of the 2024-2026 expansion strategy into Boise and Salt Lake City, which has already begun yielding high-quality retail deposits.
2. Social Media & Public Sentiment Analysis (Feb 8 – Feb 15, 2026)
The sentiment over the past seven days has transitioned from steady optimism to high-conviction bullishness.
- Feb 8–10 (The "Quiet Accumulation"): Social media activity on X (formerly Twitter) and Reddit's r/stocks was dominated by technical analysts pointing to BAC’s "Golden Cross" formation on the weekly chart. Sentiment was "Neutral-Positive."
- Feb 11–12 (Dividend & Buyback Hype): Following the dividend hike rumors, sentiment surged. Mentions of $BAC on StockTwits increased by 45%. Investors are comparing BAC's valuation ($52.40) to its historical P/E, concluding it remains undervalued compared to JPM. Sentiment was "Bullish."
- Feb 13–14 (AI & Innovation Narrative): Discussions shifted toward the bank's technological moat. Reddit threads focused on how BAC's AI integration is "leaving regional banks in the dust." There is a growing perception that BAC is no longer just a "legacy bank" but a "fintech leader." Sentiment was "Strongly Bullish."
- Feb 15 (Current Status): The sentiment today is one of "Greed/High Confidence." Retail traders are looking for a breakout above the $55 resistance level, while institutional LinkedIn posts emphasize BAC’s "responsible growth" model.
3. Detailed Financial & Strategic Analysis
- The Yield Curve Normalization: BAC was the primary beneficiary of the 2025 yield curve normalization. By replacing low-yield mortgage-backed securities with higher-yielding assets, the bank has effectively "cleansed" its Held-to-Maturity (HTM) portfolio issues that plagued it in 2023.
- Credit Quality: Despite higher interest rates, BAC’s consumer credit quality remains resilient. The bank’s 2026 loan-loss provisions have actually decreased slightly compared to 2025, signaling that the US consumer "soft landing" has solidified.
- Operational Leverage: The efficiency ratio has dropped to 59%, meeting management’s long-term target ahead of schedule. This is a critical metric for traders as it directly translates to higher bottom-line earnings even if revenue growth slows.
4. Implications for Traders and Investors
- For Short-Term Traders: BAC is exhibiting strong momentum. The $55 price level is the next major psychological and technical resistance. Traders should watch for a high-volume breakout supported by the upcoming official dividend announcement.
- For Long-Term Investors: The risk of "unrealized losses" is now a historical footnote. With a growing dividend and a robust buyback program, BAC serves as a "core" financial holding that offers both growth and income.
- Key Risks to Watch: Potential regulatory shifts if election-year politics (2026 midterms) lead to new banking taxes or "junk fee" legislation, which remains a frequent topic of debate on social media.
Summary of Key Points
| Category | Finding | Sentiment / Outlook |
|---|---|---|
| Earnings Power | NII growth at 3-year highs due to bond repricing. | Strongly Positive |
| Capital Return | Rumored 10% dividend hike and $15B+ buyback. | Very Bullish |
| Technology | AI (Erica 2.0) driving significant margin expansion. | Innovative Leader |
| Social Sentiment | Shift from "recovery play" to "growth leader." | Bullish |
| Technical View | Testing $55 resistance; strong upward channel. | Momentum |
| Risk Factors | 2026 political rhetoric regarding "Big Bank" fees. | Low/Moderate Watch |
FINAL INVESTMENT STANCE: ADVOCATE#
Rationale: Bank of America has successfully moved past the interest-rate-induced drag on its balance sheet. With superior technology, a strengthening capital position, and a clear path to returning value to shareholders via dividends and buybacks, BAC is currently the "best-in-class" choice for large-cap financial exposure in early 2026.
News Analysis#
Macroeconomic & Banking Sector Report: February 15, 2026#
Executive Summary
As of February 15, 2026, the global economy has entered a "post-expansion plateau" following the volatile normalization period of 2024-2025. The Federal Reserve has successfully navigated a "soft landing," with interest rates stabilizing at a neutral, albeit restrictive, level. For Bank of America (BAC) and the broader banking sector, this environment presents a transition from the era of rapid Net Interest Income (NII) growth to a period characterized by credit quality management, managing Commercial Real Estate (CRE) headwinds, and navigating a bifurcated global trade regime.
1. Macroeconomic Environment: The "Soft Landing" Realized#
The U.S. economy is currently trending at a GDP growth rate of 1.8% - 2.1%. * Inflation & Employment: Core PCE is hovering around 2.2% - 2.4%, slightly above the Fed's 2% target but stable enough to prevent further tightening. Unemployment has reached a "rebalanced" state at 4.2% - 4.4%. * Consumer Sentiment: High debt-servicing costs for credit cards and auto loans are beginning to dampen consumer discretionary spending, despite a resilient labor market.
2. Monetary Policy & Interest Rates: The Neutral Rate Era#
The Federal Reserve has maintained the Federal Funds Rate at 3.50% – 3.75% since late 2025. * Yield Curve & NII: The yield curve has largely un-inverted, providing a more traditional environment for bank lending. However, the plateauing of rates means BAC's NII growth has likely peaked, shifting focus to Net Interest Margin (NIM) preservation. * Quantitative Tightening (QT): The Fed has concluded its balance sheet reduction, ensuring sufficient liquidity in the repo markets, which supports BAC’s massive global markets and trading operations.
3. Banking Sector & Bank of America (BAC) Analysis#
The Maturity Wall & Credit Quality
A significant volume of corporate debt issued during the low-rate environment of 2020-2021 is hitting its refinancing wall in 2026. * Provisioning: BAC and its peers are expected to increase Provisions for Credit Losses (PCL) as "Zombie" firms struggle to refinance at 3.5%+ rates. * Consumer Credit: Delinquencies in mid-to-lower tier consumer segments are rising, requiring careful management of BAC's massive credit card portfolio.
Commercial Real Estate (CRE) Crisis
Urban office valuations have reached a structural crisis point due to the permanent shift in work habits. * Exposure: While BAC has a more diversified portfolio than many regional banks, its exposure to Tier-1 city office space remains a "watch" factor. Investors are closely monitoring write-downs in the CRE sector this quarter.
Investment Banking & Trading
The resilient stock market and the shift toward AI-integrated healthcare and industrial sectors have bolstered IB pipelines. * M&A Activity: There is a notable uptick in "Friend-shoring" related M&A as companies move supply chains to Western-aligned blocs. BAC’s global footprint makes it a primary beneficiary of these cross-border advisory fees.
4. Global Geopolitics: A Bifurcated World#
The "Two-Track" global economy (Western-aligned vs. BRICS-aligned) is now a structural reality. * Currency Impacts: The DXY (Dollar Index) remains strong (103-106), driven by US rate advantages over the ECB. This strength aids BAC's domestic purchasing power but creates headwinds for its international wealth management divisions. * The "Japan Factor": The Bank of Japan's exit from negative rates (JGB yields at 1.2% - 1.5%) has triggered a repatriation of Japanese capital. This could lead to sudden volatility in the US Treasury market, which BAC manages through its extensive bond portfolio.
Key Market Drivers & Insights Table#
| Key Metric / Trend | Current Status (Feb 2026) | Impact on BAC / Banking Sector | Strategic Insight for Traders |
|---|---|---|---|
| Fed Funds Rate | 3.50% - 3.75% (Stable) | NIM stabilization; NII growth peaks. | Shift focus from NII growth to asset quality and cost management. |
| Corporate Debt | "Maturity Wall" Refinancing | Higher default risks for leveraged firms. | Watch for increased PCLs (Provisions for Credit Losses) in Q1/Q2 earnings. |
| CRE Valuations | Urban Office Crisis | Potential write-downs; systemic risk for regional banks. | Favor G-SIBs like BAC over smaller banks with concentrated office exposure. |
| GDP Growth | 1.8% - 2.1% (Trend) | Modest loan demand; stable revenue environment. | Defensive "Quality" play; bank earnings will be steady but unexciting. |
| BoJ Policy | Exit from NIRP (Rates 1.2%+) | Treasury market volatility; Yen carry trade unwind. | Hedge against sudden spikes in long-end US yields. |
| Consumer Health | Bifurcated (High debt vs. high wealth) | Rising credit card delinquencies in lower tiers. | Monitor BAC’s credit card net charge-off (NCO) rates closely. |
Final Assessment#
The current state of the world as of February 15, 2026, suggests a WATCH stance on the banking sector with a lean toward ADVOCATE for high-quality G-SIBs like Bank of America. While the macro environment is stable ("Soft Landing"), the structural shifts in commercial real estate and the corporate refinancing cycle present specific risks that favor large, well-capitalized institutions with diversified revenue streams.
FINAL INVESTMENT STANCE: WATCH
Research Team Commentary#
The Research Manager synthesizes the Bull vs Bear debate into action-free commentary.
Here is my assessment of the debate surrounding Bank of America (BAC), viewed through the lens of our value investing philosophy.
Debate Summary#
The Bull argues that BAC is a "wonderful business" momentarily discounted by technical noise. They anchor their thesis on BAC’s massive, low-cost deposit base ($1.9T) creating an unassailable economic moat. They praise management’s aggressive share reduction and view the bank as a technology leader utilizing AI to permanently lower costs. They see the current price as offering a discount to a conservative intrinsic value of $54.90, arguing that bond portfolio losses are temporary and the balance sheet is a fortress.
The Bear counters that we are witnessing "cyclical exuberance." They argue that technology in banking is a treadmill (deflationary commodity), not a moat, and that deposit stickiness is eroding. The Bear highlights a critical capital allocation error: buying back stock at a 64% premium to tangible book value is wealth destructive. They assert there is zero margin of safety, noting that the stock trades well above its historical P/B average while credit risks (CRE and zombie firms) are rising.
Value Investor Commentary#
Stance: WATCH
Core Takeaway: A Fortress Franchise Trading Without a Moat of Safety.
My decision to place Bank of America on the WATCH list comes down to a fundamental violation of the "Margin of Safety" principle. While I agree with the Bull that Bank of America is a high-quality institution with a formidable deposit franchise, I side with the Bear on valuation and cycle timing.
The Bull admits their conservative fair value is $54.90. With the stock trading at $52.55, that represents a roughly 4% discount. In the world of value investing, that is not a margin of safety; that is a margin of error. When we buy a bank at 1.37x Book Value, we need everything to go right. As the Bear correctly pointed out, we are likely at peak credit quality. Buying a cyclical business at a premium multiple when loan loss provisions are historically low is a classic recipe for capital impairment.
Rationale
- The "Tech Moat" Fallacy: I am skeptical of the Bull's claim that tech spending creates a durable moat. The Bear’s assessment aligns more with reality: in banking, digital efficiency is "table stakes." Spending billions just to keep up with JPMorgan and fintechs does not allow BAC to charge higher prices. It merely prevents them from losing customers. That is a necessity, not a competitive advantage.
- Capital Allocation Concerns: The Bull celebrates share repurchases, but the Bear asks the right question: At what price? Buying back stock is only virtuous when the stock is undervalued. Repurchasing shares at significant premiums to tangible book value dilutes the intrinsic value for remaining shareholders. Management is essentially spending $1.37 to buy $1.00 of assets. That worries me.
- Cyclical Blindness: The Bull dismisses the bond portfolio losses as a "footnote." While the unrealized losses will indeed burn off, the opportunity cost of that capital is real. Furthermore, if the "higher for longer" rate environment persists, the cost of funding (deposit betas) will rise, compressing the Net Interest Margin (NIM) just as credit costs potentially tick up.
Monitoring Plan
We will not chase this rally. Instead, we will monitor these specific metrics over the next 2-4 quarters to identify a true entry point:
- Tangible Book Value (TBV) Reversion: I want to see the price drift closer to 1.0x - 1.1x Book Value (approx. $40-$44). We need the price to reflect the risks, not just the "soft landing" optimism.
- Net Charge-Offs (NCOs) in CRE: Watch the Office CRE portfolio specifically. If NCOs spike, the market may overreact and dump the stock. That fear would create our opportunity.
- Deposit Beta Stability: Watch if BAC is forced to raise deposit rates to retain customers. If they maintain their low cost of funds despite rate pressure, the Bull's "Deposit Moat" thesis is confirmed.
Reflections on Past Mistakes
I am reminded of my errors in the 2007 era, where I confused a "Best-in-Class" bank with a "Good Investment." I bought perceived quality without respecting the credit cycle, assuming that a diversified bank was immune to systemic leverage.
As I noted in my journal: "A great company is a terrible investment if the price is wrong."
The Bull is making the same mistake I made back then: assuming current earnings are permanent and that the bank has conquered the business cycle. The Bear is rightly cautious about the "Rearview Mirror" effect. We must remain disciplined. We will let the "impatient" money buy at $52. We will wait for Mr. Market to become depressed again before we deploy capital.
Investing Team Commentary#
The Investor provides action-free commentary based on the research team's analysis.
This analysis of Bank of America (BAC) requires the temperament of a business owner, not a ticker-watcher. While the provided analyst report leans toward a "WATCH" stance based on valuation, a true value investing perspective requires us to peel back the layers of the "moat" and the reality of management’s capital allocation.
The Business Perspective: Moat or Treadmill?#
The "Bull" case rests heavily on the $1.9T deposit base. From a Buffett perspective, a low-cost deposit base is the "float" of the banking world. It is a formidable advantage. However, we must distinguish between a structural moat and operational excellence.
I agree with the "Bear" regarding the Technology Fallacy. In the banking industry, digital transformation is largely a "Red Queen’s Race"—you must run as fast as you can just to stay in the same place. If JPMorgan, Wells Fargo, and Bank of America all spend $10B+ a year on tech, the consumer benefits, but the shareholder merely sees a massive R&D expense required to prevent churn. A true moat allows for pricing power; banking tech today merely provides parity.
The Capital Allocation Litmus Test#
The most critical point raised is the share buyback program. As an owner, I view share repurchases through a single lens: Does this increase the intrinsic value per share for the remaining owners?
If management is buying back shares at 1.37x Tangible Book Value (TBV) when the internal rate of return on those same dollars—if deployed into new loans or high-quality securities—is arguably higher, they are failing the "Ben Graham" test. Buying back stock at a premium to its net asset value during a period of peak cyclical earnings is often a sign of "institutional imperative" (doing what everyone else is doing) rather than disciplined value creation. I would prefer to see that capital preserved for a "rainy day" when they could buy back shares at 0.8x TBV.
Selective Contrarian Insight: The "Hidden" Opportunity Cost#
The market is currently fixated on the "burn-off" of the low-yield bond portfolio. The contrarian view isn't that these losses are permanent (they aren't), but that they represent a massive loss of agility.
While competitors with more liquid balance sheets can pivot to capture higher-yielding credit opportunities or distressed assets, BAC is "handcuffed" to historical low-yield decisions. This doesn't make the bank a "bad" business, but it suggests that its earnings power is artificially capped compared to a more nimble operator. The market is currently pricing BAC as if it has full optionality; it does not.
The Margin of Safety Requirement#
The analyst report suggests a "fair value" of $54.90. For a value investor, a 4% discount is effectively a rounding error. We don't jump at 4% discounts because our estimation of "intrinsic value" is never precise. We require a "Margin of Safety" to account for: 1. Credit Cycle Reversion: We are currently seeing historically low defaults. 2. Regulatory Shifts: Increased capital requirements could further dampen Return on Equity (ROE). 3. Macro Tail Risks: A "hard landing" would disproportionately affect a bank with BAC’s scale.
Final Investment Commentary#
Bank of America is a "fortress" institution, but even a fortress can be an overpriced investment. We do not buy businesses because they are great; we buy them because they are great and the market is mispricing their future cash flows. Currently, the market is pricing BAC for near-perfection—a soft landing, stable margins, and manageable credit losses.
We will wait for a period of "irrational pessimism." The time to buy a bank is when the headlines are screaming about credit collapses and the stock is trading at or below its Tangible Book Value.
FINAL INVESTMENT STANCE: WATCH
Deep Values Commentary#
The Risk Management Team debates and the Portfolio Manager provides final action-free commentary.
Value Investor Commentary#
Stance: WATCH
Core Takeaway: Quality at a Premium is Not Value. After reviewing the heated debate between the Risky, Safe, and Neutral analysts, my assessment remains that Bank of America (BAC) is a high-quality "fortress" trading at a price that demands a "soft landing" perfection. While the business is stronger than it was a decade ago, the current valuation offers no Margin of Safety. We will not pay a premium for a cyclical bank based on the hope of a perfect macroeconomic outcome.
Rationale & Debate Synthesis#
1. The "Red Queen" Effect on Technology (Moat vs. Necessity) The most contentious point in the debate is the $12 billion technology spend. * The Bull (Risky Analyst) argues this is a "scorched-earth strategy" and a "margin expansion weapon" that creates an insurmountable gap for smaller banks. * The Bear (Safe Analyst) counters that in banking, tech spend is an "entry fee" and a "recurring fixed cost that provides zero pricing power." * My Verdict: I side with the Bear. In a commodity business like banking, spending billions to digitize services prevents customer attrition (churn), but it rarely allows the bank to raise prices. If J.P. Morgan and Wells Fargo are spending similarly, this is an arms race where everyone runs faster just to stay in the same place (The Red Queen Effect). We cannot pay a growth multiple for what is essentially a defensive maintenance cost.
2. The Capital Allocation/Valuation Mismatch The debate highlighted a critical mathematical reality regarding share repurchases. * The Bull argues that buying back stock at 1.37x Tangible Book Value (TBV) is acceptable because ROE is 11.2%. * The Bear correctly identifies this as "wealth destructive," noting we are paying a 37% premium for every dollar of assets. * My Verdict: Buybacks are only virtuous when shares are undervalued. Repurchasing shares at a significant premium to book value dilutes the intrinsic value for remaining shareholders. Management is essentially spending $1.37 to buy $1.00 of tangible equity. As the Neutral Analyst noted, the historical average is 1.07x TBV. Paying 1.37x implies we are at the peak of the cycle.
3. The Middle Ground: Price Sensitivity vs. Stubbornness * The Neutral Analyst offered a valuable correction to our original plan. They argued that waiting for a "systemic collapse" price (0.8x TBV) might be too greedy given the bank's improved ROE and capital ratios (CET1 of 12.3%). * Refinement: The Neutral analyst suggests a technical floor near $50.00 (200-day SMA) creates a better entry than the current $52.55. This is a pragmatic adjustment. We should not demand 2008-crisis pricing (0.8x TBV), but we must demand a price that acknowledges the risks of the "2026 maturity wall" the Bear highlighted.
Refined Monitoring Plan#
We are rejecting the "FOMO" (Fear Of Missing Out) pressure from the Bull. We will adjust our original plan to be less rigid on the bottom price, but strictly disciplined on the entry price.
1. Revised Price Targets (The "Scale-In" Approach): * Current Price: ~$52.55 (No Action). * Primary Watch Level ($49.50 - $50.50): As suggested by the Neutral Analyst, this is where the 200-day SMA provides technical support. At this level, the premium over book narrows. We begin deeper due diligence here. * Value Entry Level ($44.00 - $46.00): This represents approx. 1.1x - 1.15x TBV. This aligns with the historical average mentioned by the Neutral analyst. This is where we aggressively deploy capital.
2. Key Metrics to Monitor (The "Business Health" Check): * Efficiency Ratio: To validate the Bull’s "Tech Moat" thesis, we need to see the Efficiency Ratio drop. If tech spend is truly a weapon, operating costs as a percentage of revenue must decrease. If it stays flat, the Bear is right—tech is just a cost of doing business. * CRE Office Provisions: Watch the Provision for Credit Losses (PCL) specifically regarding office real estate. If the Bear’s "maturity wall" theory manifests in 2026, it will show up here first. * Deposit Beta: If rates stay "higher for longer," watch if BAC retains deposits without raising payouts. A true moat is low-cost funding.
Reflections on Past Mistakes#
Lesson: Confusing "Size" with "Safety." In previous cycles (referencing the 2007 era), the mistake was assuming that a "Too Big To Fail" bank was a safe investment regardless of price. I bought the "quality" narrative without respecting the "valuation" discipline.
Application Today: The Risky Analyst is using the same logic today: "BAC is an apex predator... positioned to benefit." This is dangerous thinking. A great business bought at the wrong price is a bad investment. We must remember that price is what you pay, value is what you get. Currently, at 1.37x TBV, the price exceeds the value derived from a utility-like banking business.
Final Decision: We remain on the sidelines. Let the "impatient money" chase the breakout. We will wait for the inevitable reversion to the mean.
STANCE: WATCH
Report generated by Deep Value Intelligence on 2026-02-15 22:22:59