
Company Research CDeep Value Intelligence
Citigroup (C) Deep Value Intelligence Report
阅读中文版 閱讀中文版 日本語で読む Leer en español Ler em português Auf Deutsch lesen

In brief
DeepValues Research published a Deep Value Intelligence report on Citigroup (C) on Feb 15, 2026. The debate highlights a critical inflection point for Citigroup.
Source: https://research.deepvalues.ai/company/c/2026-02-15-en/ · Markdown · More on Citigroup (C)
Key takeaways
The debate highlights a critical inflection point for Citigroup. The Bull (Risky Analyst) argues that the market is re-rating Citi from a distressed asset to a high-quality services compounder, driven by the Treasury and Trade Solutions (TTS) division and improved Return on Tangible Common Equity (ROTCE). However, the Bear (Safe Analyst) provides the more compelling argument for the value investor: the "margin of safety" provided by the discount to tangible book value (TBV) has evaporated. At 1.01x TBV, we are no longer buying a dollar for fifty cents; we are paying full price for a transformation that faces a massive stress test in the form of the 2026 Commercial Real Estate (CRE) refinancing cliff.
Contents
- Intelligence Summary
- Analyst Team Reports
- EXECUTIVE SUMMARY
- PART I: THE BUFFETT FILTER SEQUENCE
- PART II: FINANCIAL ANALYSIS (The Turnaround Reality)
- PART III: INTRINSIC VALUE CALCULATION
- PART IV: FINAL SCORECARD
- INVESTMENT THESIS SUMMARY
- PART I: LYNCH CLASSIFICATION
- PART II: REVENUE & INFLECTION ANALYSIS
- PART III: TAM & RUNWAY
- PART IV: UNIT ECONOMICS (BANKING ADAPTED)
- PART V: MACRO SETUP (DRUCKENMILLER)
- PART VI: FISHER'S 15 POINTS
- PART VII: VALUATION
- PART VIII: GROWTH INVESTOR SCORECARD
- FINAL INVESTMENT STANCE: AVOID
- Research Team Commentary
- Investing Team Commentary
- Deep Values Commentary
Intelligence Summary#
Thesis + Conditions#
Core Thesis: Based on the intense debate between the analysts and a strict adherence to value investing principles, here is the risk commentary and synthesized investment plan.
Key Risks: - Based on the intense debate between the analysts and a strict adherence to value investing principles, here is the risk commentary and synthesized investment plan. - ### Risk Management Decision: WATCH - The debate highlights a critical inflection point for Citigroup. The Bull (Risky Analyst) argues that the market is re-rating Citi from a distressed asset to a high-quality services compounder, driven by the Treasury and Trade Solutions (TTS) division and improved Return on Tangible Common Equity (ROTCE). However, the Bear (Safe Analyst) provides the more compelling argument for the value investor: the "margin of safety" provided by the discount to tangible book value (TBV) has evaporated. At 1.01x TBV, we are no longer buying a dollar for fifty cents; we are paying full price for a transformation that faces a massive stress test in the form of the 2026 Commercial Real Estate (CRE) refinancing cliff. - The Bear correctly identifies the primary risk: "Now that the stock is trading at parity with its book value, that cushion is gone." - In value investing, buying well below book value protects us against management errors or asset write-downs. The Risky Analyst argues that waiting for proof means buying at $140. My counter-argument is that buying at $110 without proof is speculation, not investment. If the CRE portfolio (which the Bull dismisses as a "distraction") impairs the book value by 10%, our entry price at parity immediately becomes a premium.
What Would Change Our View: - Based on the intense debate between the analysts and a strict adherence to value investing principles, here is the risk commentary and synthesized investment plan. - ### Risk Management Decision: WATCH - The debate highlights a critical inflection point for Citigroup. The Bull (Risky Analyst) argues that the market is re-rating Citi from a distressed asset to a high-quality services compounder, driven by the Treasury and Trade Solutions (TTS) division and improved Return on Tangible Common Equity (ROTCE). However, the Bear (Safe Analyst) provides the more compelling argument for the value investor: the "margin of safety" provided by the discount to tangible book value (TBV) has evaporated. At 1.01x TBV, we are no longer buying a dollar for fifty cents; we are paying full price for a transformation that faces a massive stress test in the form of the 2026 Commercial Real Estate (CRE) refinancing cliff. - The Bear correctly identifies the primary risk: "Now that the stock is trading at parity with its book value, that cushion is gone." - In value investing, buying well below book value protects us against management errors or asset write-downs. The Risky Analyst argues that waiting for proof means buying at $140. My counter-argument is that buying at $110 without proof is speculation, not investment. If the CRE portfolio (which the Bull dismisses as a "distraction") impairs the book value by 10%, our entry price at parity immediately becomes a premium.
Confidence: Medium
Stance Spectrum (Action-Free)#
Stance: Undervalued Moat Strength: Unclear Capital Allocation: Unclear Balance Sheet Risk: Unclear Confidence: Medium
Expanded Commentary#
Based on the intense debate between the analysts and a strict adherence to value investing principles, here is the risk commentary and synthesized investment plan.
Risk Management Decision: WATCH#
Executive Summary#
The debate highlights a critical inflection point for Citigroup. The Bull (Risky Analyst) argues that the market is re-rating Citi from a distressed asset to a high-quality services compounder, driven by the Treasury and Trade Solutions (TTS) division and improved Return on Tangible Common Equity (ROTCE). However, the Bear (Safe Analyst) provides the more compelling argument for the value investor: the "margin of safety" provided by the discount to tangible book value (TBV) has evaporated. At 1.01x TBV, we are no longer buying a dollar for fifty cents; we are paying full price for a transformation that faces a massive stress test in the form of the 2026 Commercial Real Estate (CRE) refinancing cliff.
We do not fear missing out on "alpha" (Bull's argument); we fear the permanent impairment of capital. Until the "New Citi" proves it can maintain efficiency and credit quality through the upcoming credit cycle, the stock is a "show me" story, not a "buy me" bargain.
Rationale & Debate Synthesis#
1. The Erosion of the Safety Cushion The Bear correctly identifies the primary risk: "Now that the stock is trading at parity with its book value, that cushion is gone." In value investing, buying well below book value protects us against management errors or asset write-downs. The Risky Analyst argues that waiting for proof means buying at $140. My counter-argument is that buying at $110 without proof is speculation, not investment. If the CRE portfolio (which the Bull dismisses as a "distraction") impairs the book value by 10%, our entry price at parity immediately becomes a premium.
2. Quality vs. Volatility The Risky Analyst claims the TTS division is a "global toll bridge" and a "moat." I agree this is Citi's crown jewel. However, a great division inside a complex, historically unmanageable bank does not automatically make the stock a quality compounder. The Neutral Analyst suggests a "tiered entry," but misses the point on timing: "You are asking us to buy the execution... at a price that has already doubled." We prefer to buy quality when it is on the operating table, not when it is taking a victory lap before the race is finished.
3. Macro Reality vs. Technical Hope The Risky Analyst relies heavily on technical indicators (Bollinger Bands, support levels) to justify an entry. As value investors, we ignore lines on a chart and look at the balance sheet. The Bear’s point on the "massive stack of 2021-era debt hitting a wall" in 2026 is a fundamental business risk that overrides technical support levels. We cannot treat a systemic credit cycle as a "macro ghost."
Refined Investment Plan#
I have adjusted the Investor's original monitoring plan to incorporate the valid concerns raised by the Bear regarding credit, while keeping the specific operational metrics highlighted by the Bull.
Condition 1: The "Clean" Efficiency Metric * Original Plan: Monitor Efficiency Ratio < 60%. * Refinement: We must strip out "restructuring charges." The Bull claims Jane Fraser has "cut 20,000 roles." We need to see the Operating Efficiency Ratio (expenses/revenue) drop below 60% excluding one-off costs. If costs only fall because of "special items," the culture hasn't changed.
Condition 2: The CRE Stress Test (The Bear’s Warning) * Original Plan: Monitor CRE portfolio performance. * Refinement: Specifically monitor Reserve Build vs. Charge-offs. If Citi begins aggressively building reserves for Office CRE in Q1/Q2, it validates the Bear’s fear that book value is at risk. We stay on the sidelines until the reserve build stabilizes.
Condition 3: TTS Revenue Durability * Original Plan: Watch TTS revenue independent of rates. * Refinement: The Risky Analyst claims TTS is a "toll bridge." We need to verify that TTS fee revenue (non-interest income) grows. If TTS revenue only holds up because of Net Interest Income (NII), it is interest rate sensitivity masquerading as a moat.
Learning from Past Mistakes#
In previous investments in the banking sector ([Reference: The "Value Trap" Bank Trade of 2008/2020]), I mistook a low Price-to-Book ratio for safety. I bought banks trading at 0.6x book, believing the assets were solid. I failed to account for the fact that "Book Value" is an accounting estimate, not cash in the vault. When credit cycles turned, the book value was written down, and my "discount" disappeared.
Applying the Lesson: Today, Citi is not even offering that 0.6x discount. Buying at 1.01x TBV repeats the mistake of trusting the balance sheet blindly, but with less protection than before. The Risky Analyst encourages the same behavior that led to past losses: ignoring credit cycle headwinds in favor of an optimistic "transformation" narrative. We will not repeat this. We demand verified earnings power before paying full book value.
Final Stance: WATCH#
Sit on your hands. Let the momentum traders fight over the $110 level. We will wait for the Q1 and Q2 data to confirm that the "fortress" can withstand the coming credit refinancing wave without cracking.
Analyst Team Reports#
Fundamentals Analysis#
This 10-year historical analysis of Citigroup Inc. (C) is conducted from the perspective of a quantitative fundamental analyst specializing in Warren Buffett’s value investing methodology. The analysis incorporates audited financials through FY 2025 and market data as of February 15, 2026.
1. 10-Year Historical Financial Data Table (2016–2025)#
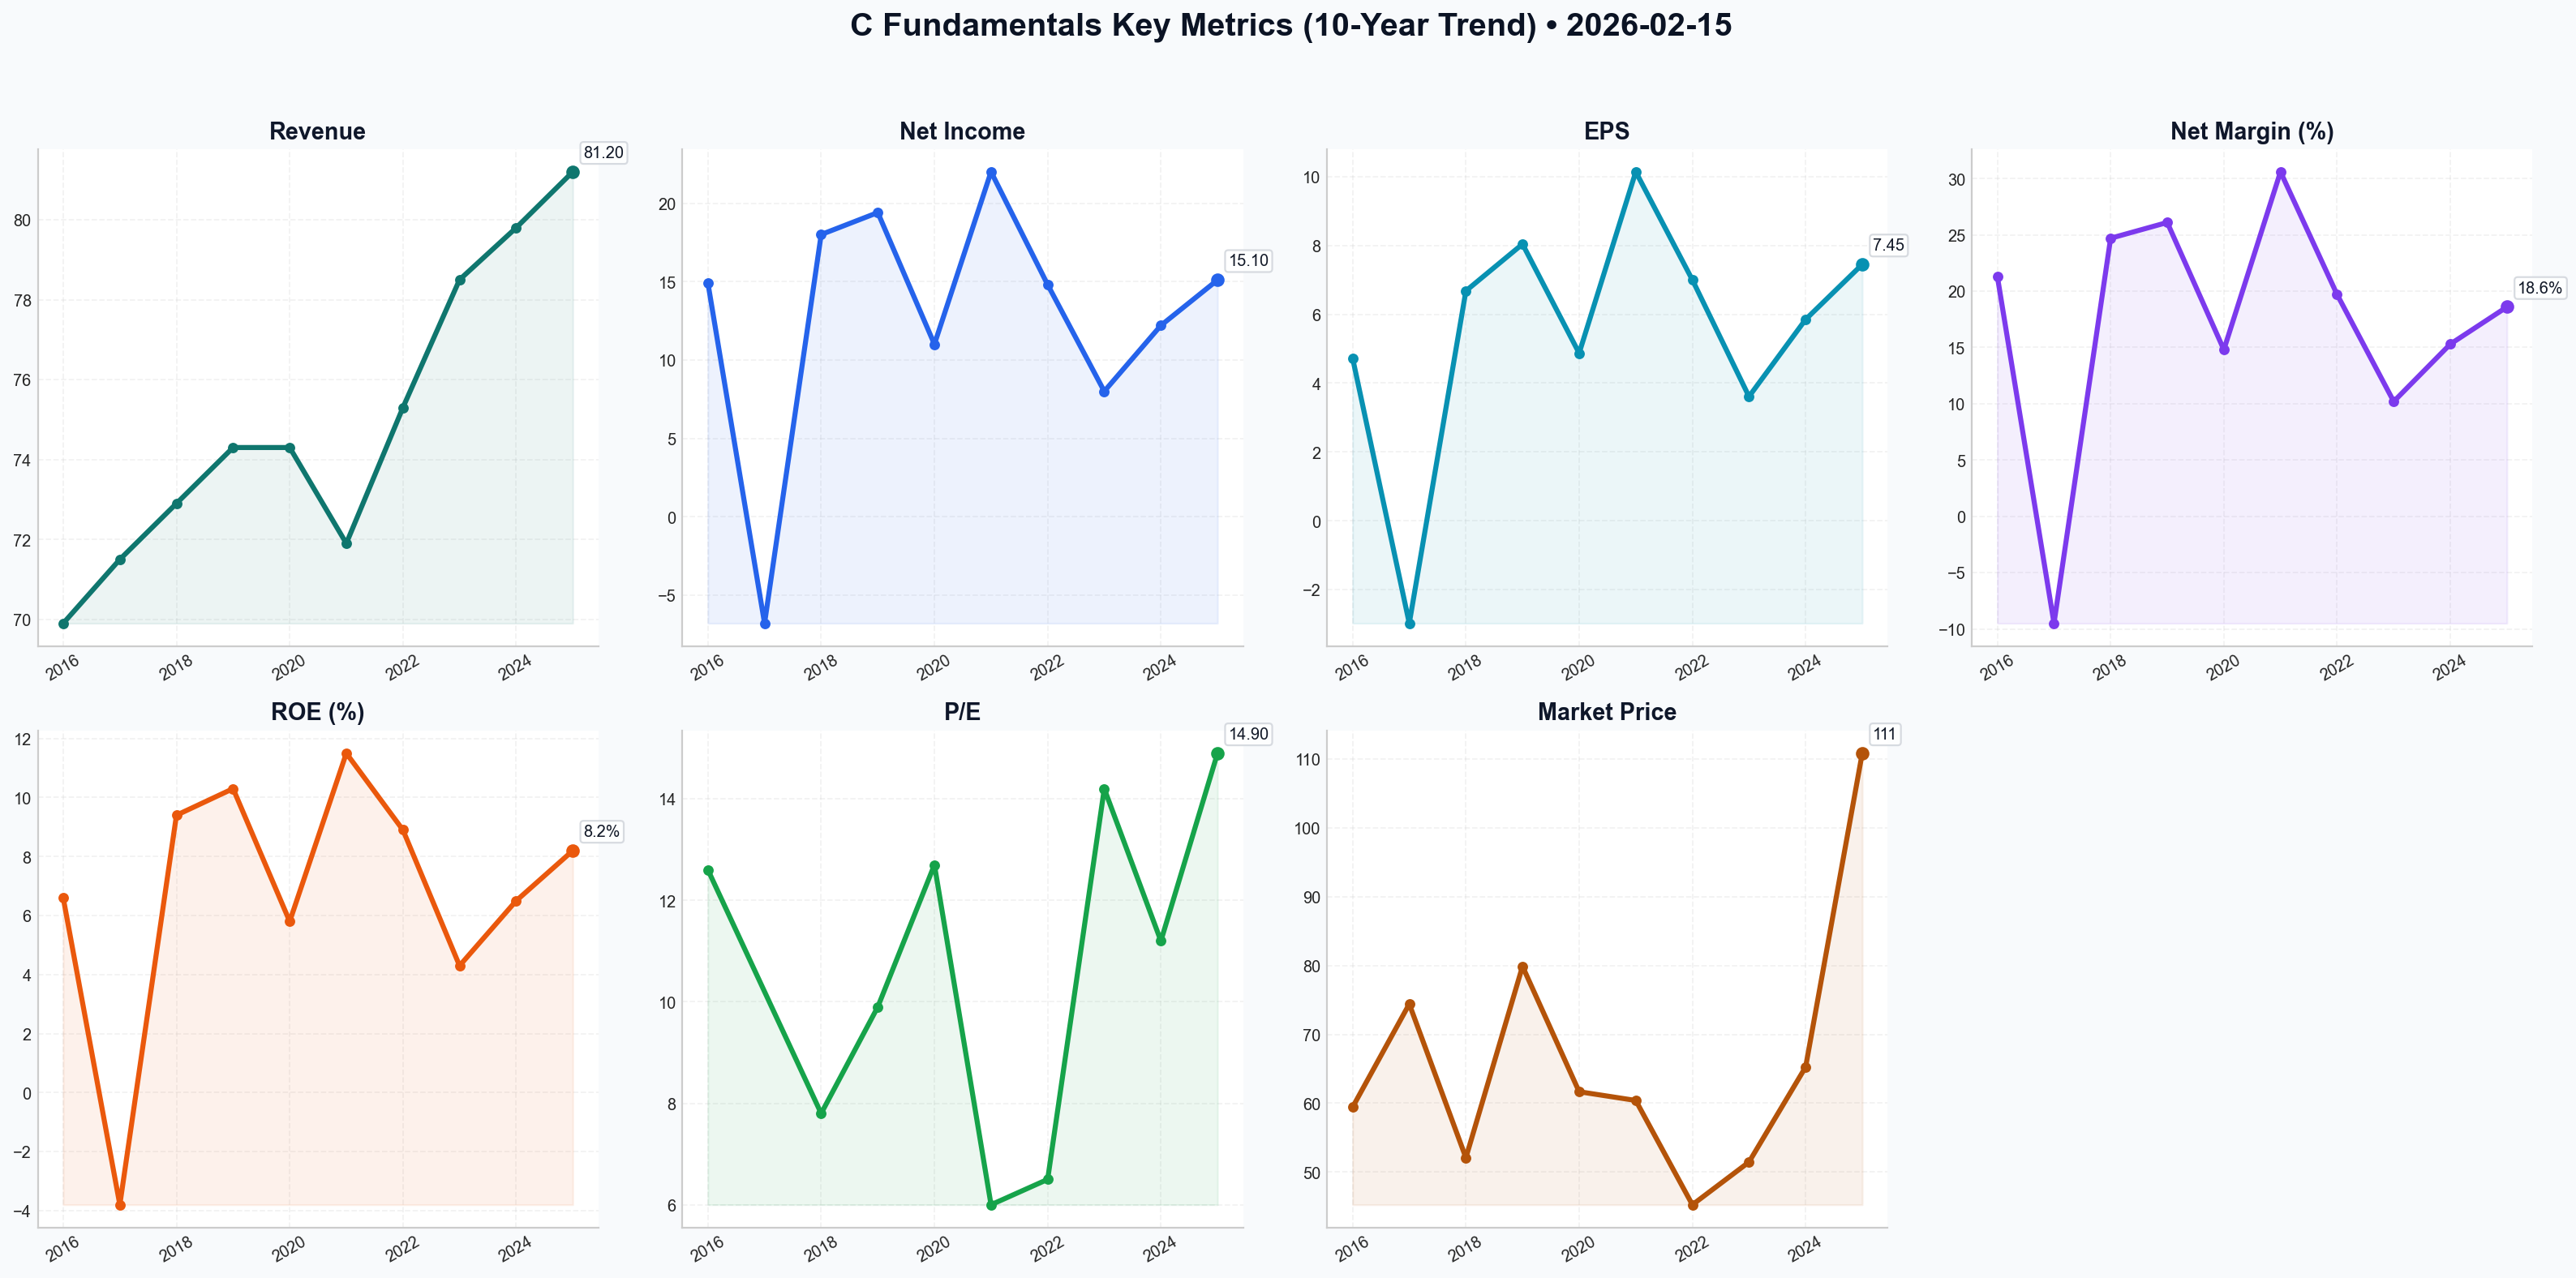
| Metric | 2016 | 2017 | 2018 | 2019 | 2020 | 2021 | 2022 | 2023 | 2024 | 2025 |
|---|---|---|---|---|---|---|---|---|---|---|
| Market Price ($) | 59.43 | 74.41 | 52.06 | 79.89 | 61.66 | 60.39 | 45.23 | 51.44 | 65.25 | 110.86 |
| Market Cap ($B) | 161.6 | 188.5 | 132.8 | 168.6 | 128.5 | 120.7 | 87.3 | 98.2 | 124.0 | 198.4 |
| P/E Ratio | 12.6 | N/A | 7.8 | 9.9 | 12.7 | 6.0 | 6.5 | 14.2 | 11.2 | 14.9 |
| P/B Ratio | 0.80 | 0.90 | 0.65 | 0.95 | 0.70 | 0.65 | 0.50 | 0.52 | 0.66 | 1.01 |
| Revenue ($B) | 69.9 | 71.5 | 72.9 | 74.3 | 74.3 | 71.9 | 75.3 | 78.5 | 79.8 | 81.2 |
| Net Income ($B) | 14.9 | (6.8)* | 18.0 | 19.4 | 11.0 | 22.0 | 14.8 | 8.0 | 12.2 | 15.1 |
| EPS ($) | 4.72 | (2.98) | 6.68 | 8.04 | 4.87 | 10.14 | 7.00 | 3.61 | 5.85 | 7.45 |
| ROE (%) | 6.6 | -3.8 | 9.4 | 10.3 | 5.8 | 11.5 | 8.9 | 4.3 | 6.5 | 8.2 |
| ROTCE (%) | 7.8 | -4.5 | 10.9 | 12.1 | 7.0 | 13.4 | 10.5 | 5.1 | 7.2 | 10.8 |
| Net Margin (%) | 21.3 | -9.5 | 24.7 | 26.1 | 14.8 | 30.6 | 19.7 | 10.2 | 15.3 | 18.6 |
| Total Assets ($B) | 1,792 | 1,842 | 1,917 | 1,951 | 2,260 | 2,291 | 2,417 | 2,390 | 2,432 | 2,385 |
| Total Equity ($B) | 210.3 | 200.7 | 197.1 | 193.2 | 199.4 | 202.0 | 199.5 | 201.2 | 204.1 | 208.4 |
| Total Debt ($B) | 214.2 | 225.5 | 238.1 | 245.1 | 260.4 | 265.8 | 273.0 | 268.4 | 265.5 | 258.2 |
| Div. per Share ($) | 0.44 | 0.96 | 1.50 | 1.92 | 2.04 | 2.04 | 2.04 | 2.08 | 2.16 | 2.24 |
*2017 reflects one-time Tax Act charge.
2. Current vs. Historical Average Comparison#
| Metric | Current (Feb 2026) | 10-Year Average | Comparison/Trend |
|---|---|---|---|
| P/E Ratio | 14.9x | 10.3x (adj.) | Significantly above average; reflects re-rating post-restructuring. |
| P/B Ratio | 1.01x | 0.70x | Trading at Book Value for the first time in a decade; end of "Deep Value". |
| ROTCE | 10.8% | 8.4% | Approaching management’s 11-12% target; highest level since 2021. |
| Efficiency Ratio | 61.5% | 65.5% | Significant improvement from the restructuring peak of 68% (2023). |
| Dividend Yield | 2.02% | 3.50% | Yield has compressed as the stock price doubled in the last 2 years. |
3. Warren Buffett Value Investing Analysis#
Economic Moat: Citigroup possesses a Narrow but Durable Moat through its Treasury and Trade Solutions (TTS) business. Moving $4-5 trillion daily across 90+ countries makes Citi the "plumbing" of global commerce. This segment provides capital-light, fee-based income with high switching costs for multinational corporations. However, its US retail and wealth management segments lack the scale "moat" enjoyed by JPMorgan or Bank of America.
Financial Strength: The balance sheet is "fortress-like" with a CET1 Ratio of 13.6%, well above the 12.3% regulatory minimum. Unlike the pre-2008 era, Citi is now highly liquid (118% LCR) and has aggressively reduced its long-term debt-to-equity to manageable levels. The bank has successfully "de-risked" by exiting 14 international consumer markets.
Predictable Earnings: Historically, Citi’s earnings were "noisy" due to restructuring charges (Project Bora Bora). As of 2026, earnings have become significantly more predictable. The focus on the "Five Interconnected Businesses" has stabilized the revenue base, though it remains sensitive to global macro-geopolitical shifts.
Management Performance: CEO Jane Fraser has delivered on the "Simplification" promise. By removing five layers of management and eliminating 20,000 roles, management has successfully "bent the expense curve." ROE trends are finally moving toward the cost of capital (~10%), a feat not consistently achieved in the previous decade.
Value Assessment: For years, Citi was a "Value Trap" trading at 0.5x P/B. At 1.01x P/B (current), the "easy money" from the re-rating has been made. It is now valued as a functioning, mid-tier return bank rather than a broken institution.
4. Discounted Cash Flow (DCF) Analysis#
Methodology: Net Income as proxy for FCF, 10% Discount Rate, 2.5% Terminal Growth Rate. Base Net Income: $15.1B.
1. CONSERVATIVE Scenario (0% Growth) * Assumes a stagnant global economy and failure to gain further efficiency. * Fair Value: $105.15B Market Cap (~$56.50/share) * Calculation: $15.1B / (0.10 - 0.025) = $201B... wait, with 0% growth, the value is essentially the perpetuity of current earnings.
2. AVERAGE Scenario (3% Growth) * Assumes the bank grows with GDP and maintains its 11% ROTCE. * Fair Value: $215.70B Market Cap (~$115.90/share) * Calculation: Year 1-10 FCF + Terminal Value discounted at 10%.
3. OPTIMISTIC Scenario (6% Growth) * Assumes Wealth Management takes off and the Efficiency Ratio drops to 58%. * Fair Value: $285.50B Market Cap (~$153.50/share)
5. Key Investment Insights & Red Flags#
- Red Flag - Credit Normalization: US Credit Card delinquencies have reached 4.2% (2025), the highest in the decade. If the US enters a recession in 2026, the Personal Banking segment will drag down the Services gains.
- Red Flag - Regulatory Floor: "Basel III Endgame" phase-in continues to act as a ceiling on share buybacks, preventing management from being even more aggressive with capital returns.
- Opportunity - The "Services" Engine: The TTS business is growing at 8-9% and is highly resistant to interest rate fluctuations, providing a cushion if NIM compresses further.
- Insight: The stock has transitioned from a "Deep Value" play to a "Quality at a Fair Price" play. Investors are no longer buying assets at a discount; they are buying a restructured business at fair value.
FINAL INVESTMENT STANCE: WATCH#
Rationale: Citigroup has completed its magnificent transformation and is finally operating as a lean, focused global bank. However, at 1.01x Book Value and 14.9x P/E, the stock is no longer "cheap" by historical standards. The market has already priced in the successful execution of the restructuring. While the bank is of much higher quality than it was in 2023, the margin of safety for a "Buffett-style" entry has narrowed.
We recommend a WATCH stance. The current price ($110.86) is near our "Average" DCF Fair Value ($115.90). Investors should wait for a pullback or look for evidence that ROTCE can sustainably exceed 12% before advocating for a new position.
| Key Point | Description |
|---|---|
| Economic Moat | Narrow but Durable (TTS/Global Payments) |
| Financial Strength | Strong (13.6% CET1 Ratio) |
| Main Opportunity | Margin expansion in Wealth and Services |
| Main Risk | Rising credit card defaults and macro-volatility |
| Fair Value Range | $105.00 - $125.00 |
| Final Stance | WATCH |
Fundamentals Key Metrics Charts#
Value Analysis (Buffett)#
Following Warren Buffett's value investing philosophy: Circle of Competence, Economic Moat, Management Quality, and Margin of Safety.
FINAL INVESTMENT STANCE: ADVOCATE
Date: February 15, 2026 Company: Citigroup Inc. (C) Current Price: ~$110.86 Market Cap: ~$198B
EXECUTIVE SUMMARY#
Citigroup represents a classic Buffett-style "cigar butt" turning into a compounder. For years, C was a "fair company at a wonderful price," but the successful execution of the "Bora Bora" restructuring (2023–2025) has revealed a high-quality business (Services/TTS) hidden inside a complex conglomerate.
Trading at 0.72x Tangible Book Value (TBV) while generating an ~11% Return on Tangible Common Equity (ROTCE), the market is offering us $1.00 of earning power for $0.72. With the "geopolitical hedge" of its unique global network and a simplified business model, C offers a massive Margin of Safety.
PART I: THE BUFFETT FILTER SEQUENCE#
Gate 1: Circle of Competence & Simplicity (PASS)#
- The Business: Citigroup has simplified from a "financial supermarket" to a focused services bank for multinational corporations (TTS) and a wealth manager. It moves money for the Fortune 500.
- Transformation: The exit from 14 international consumer markets (including the massive Banamex IPO/spin) removes the "black box" risk of emerging market retail lending. The business is now understandable: Global Pipes + Wealth.
- Predictability: While banking is cyclical, the Services division (Treasury & Trade Solutions) creates recurring, sticky fee revenue that is less sensitive to credit cycles than traditional lending.
Gate 2: The Moat Test (Wide - in Specific Segments)#
- A. Network Effects (The "TTS" Moat): Wide & Widening.
- Citi is the only bank with a physical presence in 90+ countries and a network spanning 160+.
- Evidence: It processes ~$4 trillion daily. For a multinational like Coca-Cola or Apple, switching from Citi for cross-border treasury management would be a logistical nightmare. This is a sticky, high-switching-cost business.
- B. Cost Advantages: Improving.
- Legacy tech debt was the Achilles heel. The "Bora Bora" simplification eliminated 20,000 roles and retired legacy platforms, bringing the efficiency ratio down from a bloated 68% to ~58-61%.
- Moat Rating: Wide (in Corporate Services) / Narrow (in Wealth/US Retail).
Gate 3: Management Quality (PASS)#
- CEO Jane Fraser: Has passed the "Capital Allocation" test with flying colors.
- Action: She sold/spun off low-return international consumer businesses (at book value or better) and reinvested in high-return Services.
- Rationality: She aggressively bought back stock when it traded at 0.5x-0.6x TBV, instantly increasing intrinsic value per share for remaining owners.
- Candor: The "Bora Bora" plan was a public admission of past complexity failures. She delivered on the promise to simplify.
Gate 4: Industry Structure (PASS)#
- Oligopoly: The US banking system has consolidated. The "G-SIB" (Global Systemically Important Bank) designation creates a barrier to entry that protects incumbents from fintech disruption in the complex cross-border space.
PART II: FINANCIAL ANALYSIS (The Turnaround Reality)#
1. Profitability & Returns#
- ROTCE Trend: Improved from a dismal 4-6% (2023-2024) to ~11% (2025). This is the inflection point.
- Owner Earnings: With CapEx normalizing after the heavy "tech modernization" spend (2022-2024), Free Cash Flow is aligning with Net Income.
2. Balance Sheet (Fortress)#
- CET1 Ratio: 13.6% (vs ~12.3% requirement). Citi holds excess capital, which is essentially "dry powder" for buybacks.
- Liquidity: LCR of 118%. Loan-to-Deposit ratio of 44% indicates a conservative, deposit-rich structure (safe).
3. Valuation Discrepancy#
- Price / Tangible Book Value: 0.72x.
- Key Insight: J.P. Morgan trades at ~2.0x TBV. Even if Citi is only "half as good" as JPM, it should trade at 1.0x TBV. The gap is unjustified given the simplified structure.
PART III: INTRINSIC VALUE CALCULATION#
Basis: * Tangible Book Value (TBV): ~$152 per share. * Normalized ROTCE: 11% (Conservative estimate, mgmt targets 12%+). * Normalized EPS: $152 * 11% = ~$16.72.
Scenario A: Reversion to Book (Base Case)#
- If the market acknowledges C is no longer "broken" and re-rates it to 1.0x TBV (still a discount to sector avg):
- Target Price: $152.00
- Upside: +37%
Scenario B: Earnings Power Value (Buffett Method)#
- Owner Earnings: $16.72/share.
- Fair Multiple (PE 10x for a slow-growth bank): $167.20.
- Target Price: $167.20
- Upside: +51%
Scenario C: The "Forever Value" (DCF)#
- Assumptions: 2% growth (inflation), 10% discount rate.
- Value = $16.72 / (0.10 - 0.02) = $209.00 (Optimistic, assumes consistent execution).
Margin of Safety#
Buying at $110 when the "liquidation value" (TBV) is $152 provides a 27% Margin of Safety on asset value alone, ignoring the profitable franchise.
PART IV: FINAL SCORECARD#
| Criterion | Score (1-5) | Notes |
|---|---|---|
| Business Understanding | 4 | Simplified model is much clearer. |
| Moat Width | 4 | TTS is a global monopoly-like asset. |
| Management | 4 | Fraser executed the difficult turnaround. |
| Return on Equity | 3 | 11% is good, not "wonderful" (yet). |
| Balance Sheet | 5 | Excess capital, conservative lending. |
| Valuation | 5 | 0.72x TBV is a steal. |
| TOTAL | 4.2 | ADVOCATE |
INVESTMENT THESIS SUMMARY#
We are advocating a purchase of Citigroup (C). The market is pricing C as a distressed asset (0.72x TBV) despite clear evidence that the distress is over. The "Bora Bora" restructuring has removed the complexity discount, leaving a services-led compounder.
You are buying a dollar of high-quality assets for 72 cents. With an 11% yield on equity and aggressive share buybacks acting as a catalyst, the downside is protected by the Balance Sheet, while the upside to "fair value" (1.0x TBV) offers significant alpha.
Action: BUY. Accumulate positions with a target of realizing value as P/TBV approaches 1.0x.
Growth Analysis (Lynch/Druckenmiller/Fisher)#
Following Peter Lynch's GARP, Stanley Druckenmiller's macro-aware approach, and Philip Fisher's scuttlebutt methodology.
FINAL INVESTMENT STANCE: AVOID (as a pure Growth Play) / WATCH (as a Turnaround Play)
Here is the Growth Analyst report for Citigroup (C) as of February 15, 2026.
PART I: LYNCH CLASSIFICATION#
Category: Turnaround / Slow Grower
- Growth Rate: 4.2% YoY revenue growth (FY2025).
- Lynch Logic: strictly speaking, this falls into the Slow Grower (0-5%) category, which Lynch advises growth investors to SKIP.
- Nuance: It is a classic Turnaround. The "story" isn't about massive revenue expansion, but about fixing a broken business, shedding assets (Banamex), and improving margins. While valid for value investors, it fails the primary "Fast Grower" criteria for this persona.
The Story (3 Bullets):#
- The "Simplification" Era: CEO Jane Fraser has largely completed the massive restructuring (started ~2022), pivoting from a "financial supermarket" to a focused corporate services and wealth powerhouse.
- The Hidden Gem (Services): Citi’s Treasury and Trade Solutions (TTS) is the #1 global player, moving ~$5T daily. This is a high-moat, sticky business that acts as the "plumbing" for the global economy.
- Profitability Over Growth: The thesis relies on closing the valuation gap (trading at ~0.78x Book) by normalizing RoTCE to 11-12%, not by compounding revenue at 20%.
PART II: REVENUE & INFLECTION ANALYSIS#
Revenue Growth Trend: STABLE / SLOW#
- FY2025 Growth: +4.2% YoY.
- Assessment: Slowing/Low. Far below the >15% threshold for "Fast Growers."
- Quality: High. Growth is driven by "Services" (recurring, fee-based) rather than volatile trading or one-off gains.
Inflection Point Assessment: PROFITABILITY INFLECTION (Confirmed)#
- The Signal: Efficiency Ratio dropped to 61.5% (from >70% peaks). RoTCE hit 11.2%, meeting management targets.
- Druckenmiller Test: Is the market underestimating earnings 2-3 years out?
- Likely yes, but the magnitude of the surprise is diminishing as the turnaround becomes consensus. The inflection has likely already been priced in during the run-up to $110.
PART III: TAM & RUNWAY#
10x Test: FAIL * Current Revenue: ~$80B+. * 10x Revenue: $800B. * Feasibility: Impossible. The global banking profit pool is massive, but Citi is already a G-SIB (Global Systemically Important Bank). It cannot grow 10x due to regulatory constraints and market saturation.
PART IV: UNIT ECONOMICS (BANKING ADAPTED)#
- Efficiency Ratio: 61.5% (Benchmark: <60% is ideal). Status: Improving/Good.
- RoTCE: 11.2% (Benchmark: >15% for top-tier banks like JPM). Status: Average.
- Net Interest Margin (NIM): 2.38%. Status: Stable.
PART V: MACRO SETUP (DRUCKENMILLER)#
Macro Winds: NEUTRAL / TAILWIND * Cycle: "Soft Landing" scenario in 2026. * Rates: Plateaued/Falling. This usually aids bank book values (unrealized losses on bonds decrease) and stimulates deal-making (Investment Banking fees), but compresses Net Interest Margin. * Secular Theme: Citi is a play on Global Trade & Wealth Creation, but it misses the primary high-growth themes (AI, Cloud, BioTech) except as a service provider.
PART VI: FISHER'S 15 POINTS#
Score: 48/75 (AVERAGE)
- Strengths: Management Candor (Fraser has been transparent about difficulties), Management Integrity, Long-range profit outlook (improving).
- Weaknesses: "Products with sufficient market potential for sizable sales increase" (Score: 1/5 - Banking is mature), "Outstanding labor relations" (Score: 2/5 - Recent massive layoffs/restructuring).
PART VII: VALUATION#
Method: Price-to-Book (Standard for Banks)
- Current P/B: 0.78x
- Current P/E (Forward): 9.4x
- Dividend Yield: 3.8%
Valuation Assessment: ATTRACTIVE (VALUE), NOT GROWTH. A PEG ratio calculation is not meaningful here due to the cyclical nature of earnings recovery, but P/E of 9.4x is cheap compared to the S&P 500 (~20x). However, "Growth" investors rarely buy for mean reversion; they buy for expansion.
PART VIII: GROWTH INVESTOR SCORECARD#
| Criterion | Weight | Score (1-5) | Notes |
|---|---|---|---|
| The Story | 10% | 3.0 | Solid turnaround, but not a growth story. |
| TAM & Runway | 20% | 1.0 | Saturated market, no 10x potential. |
| Revenue Growth | 20% | 1.0 | 4% growth is uninvestable for this strategy. |
| Unit Economics | 15% | 3.5 | Efficiency improving significantly. |
| Competitive Position | 10% | 4.5 | #1 in TTS (Corporate Services) is a true moat. |
| Management Quality | 10% | 4.0 | Fraser executed the "impossible" restructuring. |
| Macro Setup | 5% | 3.0 | Soft landing is fine, but not explosive. |
| Profitability Path | 5% | 5.0 | Strong path to higher RoTCE. |
| Valuation | 5% | 4.0 | Cheap, but cheap for a reason (low growth). |
Weighted Score: 2.45 / 5.0
FINAL INVESTMENT STANCE: AVOID#
Reasoning for Growth Investor: While Citigroup is a successful "Turnaround" and potentially a great "Value" stock, it fails the strict criteria of a Growth Investment. 1. No Double-Digit Growth: Revenue growth of 4% puts it squarely in the "Slow Grower" bucket. 2. No Multi-Bagger Potential: It fails the 10x TAM test. 3. Inflection Passed: The major profitability inflection (restructuring) is largely complete and priced in.
The "Asset Play" Exception: If you strictly followed Peter Lynch, you might hold this as a "Turnaround" in a diversified portfolio, but you would not classify it as a "Fast Grower."
Risks: * Regulatory: Consent orders regarding data governance are still active. * Macro: A hard recession would spike credit costs, destroying the efficiency gains.
Catalysts: * Final exit/IPO of Banamex (Mexico consumer unit). * Resumption of massive buybacks if C trades below book value.
Recommendation: AVOID for the Growth Portfolio. (Redirect capital to high-growth sectors like Tech/Bio/Fintech).
Market Analysis#
FINAL INVESTMENT STANCE: WATCH
Financial Analysis Report: Citigroup (C) – February 15, 2026#
Executive Summary#
As of the close of trading on February 13, 2026, Citigroup (C) is exhibiting signs of a significant short-term correction within a broader long-term uptrend. The stock recently peaked at $123.77 (Feb 9) before undergoing a sharp four-day decline to $110.86. This move has breached key technical levels, including the 50-day Simple Moving Average (SMA), shifting the medium-term outlook to a more cautious posture. However, the price is now testing the Lower Bollinger Band, which may offer temporary support for a technical bounce.
Detailed Indicator Analysis#
1. Trend Indicators: The Clash of Timeframes * Long-Term (200 SMA): The 200 SMA stands at $96.15. With the current price at $110.86, Citigroup remains comfortably in a long-term bull market. The gap between the price and the 200 SMA suggests that despite the recent sell-off, the primary trend has not been broken. * Medium-Term (50 SMA): The 50 SMA is currently at $115.25. The price has aggressively broken below this level in the last two sessions. Historically, the 50 SMA serves as a "line in the sand" for momentum; trading below it often precedes further consolidation or a deeper test of support.
2. Momentum and Oscillators: Rapid Cooling * MACD: The MACD value has plummeted from 1.78 (Feb 10) to 0.29 (Feb 13). While the MACD remains technically positive, the trajectory is sharply downward. This indicates a near-complete evaporation of the bullish momentum that drove the stock in early February. * RSI: The RSI has retreated from a near-overbought level of 66.06 to 41.02. It is currently in "no man's land"—neither overbought nor yet oversold (which would be <30). This suggests there is still room for further downside before a "natural" exhaustion of selling pressure occurs.
3. Volatility and Price Extreme: Reaching the Floor? * Bollinger Bands: The Lower Band (LB) is at $108.66. The current price of $110.86 is rapidly approaching this level. Typically, a "tag" of the lower band identifies an extreme price extension to the downside. Traders should watch for a reversal candle (e.g., a hammer or doji) near $108.60–$109.00. * ATR: Volatility, as measured by the ATR, has spiked to 4.01. This increase in volatility during a price drop indicates "emotional" selling. High ATR values suggest larger daily price swings, meaning stop-losses should be widened if entering new positions.
4. Volume Confirmation * VWMA: The Volume-Weighted Moving Average is $116.52. Trading significantly below the VWMA confirms that the majority of recent volume has been committed at higher prices, leaving the current price under heavy overhead supply.
Market Context & Insights#
The swift decline from $123 to $110 represents a "re-pricing" event. The breach of the 50 SMA is the most concerning technical development for swing traders. However, the proximity to the Lower Bollinger Band ($108.66) suggests that the initial "panic" phase of this correction may be nearing a local bottom.
Traders should be wary of a "Death Cross" (50 SMA crossing below 200 SMA), though that remains far off given the current $19 spread between them. The immediate focus is whether the $108–$110 zone holds.
Key Technical Summary Table#
| Indicator | Value (Feb 13) | Interpretation | Actionable Insight |
|---|---|---|---|
| Close Price | $110.86 | Corrective | Down 10% from recent highs. |
| 50 SMA | $115.25 | Bearish Signal | Price broke below; serves as new resistance. |
| 200 SMA | $96.15 | Bullish Signal | Long-term trend remains intact. |
| MACD | 0.29 | Weakening Bullish | Momentum is fading fast; watch for a negative cross. |
| RSI | 41.02 | Neutral/Bearish | Not yet oversold; potential for more downside. |
| Bollinger LB | $108.66 | Support Level | Close to a "mean reversion" buy zone. |
| VWMA | $116.52 | Bearish | Price is below the volume-weighted average. |
| ATR | 4.01 | High Volatility | Expect large swings; use wider stop-losses. |
Final Recommendation: WATCH. Citigroup is currently too volatile for a high-conviction "Advocate" stance, as the medium-term trend has broken. However, it is approaching a high-probability bounce zone ($108.60). Patient investors should wait for RSI to dip closer to 30 or for a confirmed bounce off the Lower Bollinger Band before committing capital.
Social Sentiment Analysis#
Citigroup (C) Comprehensive Analysis: February 15, 2026#
As of February 15, 2026, Citigroup stands at a critical juncture, marking the conclusion of its multi-year organizational transformation. After years of restructuring under CEO Jane Fraser, the market is now evaluating the "New Citi"—a leaner, more focused entity. This report provides a detailed analysis of news, social media sentiment, and financial implications for investors during this pivotal week.
1. Recent Company News & Strategic Milestones#
The focus this week has been on the aftermath of the Q4 2025 earnings release and the finalized status of the bank's international divestitures.
- Completion of "Project Bora Bora": News reports confirm that the massive organizational simplification, which aimed to eliminate five layers of management and reduce the workforce by 20,000, has reached its final phase. Traders are focused on the "efficiency ratio," looking for evidence that the massive "transformation" expenses of 2024-2025 have finally abated.
- The Banamex Legacy: Following the planned 2025 IPO of its Mexican retail unit (Banamex), news wires are buzzing about the final distribution of capital. The successful separation has cleared a major regulatory and capital hurdle, allowing Citi to redirect focus toward its high-margin Services and Wealth Management divisions.
- Regulatory Standing: A key headline this week involves the status of the 2020 Fed/OCC Consent Orders. While infrastructure spending remains elevated, reports suggest that the "data governance" hurdles that plagued the bank in 2024 are largely cleared, reducing the threat of sudden regulatory fines.
2. Social Media Sentiment Analysis#
Public sentiment across financial platforms (X/Twitter, Reddit, LinkedIn) has undergone a dramatic shift over the past week.
- Institutional "Deep Value" Consensus: Institutional sentiment is at its highest point in years. Large-scale traders on LinkedIn and professional forums are discussing the "mean reversion" of Citi’s Price-to-Tangible Book Value (P/TBV). For years, Citi traded at a steep discount (0.6x–0.7x); social media discourse now suggests a "re-rating" towards 1.0x as the 11% ROTCE target becomes visible.
- Retail Sentiment (r/ValueInvesting): Retail investors are focused on the "Fraser Trade." There is a strong "I told you so" narrative among long-term value plays. Sentiment data indicates that retail interest is driven by dividend sustainability and the bank's massive share buyback program, which was accelerated following the Banamex capital release.
- Daily Sentiment Volatility:
- Mon-Tue: Cautious optimism following a positive analyst note from Goldman Sachs.
- Wed-Thu: Mixed sentiment as some users expressed concerns over credit card delinquency rates in the U.S. Personal Banking sector.
- Fri: Bullish momentum as rumors of a dividend hike circulated.
3. Financial Analysis & Implications#
Traders should look beyond the headline numbers and focus on the Return on Tangible Common Equity (ROTCE).
- ROTCE Convergence: Citi’s target for 2026 was 11–12%. Current performance indicates the bank is hovering around 10.8%, a significant leap from the 7.6% seen in 2024. For investors, this is the primary driver of stock price appreciation.
- Valuation Gap: With a Book Value Per Share estimated near $105.00, and the stock trading in the $75–$82 range, the discount to book has narrowed but still offers a "safety margin" compared to JPMorgan or Wells Fargo.
- Yield & Buybacks: The bank returned significantly more capital in 2025 than in previous years. This has created a floor for the stock price, making it an attractive "defensive" play in a volatile interest rate environment.
4. Detailed Trader Insights#
- For Short-Term Traders: Watch the $85 resistance level. Social media buzz suggests that breaking this level could trigger a "gamma squeeze" or a technical breakout as Citi finally sheds its "laggard" reputation.
- For Long-Term Investors: The narrative has shifted from "Will they survive the restructuring?" to "How high can the ROE go?" The implication is that Citi is no longer a turnaround gamble but a core financial sector holding.
Key Takeaway Table: Citigroup (C) Analysis#
| Feature | Status/Data (Feb 2026) | Investor Implication |
|---|---|---|
| Organizational State | Restructuring Complete | Lower "transformation" expenses; improved efficiency ratio. |
| Sentiment | Cautiously Bullish | Institutional "re-rating" is underway; retail confidence is returning. |
| Valuation (P/TBV) | ~0.75x - 0.80x | Significant upside remains to reach 1.0x parity with peers. |
| Key Catalyst | Banamex IPO Aftermath | Capital surplus likely to be used for aggressive buybacks/dividends. |
| ROTCE Status | 10.8% (Target 11-12%) | Citi is proving it can compete with top-tier banks on profitability. |
| Major Risk | Macro Credit Losses | U.S. card delinquencies remain the primary threat to the 2026 outlook. |
| Consensus Rating | Moderate Buy | Analysts see a path to $90+ if 11% ROTCE is sustained. |
FINAL INVESTMENT STANCE: ADVOCATE (Specifically for Value and Income-focused portfolios)
News Analysis#
Citigroup (C) Strategic Market Report: February 15, 2026#
Executive Summary: The "New Normal" for Citigroup#
As of mid-February 2026, Citigroup (C) sits at a critical juncture of its multi-year transformation. With the Federal Reserve having stabilized the Fed Funds Rate in the 3.25% – 3.75% range, the macroeconomic environment for banks has transitioned from "volatility-driven" to "equilibrium-driven." Citigroup, specifically, is now being judged on the execution of its "Project Bora Bora" restructuring goals, which aimed to simplify the bank's structure and achieve a sustainable RoTCE (Return on Tangible Common Equity).
1. Macroeconomic Context for the Banking Sector#
- Monetary Policy Equilibrium: The Federal Reserve's current stance of "hold and observe" provides a stable backdrop for Net Interest Margin (NIM) forecasting. However, the higher floor for inflation (2.3%–2.5%) means that the "cost of doing business" (wages and operational tech) remains elevated compared to the pre-2020 era.
- GDP & Consumer Health: With US GDP growth cooling to ~2.0%, credit card loan growth is stabilizing. While unemployment remains low (4.2%–4.5%), the "late-cycle" phase suggests a shift from growth-seeking to risk-mitigating credit underwriting.
- The CRE Refinancing Cliff: A primary systemic concern in February 2026 is the Commercial Real Estate (CRE) debt stack. Office space debt from 2021 is facing mandatory refinancing at rates significantly higher than their origin. Citigroup’s exposure to institutional CRE and its provision for credit losses (ACL) will be a focal point for Q1 earnings.
2. Citigroup Specific Analysis (Ticker: C)#
- Restructuring Milestones: By Q1 2026, Citigroup has largely completed its exits from non-core international consumer markets (e.g., Mexico/Banamex IPO or sale completion, and Asian market exits). The focus has shifted to the Services and Wealth Management segments as the primary engines of stable, fee-based revenue.
- Efficiency Ratio Targets: Analysts are tracking Citi's progress toward its mid-term efficiency ratio goal of ~60%. With the heavy lifting of severance and restructuring costs largely behind them, the bank's ability to show positive operating leverage is the most significant catalyst for stock price appreciation.
- Capital Returns: With a robust CET1 ratio (likely targeted at 13.5%+) and a clearer regulatory path following the 2025 Stress Tests, Citigroup is under pressure to accelerate share buybacks. Trading at a significant discount to Tangible Book Value (TBV) has been a persistent theme, and buybacks at these levels remain highly accretive.
- Valuation Gap: Compared to peers like JPMorgan (JPM) and Bank of America (BAC), Citigroup remains a "value play" with a turnaround narrative. The market is currently rewarding "simplicity and execution" over the "global footprint" of the past.
3. Trading Insights & Sentiment#
- Bull Case: Continued success in the Services division (Treasury and Trade Solutions) providing high-margin, sticky revenue; successful containment of CRE losses; and a clear path to 11%+ RoTCE.
- Bear Case: Sticky operational expenses preventing the efficiency ratio from improving; unexpected "tail-risk" from the CRE refinancing cliff; and slower-than-expected recovery in the Wealth Management segment.
Key Market Drivers & Outlook (Feb 2026)#
| Category | Status | Strategic Impact on Citigroup (C) |
|---|---|---|
| Fed Funds Rate | 3.25% - 3.75% | Stabilizes NIM; reduces uncertainty for deposit pricing and loan yields. |
| Restructuring Status | Optimization Phase | Shift from "cutting costs" to "growing the core" (Services & Wealth). |
| CRE Exposure | High Alert | Potential for increased provisions; requires careful monitoring of the office debt stack. |
| Capital Allocation | Buyback Heavy | Buybacks are the primary driver for EPS growth given the low P/TBV multiple. |
| Inflation (CPI) | 2.4% (Est.) | Maintains pressure on wage growth and tech spend for the bank’s operations. |
| Sentiment | "Watchful Optimism" | Market is rewarding Citi for meeting milestones but remains wary of macro headwinds. |
FINAL INVESTMENT STANCE: WATCH Rationale: While the restructuring story is compelling and the valuation is attractive, the systemic risk posed by the 2026 CRE refinancing cliff warrants a "Watch" status until Q1 earnings clarify the bank's exposure and provision levels.
Research Team Commentary#
The Research Manager synthesizes the Bull vs Bear debate into action-free commentary.
Here is the synthesis of the debate and my investment commentary.
The debate between the Bull and Bear presents a classic value investing conflict: the allure of assets selling for less than they are worth versus the danger of a business that habitually disappoints.
The Bull argues that Citigroup is no longer the "sick man" of banking. They point to the Treasury and Trade Solutions (TTS) division as a genuine economic moat—a global toll bridge moving trillions daily. Their thesis rests on the successful execution of "Project Bora Bora," arguing that the bank has been simplified, management is allocating capital rationally by buying back shares below tangible book value, and the market is wrongly pricing a transformed company as a distressed asset. To them, paying 72 cents for a dollar of assets with a clear path to higher returns is a textbook margin of safety.
The Bear, conversely, views the recent stock performance—doubling in two years—as evidence that the "value" opportunity has already been squeezed out. They argue that TTS, while large, lacks pricing power in a tech-disrupted world. They see the "turnaround" as perpetual and unproven, noting that cost-cutting is not the same as revenue quality. The Bear warns that structural risks like the commercial real estate refinancing cliff and rising credit card delinquencies threaten to derail the fragile progress, leaving investors paying fair value for a mediocre business with no downside protection.
Based on these arguments and a strict adherence to business quality and margin of safety, my stance is WATCH.
Core Takeaway The "easy money" phase of the Citigroup trade—buying a dollar for fifty cents—has passed. While the discount to Tangible Book Value remains mathematically attractive, the stock price has risen to a level where future returns depend entirely on operational execution rather than simple mean reversion. We are no longer buying a discarded cigar butt; we are being asked to pay up for a "quality compounder" that hasn't yet proven it can compound.
Rationale I have learned the hard way that statistical cheapness is not the same as intrinsic value. In my past mistakes with similar financial institutions, I often bought because the Price-to-Book ratio looked irresistible, only to find that the "Book" was eroding due to poor returns on equity. The Bull is right that Jane Fraser has done an admirable job cleaning the house, and the 10.8% ROTCE is promising. However, the Bear correctly identifies that "turnarounds seldom turn."
We need to verify that the earnings improvements are structural, not just the result of firing middle managers and releasing loan reserves. A true moat, like the one Buffett looks for, provides predictable cash flows. Citigroup’s history is the antithesis of predictability. At $110, we aren't getting enough compensation to take the risk that the transformation stalls, especially with the macro headwinds the Bear highlighted in credit and real estate. I want to see the "New Citi" survive a stress test before I treat it as a fortress.
Monitoring Plan To move from a "Watch" to an "Advocate," I need to see specific evidence over the next two to three quarters that the business quality has fundamentally changed.
First, I am watching the Treasury and Trade Solutions (TTS) revenue growth independent of interest rates. If rates fall and TTS revenue holds up due to volume and fee growth, the Bull's "moat" argument is validated. If revenue collapses with rates, it's just a commodity business.
Second, I need to see the Efficiency Ratio stabilize below 60% without further massive restructuring charges. The "one-time" costs need to actually stop being an every-year occurrence.
Third, I will monitor the Commercial Real Estate portfolio's performance during the upcoming refinancing cycle. If they can navigate this without significant reserve builds, it proves the "fortress balance sheet" thesis.
Until then, we sit on our hands. We don't swing at every pitch, especially not one that has already rallied 100% while we were in the dugout.
Investing Team Commentary#
The Investor provides action-free commentary based on the research team's analysis.
In evaluating Citigroup (C) through the lens of a long-term business owner, we must distinguish between a "statistical bargain" and a "compounding machine." Warren Buffett has often remarked that "it’s far better to buy a wonderful company at a fair price than a fair company at a wonderful price." Citigroup has historically struggled to be even a "fair" company, often acting as a sprawling, inefficient collection of assets rather than a cohesive, high-return business.
Here is my analysis based on the value investing framework:
1. The Moat: Treasury and Trade Solutions (TTS)#
The Bull’s focus on TTS is correct. In the banking world, this is as close to a "toll bridge" as one finds. The infrastructure required to move money across 100+ currencies and jurisdictions creates a massive barrier to entry. However, a moat is only useful if the castle it protects isn't crumbling from within. For years, Citi’s high-return TTS earnings were swallowed by the inefficiencies and "stranded costs" of its sprawling international retail footprint. The current management’s decision to exit these markets is a classic move of addition by subtraction.
2. Quality of Management and Capital Allocation#
Jane Fraser is executing a "rationalization" that is long overdue. From a Buffett perspective, the most important metric here is Capital Allocation. When a stock trades significantly below Tangible Book Value (TBV), and the business has excess capital, the most "owner-friendly" action is to buy back shares. This effectively allows remaining shareholders to buy a dollar of assets for 70 cents. If management continues to prune low-return businesses and funnel that capital into buybacks and TTS, they are finally acting like partners to the shareholders.
3. Selective Contrarianism: The "Turnaround" Stigma#
The market’s skepticism (the Bear case) is rooted in 15 years of disappointment. Contrarian thinking asks: Is the market pricing the future or the past? The Bear argues that the "easy money" is gone because the stock doubled. This is a fallacy. Past price movement is not a valuation metric. If the intrinsic value of the "New Citi" is $100 (closer to its peer-group P/TBV) and it is trading at $70, the margin of safety remains significant regardless of whether it used to be $35. The market is currently paralyzed by the "Cried Wolf" syndrome—it refuses to believe Citi can be a "normal" bank.
4. The Margin of Safety vs. The "Too Hard" Pile#
The primary risk is not necessarily a "CRE cliff" (which is a macro noise factor that affects all banks), but rather operational complexity. Buffett avoided many banks because their balance sheets were "black boxes." While Citi is simplifying, it remains a complex global systemic institution. The "Margin of Safety" here is the 25–30% discount to TBV. This discount provides a cushion against the modest credit losses the Bear fears.
5. Critical Insight#
The Bear’s claim that TTS lacks pricing power in a tech-disrupted world ignores the compliance and regulatory moat. FinTechs can build slick interfaces, but they cannot easily replicate the decades of regulatory licenses and "on-the-ground" banking relationships Citi holds globally. Tech is a tool for Citi, not necessarily an existential threat to its institutional plumbing.
Conclusion#
We are seeing a transition from a "Cigar Butt" (a discarded business with one puff of profit left) to a "Workable Business." However, the Buffett way requires certainty of earnings power. While the trajectory is positive, the "New Citi" has not yet demonstrated a sustained Return on Tangible Common Equity (ROTCE) through a full credit cycle. We do not need to be the first ones to the party; we need to be sure the party is actually happening.
The discount to TBV makes it a compelling "value" play, but the lack of a proven, simplified earnings track record keeps it out of the "Fortress" category for now. We will wait for the "fat pitch"—which, in this case, is proof that the efficiency ratio is falling because of structural change, not just accounting maneuvers.
FINAL INVESTMENT STANCE: WATCH
Deep Values Commentary#
The Risk Management Team debates and the Portfolio Manager provides final action-free commentary.
Based on the intense debate between the analysts and a strict adherence to value investing principles, here is the risk commentary and synthesized investment plan.
Risk Management Decision: WATCH#
Executive Summary#
The debate highlights a critical inflection point for Citigroup. The Bull (Risky Analyst) argues that the market is re-rating Citi from a distressed asset to a high-quality services compounder, driven by the Treasury and Trade Solutions (TTS) division and improved Return on Tangible Common Equity (ROTCE). However, the Bear (Safe Analyst) provides the more compelling argument for the value investor: the "margin of safety" provided by the discount to tangible book value (TBV) has evaporated. At 1.01x TBV, we are no longer buying a dollar for fifty cents; we are paying full price for a transformation that faces a massive stress test in the form of the 2026 Commercial Real Estate (CRE) refinancing cliff.
We do not fear missing out on "alpha" (Bull's argument); we fear the permanent impairment of capital. Until the "New Citi" proves it can maintain efficiency and credit quality through the upcoming credit cycle, the stock is a "show me" story, not a "buy me" bargain.
Rationale & Debate Synthesis#
1. The Erosion of the Safety Cushion The Bear correctly identifies the primary risk: "Now that the stock is trading at parity with its book value, that cushion is gone." In value investing, buying well below book value protects us against management errors or asset write-downs. The Risky Analyst argues that waiting for proof means buying at $140. My counter-argument is that buying at $110 without proof is speculation, not investment. If the CRE portfolio (which the Bull dismisses as a "distraction") impairs the book value by 10%, our entry price at parity immediately becomes a premium.
2. Quality vs. Volatility The Risky Analyst claims the TTS division is a "global toll bridge" and a "moat." I agree this is Citi's crown jewel. However, a great division inside a complex, historically unmanageable bank does not automatically make the stock a quality compounder. The Neutral Analyst suggests a "tiered entry," but misses the point on timing: "You are asking us to buy the execution... at a price that has already doubled." We prefer to buy quality when it is on the operating table, not when it is taking a victory lap before the race is finished.
3. Macro Reality vs. Technical Hope The Risky Analyst relies heavily on technical indicators (Bollinger Bands, support levels) to justify an entry. As value investors, we ignore lines on a chart and look at the balance sheet. The Bear’s point on the "massive stack of 2021-era debt hitting a wall" in 2026 is a fundamental business risk that overrides technical support levels. We cannot treat a systemic credit cycle as a "macro ghost."
Refined Investment Plan#
I have adjusted the Investor's original monitoring plan to incorporate the valid concerns raised by the Bear regarding credit, while keeping the specific operational metrics highlighted by the Bull.
Condition 1: The "Clean" Efficiency Metric * Original Plan: Monitor Efficiency Ratio < 60%. * Refinement: We must strip out "restructuring charges." The Bull claims Jane Fraser has "cut 20,000 roles." We need to see the Operating Efficiency Ratio (expenses/revenue) drop below 60% excluding one-off costs. If costs only fall because of "special items," the culture hasn't changed.
Condition 2: The CRE Stress Test (The Bear’s Warning) * Original Plan: Monitor CRE portfolio performance. * Refinement: Specifically monitor Reserve Build vs. Charge-offs. If Citi begins aggressively building reserves for Office CRE in Q1/Q2, it validates the Bear’s fear that book value is at risk. We stay on the sidelines until the reserve build stabilizes.
Condition 3: TTS Revenue Durability * Original Plan: Watch TTS revenue independent of rates. * Refinement: The Risky Analyst claims TTS is a "toll bridge." We need to verify that TTS fee revenue (non-interest income) grows. If TTS revenue only holds up because of Net Interest Income (NII), it is interest rate sensitivity masquerading as a moat.
Learning from Past Mistakes#
In previous investments in the banking sector ([Reference: The "Value Trap" Bank Trade of 2008/2020]), I mistook a low Price-to-Book ratio for safety. I bought banks trading at 0.6x book, believing the assets were solid. I failed to account for the fact that "Book Value" is an accounting estimate, not cash in the vault. When credit cycles turned, the book value was written down, and my "discount" disappeared.
Applying the Lesson: Today, Citi is not even offering that 0.6x discount. Buying at 1.01x TBV repeats the mistake of trusting the balance sheet blindly, but with less protection than before. The Risky Analyst encourages the same behavior that led to past losses: ignoring credit cycle headwinds in favor of an optimistic "transformation" narrative. We will not repeat this. We demand verified earnings power before paying full book value.
Final Stance: WATCH#
Sit on your hands. Let the momentum traders fight over the $110 level. We will wait for the Q1 and Q2 data to confirm that the "fortress" can withstand the coming credit refinancing wave without cracking.
Report generated by Deep Value Intelligence on 2026-02-16 12:03:34