
Company Research INTUDeep Value Intelligence
Intuit (INTU) Deep Value Intelligence Report

In briefNeutral3.74
As of May 17, 2026, DeepValues Research rates Intuit (INTU) Neutral (WATCH, score 3.74/5). Intuit remains a high-quality software franchise with durable competitive advantages, strong cash generation, and impressive long-term compounding in revenue, earnings, and free cash flow. Key figures: share price $393; P/E (TTM) 25.57; free-cash-flow yield 5.6%; ROE 19.6%.
Source: https://research.deepvalues.ai/company/intu/2026-05-17-en/ · Markdown · More on Intuit (INTU)
Key takeaways
Intuit remains a high-quality software franchise with durable competitive advantages, strong cash generation, and impressive long-term compounding in revenue, earnings, and free cash flow. The key issue is not business quality; it is valuation confidence after a sharp stock decline, combined with some uncertainty around how much of recent growth and margin recovery can persist. At the current price near $393, the stock looks far more reasonable than it did during the 2021-2025 period, but it is not an obvious deep-value Buffett bargain unless one assumes sustained double-digit owner earnings growth.
Contents
- Intelligence Summary
- Thesis + Conditions
- Analyst Team Reports
- Fundamentals Analysis
- Intrinsic Value Analysis (Buffett)
- Trend & Growth Analysis (Lynch/Druckenmiller/Fisher)
- Market Technical Analysis
- News & Events Analysis
- Guru Attention Analysis
- Options Market Analysis
- Research Team Commentary
- Value Investing Team Commentary
- Deep Values Commentary
Intelligence Summary#
Thesis + Conditions#
Core Thesis: Executive Briefing
Key Risks: - Intuit looks like a strong, Buffett-compatible business, but not a clear Buffett-style bargain at $393. The key risk is not business fragility; it is paying a fair-to-full price for a great company while its moat faces an AI and competitive transition. Long-term business quality remains attractive-strong growth, high margins, solid returns on capital, sticky workflows-but the margin of safety is thin. Best course: keep it on an active watchlist, or build only a small starter position if disciplined, and wait for either a better price or clearer proof that AI strengthens the moat rather than narrows it. - ## Risk Commentary for the Long-Term Investor - > Intuit is a wonderful business, but the stock deserves patience. WATCH. - > WATCH, with conditional accumulation only. - > For a long-term investor, Intuit is a high-quality franchise worth owning at the right price. At today's price, it is better treated as a disciplined watchlist candidate or small phased entry, not a full-conviction value buy.
Confidence: Low
Analyst Team Reports#
Fundamentals Analysis#
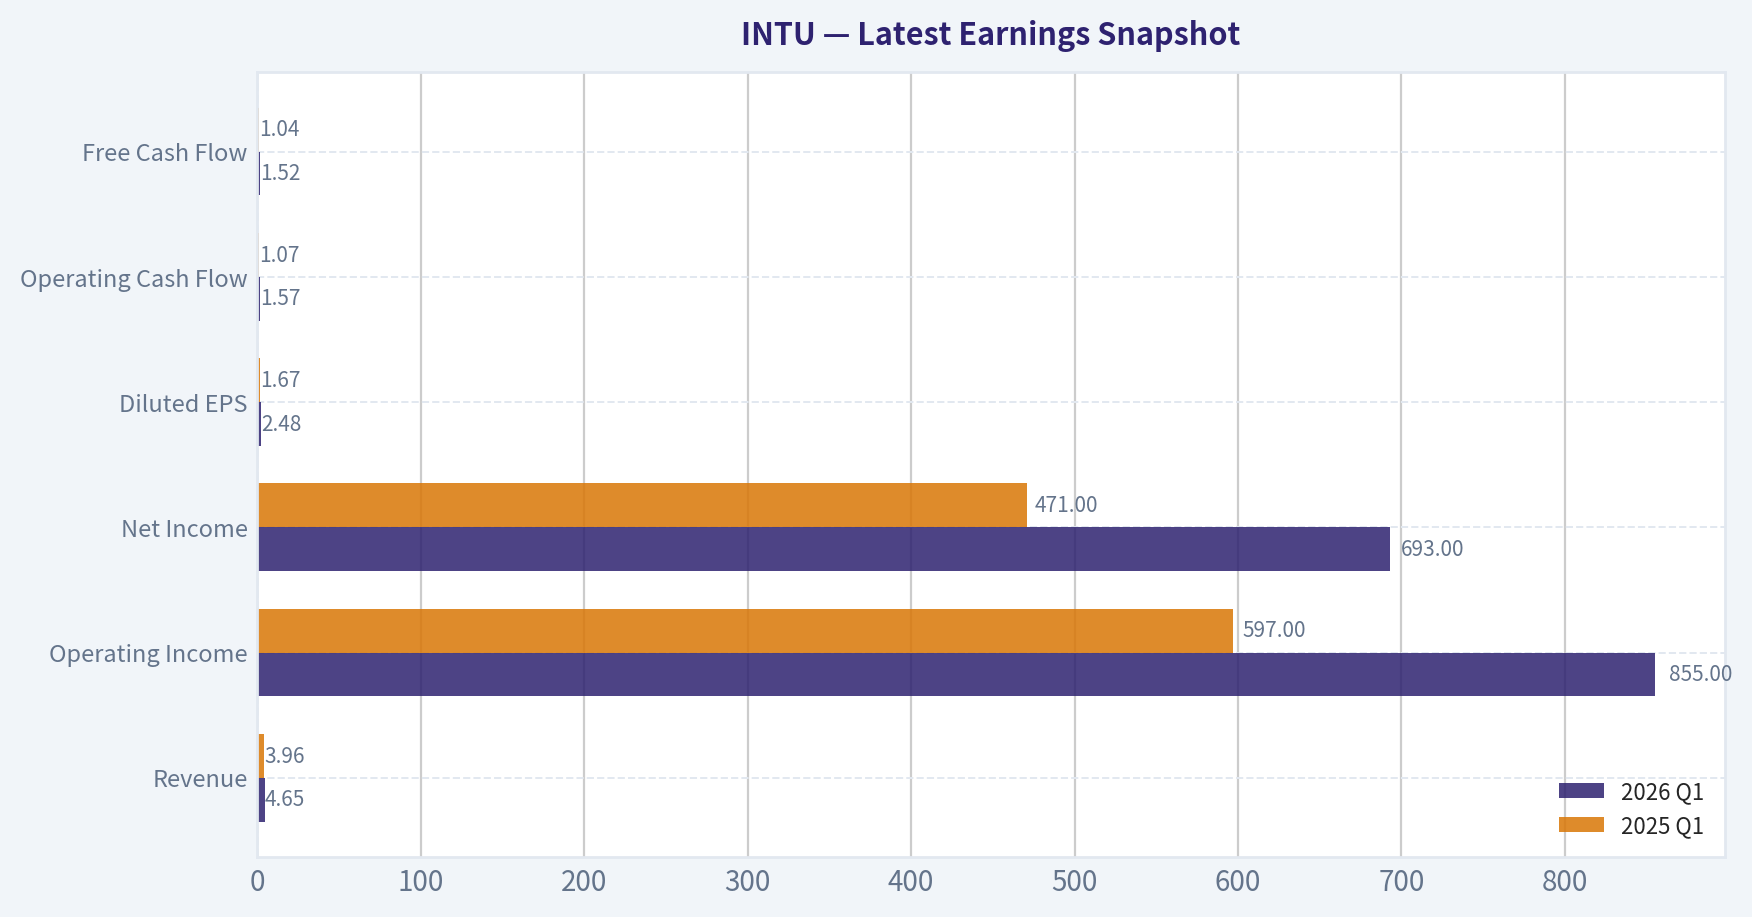
Latest Earnings Snapshot#
Most recent reported quarter anchored on 2026 Q1, with prior-year comparison when available.
| Metric | 2026 Q1 | 2025 Q1 | YoY Change |
|---|---|---|---|
| Revenue | $4.65B | $3.96B | +17.4% |
| Operating Income | $855.0M | $597.0M | +43.2% |
| Net Income | $693.0M | $471.0M | +47.1% |
| Diluted EPS | $2.48 | $1.67 | +48.5% |
| Operating Cash Flow | $1.57B | $1.07B | +46.9% |
| Free Cash Flow | $1.52B | $1.04B | +46.8% |
Key Takeaways: This snapshot anchors the most recent reported quarter before the narrative analysis. It helps readers separate long-run business quality from whatever changed in the latest earnings print.
10-Year Financial Metrics for INTU#
All values below are computed deterministically from raw data - not estimated by AI.
Issuer profile: operating company (Technology / Software - Application).
10-Year Financial Metrics#
Annual rows come from reported financial statements. The final TTM row is computed from the latest four quarters.
| Metric | 2009 | 2010 | 2011 | 2012 | 2013 | 2014 | 2015 | 2016 | 2017 | 2018 | 2019 | 2020 | 2021 | 2022 | 2023 | 2024 | 2025 | 2026 TTM |
|---|---|---|---|---|---|---|---|---|---|---|---|---|---|---|---|---|---|---|
| Market Price | $26 | $35 | $41 | $52 | $57 | $74 | $97 | $103 | $129 | $194 | $265 | $295 | $513 | $444 | $502 | $639 | $780 | $393 |
| Market Cap | $9.80B | $12.92B | $14.80B | $17.70B | $19.37B | $23.85B | $30.25B | $29.41B | $35.81B | $53.31B | $73.21B | $80.88B | $144.68B | $129.55B | $144.81B | $183.85B | $222.19B | $110.04B |
| P/E Ratio | 22.00 | 22.46 | 23.35 | 22.32 | 22.59 | 26.27 | 82.63 | 30.08 | 36.30 | 40.13 | 47.08 | 44.27 | 70.10 | 62.66 | 60.77 | 62.07 | 57.43 | 25.45 |
| P/B Ratio | 3.83 | 4.58 | 5.66 | 6.45 | 5.49 | 7.75 | 12.97 | 19.71 | 21.08 | 18.93 | 19.53 | 15.84 | 14.66 | 7.88 | 8.39 | 9.97 | 11.27 | 5.77 |
| ROE | 17.5% | 20.3% | 24.2% | 28.9% | 24.3% | 29.5% | 15.7% | 65.6% | 58.0% | 47.2% | 41.5% | 35.8% | 20.9% | 12.6% | 13.8% | 16.1% | 19.6% | 22.8% |
| ROIC | 28.7% | 19.8% | 22.4% | 27.7% | 28.3% | 29.7% | 18.5% | 43.6% | 57.7% | 76.7% | 79.3% | 88.0% | 35.3% | 14.0% | 12.3% | 14.7% | 18.1% | 18.8% |
| EPS | $1.19 | $1.55 | $1.76 | $2.31 | $2.54 | $2.83 | $1.17 | $3.42 | $3.55 | $4.82 | $5.63 | $6.66 | $7.32 | $7.09 | $8.42 | $10.43 | $13.67 | $15.44 |
| Revenue | $3.11B | $3.40B | $3.45B | $3.81B | $3.95B | $4.24B | $4.19B | $4.69B | $5.20B | $6.03B | $6.78B | $7.68B | $9.63B | $12.73B | $14.37B | $16.29B | $18.83B | $20.12B |
| Gross Profit | $2.95B | $3.26B | $3.31B | $3.66B | $3.82B | $4.11B | $4.05B | $4.56B | $5.08B | $5.05B | $5.62B | $6.30B | N/A | N/A | N/A | N/A | N/A | $16.11B |
| Gross Margin | 95.0% | 95.8% | 95.9% | 96.2% | 96.8% | 96.8% | 96.7% | 97.2% | 97.7% | 83.8% | 82.8% | 82.1% | N/A | N/A | N/A | N/A | N/A | 80.1% |
| Operating Margin | 22.0% | 26.6% | 31.4% | 30.7% | 30.6% | 30.6% | 17.6% | 26.5% | 27.3% | 25.9% | 27.3% | 28.3% | 26.0% | 20.2% | 21.9% | 22.3% | 26.1% | 27.1% |
| Net Income | $447.0M | $574.0M | $634.0M | $792.0M | $858.0M | $907.0M | $365.0M | $979.0M | $985.0M | $1.33B | $1.56B | $1.83B | $2.06B | $2.07B | $2.38B | $2.96B | $3.87B | $4.34B |
| Net Margin | 14.4% | 16.9% | 18.4% | 20.8% | 21.7% | 21.4% | 8.7% | 20.9% | 19.0% | 22.1% | 23.0% | 23.8% | 21.4% | 16.2% | 16.6% | 18.2% | 20.5% | 21.6% |
| Revenue Growth | N/A | 9.5% | 1.4% | 10.4% | 3.6% | 7.5% | -1.2% | 12.0% | 10.7% | 16.0% | 12.6% | 13.2% | 25.4% | 32.1% | 12.9% | 13.3% | 15.6% | 6.9% |
| Net Income Growth | N/A | 28.4% | 10.5% | 24.9% | 8.3% | 5.7% | -59.8% | 168.2% | 0.6% | 34.9% | 17.2% | 17.3% | 12.9% | 0.2% | 15.4% | 24.3% | 30.6% | 12.2% |
| Free Cash Flow Growth | N/A | 35.7% | -2.7% | 23.6% | 11.3% | 8.5% | 7.8% | -27.9% | 43.4% | 38.5% | 8.4% | 4.8% | 35.8% | 16.7% | 29.6% | -3.0% | 30.5% | 11.7% |
| Total Book Value | $2.56B | $2.82B | $2.62B | $2.74B | $3.53B | $3.08B | $2.33B | $1.49B | $1.70B | $2.82B | $3.75B | $5.11B | $9.87B | $16.44B | $17.27B | $18.44B | $19.71B | $19.05B |
| Total Assets | $4.83B | $5.20B | $5.11B | $4.68B | $5.49B | $5.20B | $4.97B | $4.25B | $4.07B | $5.13B | $6.28B | $10.93B | $15.52B | $27.73B | $27.78B | $32.13B | $36.96B | $34.28B |
| Total Debt | N/A | $998.0M | $999.0M | $499.0M | $499.0M | $499.0M | $500.0M | $1.00B | $488.0M | $438.0M | $436.0M | $3.37B | $2.03B | $6.91B | $6.12B | $6.04B | $5.97B | $6.89B |
| Debt-to-Equity | N/A | 0.35 | 0.38 | 0.18 | 0.14 | 0.16 | 0.21 | 0.67 | 0.29 | 0.16 | 0.12 | 0.66 | 0.21 | 0.42 | 0.35 | 0.33 | 0.30 | 0.36 |
| Cash & Equivalents | $679.0M | $214.0M | $722.0M | $393.0M | $1.01B | $849.0M | $808.0M | $638.0M | $529.0M | $1.46B | $2.12B | $6.44B | $2.56B | $2.80B | $2.85B | $3.61B | $2.88B | $2.94B |
| Shareholders' Equity | $2.56B | $2.82B | $2.62B | $2.74B | $3.53B | $3.08B | $2.33B | $1.49B | $1.70B | $2.82B | $3.75B | $5.11B | $9.87B | $16.44B | $17.27B | $18.44B | $19.71B | $19.05B |
| Operating Cash Flow | $812.0M | $998.0M | $1.01B | $1.25B | $1.37B | $1.45B | $1.59B | $1.46B | $1.60B | $2.11B | $2.32B | $2.41B | $3.25B | $3.89B | $5.05B | $4.88B | $6.21B | $6.98B |
| Investing Cash Flow | $-432.0M | $-997.0M | $497.0M | $-225.0M | $-485.0M | $-49.0M | $-182.0M | $371.0M | $-17.0M | $-532.0M | $-635.0M | $-97.0M | $-3.96B | $-5.42B | $-922.0M | $-227.0M | $-2.32B | $-1.14B |
| Free Cash Flow | $681.0M | $924.0M | $899.0M | $1.11B | $1.24B | $1.34B | $1.45B | $1.04B | $1.50B | $2.07B | $2.25B | $2.35B | $3.20B | $3.73B | $4.84B | $4.69B | $6.12B | $6.84B |
| FCF Margin | 21.9% | 27.2% | 26.1% | 29.2% | 31.3% | 31.6% | 34.5% | 22.2% | 28.8% | 34.4% | 33.1% | 30.7% | 33.2% | 29.3% | 33.7% | 28.8% | 32.5% | 34.0% |
| Dividends / Share | $0.00 | $0.00 | $0.00 | $0.00 | $0.00 | $0.00 | $0.00 | $0.00 | $0.00 | $0.00 | $0.00 | $0.00 | $0.00 | $2.65 | $3.14 | $3.64 | $4.20 | $4.55 |
Profitability Metrics#
- Return on Equity (ROE): 19.6%
- Return on Invested Capital (ROIC): 17.3%
- Return on Assets (ROA): 10.5%
- Gross Margin: N/A
- Operating Margin: 26.1%
- Net Profit Margin: 20.5%
Liquidity Metrics#
- Current Ratio: 1.36
- Quick Ratio: 0.49
Leverage Metrics#
- Debt-to-Equity Ratio: 0.30
- Interest Coverage Ratio: 19.93
- Net Debt: $3.09B
Growth Metrics (Year-over-Year)#
- Revenue Growth: 15.6%
- Net Income Growth: 30.6%
- Free Cash Flow Growth: 30.5%
- Revenue CAGR (3-Year): 14.0%
- Revenue CAGR (5-Year): 19.7%
Valuation Metrics#
- P/E Ratio (TTM): 25.57
- Forward P/E: 14.84
- Price-to-Book: 5.72
- Price-to-Sales: 5.44
- PEG Ratio: 1.01
- EV/EBITDA: 18.44
- Free Cash Flow Yield: 5.6%
- Earnings Yield: 3.9%
Owner Earnings (Buffett Method, Code-Computed)#
- Net Income: $3.87B
-
- Depreciation & Amortization: $809.0M
-
- Capital Expenditures: $-84.0M
-
- Working Capital Changes: $-206.0M
- = Owner Earnings: $4.80B
Intrinsic Value (Code-Computed)#
- Current Price: $393
- Buffett Method (Owner Earnings): Conservative: $326 Average: $416 Optimistic: $1,254
- Cash Flow Method (FCF): Conservative: $353 Average: $464 Optimistic: $835
Piotroski F-Score: 8/9#
- Positive Net Income: PASS
- Positive Operating Cash Flow: PASS
- ROA Improvement: PASS
- Cash Flow > Net Income: PASS
- Decreasing Debt: PASS
- Improving Current Ratio: PASS
- No Dilution: PASS
- Improving Gross Margin: FAIL
- Improving Asset Turnover: PASS
ANALYST STANCE: WATCH
Intuit (INTU) - Buffett-Style Fundamental Analysis#
Intuit remains a high-quality software franchise with durable competitive advantages, strong cash generation, and impressive long-term compounding in revenue, earnings, and free cash flow. The key issue is not business quality; it is valuation confidence after a sharp stock decline, combined with some uncertainty around how much of recent growth and margin recovery can persist. At the current price near $393, the stock looks far more reasonable than it did during the 2021-2025 period, but it is not an obvious deep-value Buffett bargain unless one assumes sustained double-digit owner earnings growth.
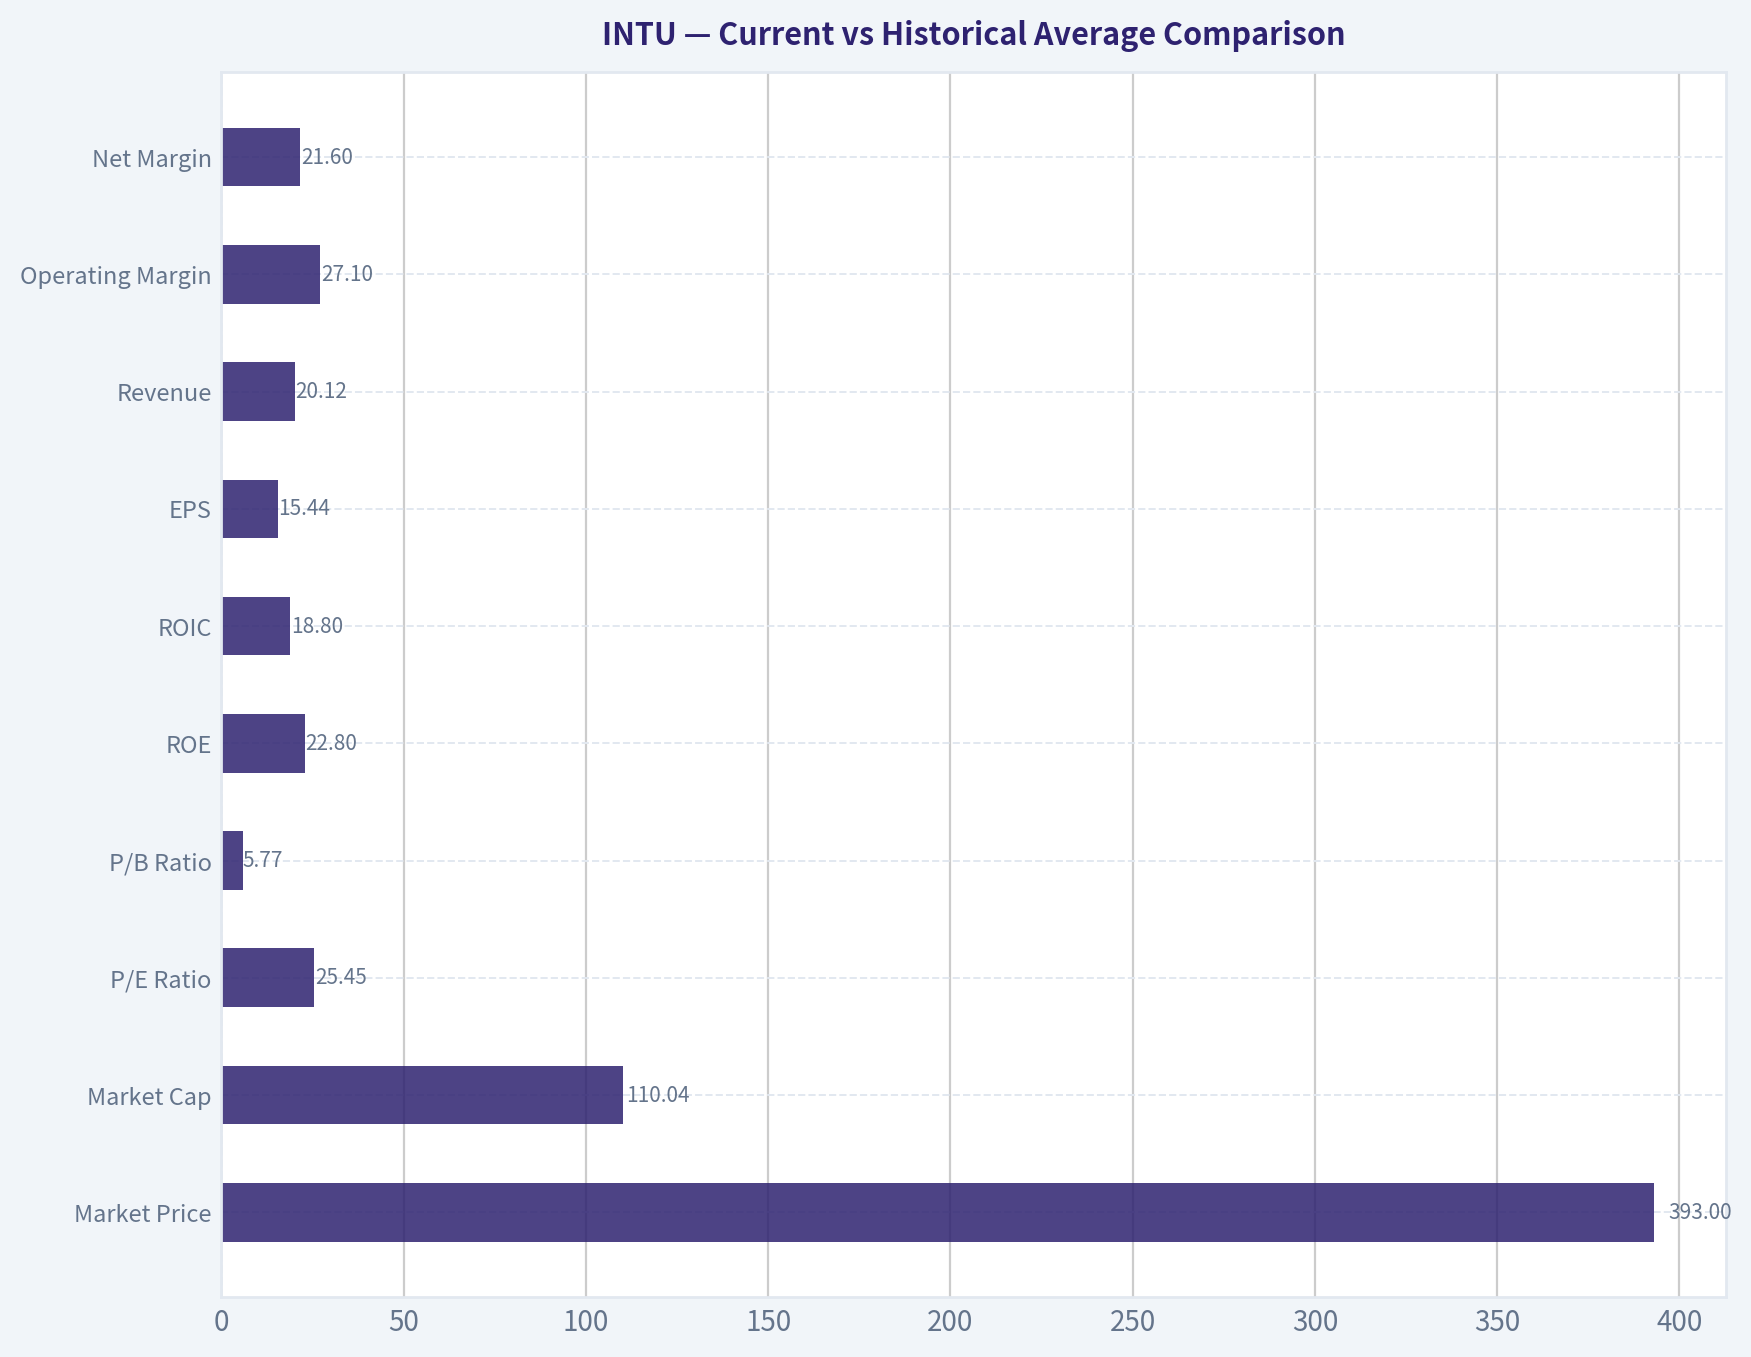
Current vs Historical Average Comparison#
| Metric | Current / TTM | Historical Context | Interpretation |
|---|---|---|---|
| Market Price | $393 | 2025: $780 | Stock has fallen roughly 50% from the latest annual level, compressing valuation sharply. |
| Market Cap | $110.04B | 2025: $222.19B | Equity value has been cut in half despite continued operating growth. |
| P/E Ratio | 25.45 | Approx. 10-yr avg (2016-2025): ~51 | Valuation is materially below its own recent history. |
| P/B Ratio | 5.77 | Approx. 10-yr avg (2016-2025): ~14.7 | Price-to-book has compressed dramatically as equity grew and share price fell. |
| ROE | 22.8% | Approx. 10-yr avg (2016-2025): ~33.7% | Current ROE is healthy, though below the extreme asset-light highs of prior years. |
| ROIC | 18.8% | Approx. 10-yr avg (2016-2025): ~44.6% | Still strong, but no longer at the exceptional pre-acquisition levels. |
| EPS | $15.44 | 2025: $13.67 | Earnings power continues to rise despite market multiple compression. |
| Revenue | $20.12B | Approx. 10-yr avg (2016-2025): ~$10.82B | Scale has nearly doubled versus the recent decade average. |
| Operating Margin | 27.1% | Approx. 10-yr avg (2016-2025): ~25.2% | Margin is above long-term average and improving. |
| Net Margin | 21.6% | Approx. 10-yr avg (2016-2025): ~20.2% | Profitability has recovered to above-normal levels. |
| Revenue Growth | 6.9% | Approx. 10-yr avg (2016-2025): ~15.4% | Growth has slowed versus the decade norm. |
| Net Income Growth | 12.2% | Approx. 10-yr avg (2016-2025): ~32.2% | Positive, but below the distorted long-term average due to rebound years. |
| FCF Growth | 11.7% | Approx. 10-yr avg (2016-2025): ~18.0% | Cash flow growth remains solid, though slower than its stronger historical pace. |
| Total Debt | $6.89B | 2025: $5.97B | Debt is manageable but has drifted higher in TTM. |
| Debt-to-Equity | 0.36 | Approx. 10-yr avg (2016-2025): ~0.34 | Leverage is still moderate and within historical norms. |
| Cash & Equivalents | $2.94B | 2025: $2.88B | Liquidity remains adequate, though not excessive relative to debt. |
| Free Cash Flow | $6.84B | Approx. 10-yr avg (2016-2025): ~$3.18B | Current cash generation is far above historical average. |
| Dividends / Share | $4.55 | Since 2022 initiation | Dividend growth is steady, but payout remains secondary to reinvestment. |
Key Takeaways: Intuit's business fundamentals are stronger than ever in absolute dollars, with record revenue, EPS, net income, and free cash flow. The main change is valuation: the market now values the company at much lower earnings and book multiples than its own history. That creates a more balanced setup, but current growth is also slower than the company's post-2018 pace.
Market Metrics#
Intuit's current market price of $393 is a dramatic reset from $780 in 2025 and well below the $639-$780 range seen in 2024-2025. This matters because the business itself did not collapse; revenue rose from $18.83B to $20.12B TTM and EPS from $13.67 to $15.44. In Buffett terms, this is exactly the kind of situation where Mr. Market may be offering a better entry price for the same underlying franchise.
The current P/E of 25.45 is much lower than nearly every year in the dataset after 2015. From 2018 through 2025, Intuit often traded between roughly 40x and 70x earnings, reflecting premium expectations for durable software growth. Today's multiple is still not "cheap" in an absolute market sense, but for Intuit it is inexpensive relative to its own history.
The current P/B of 5.77 is also a major compression from 7.88 to 21.08 across 2016-2025. Because Intuit is an asset-light software company, P/B is less useful than earnings and cash flow multiples, but the lower multiple still indicates much less optimism is embedded in the stock.
Overall, market metrics suggest the stock has rerated from "premium growth compounder" to "quality franchise with moderated expectations."
Profitability Analysis#
| Profitability Metric | Current / TTM | Long-Term Trend | Buffett-Style Interpretation |
|---|---|---|---|
| ROE | 22.8% | Strong for entire period; peaked much higher in 2016-2020 | Excellent, though prior peaks were inflated by low equity base. |
| ROIC | 18.8% | Exceptional historically; lower after acquisitions | Still strong enough to support moat and value creation. |
| EPS | $15.44 | Rose from $1.19 in 2009 to $15.44 TTM | Outstanding per-share compounding. |
| Revenue | $20.12B | Rose from $3.11B in 2009 | Clear long-duration expansion platform. |
| Gross Profit | $16.11B TTM | Historically very high gross margin structure | Confirms powerful software economics even after mix changes. |
| Operating Margin | 27.1% | Mostly mid-20s to low-30s | Stable and improving. |
| Net Income | $4.34B TTM | Up nearly 10x from 2009 | Strong evidence of earnings durability. |
| Net Margin | 21.6% | Mostly mid-teens to low-20s | Healthy and back above long-term average. |
Key Takeaways: Intuit remains a very profitable business with elite software characteristics. ROE and ROIC are no longer at the extraordinary peaks seen when the balance sheet was thinner, but they remain strong enough to signal good capital efficiency. Margin recovery in the latest period suggests the company has regained operating leverage after digesting acquisitions.
A few finer points matter here:
- Revenue has compounded from $3.11B in 2009 to $20.12B TTM, showing not just resilience but successful platform expansion.
- EPS has compounded even faster, from $1.19 to $15.44, suggesting both operating leverage and shareholder-friendly capital allocation.
- Gross margin, where available, stayed extraordinarily high for years and remains 80.1% TTM, confirming that this is still a structurally advantaged software model.
- Operating margin dipped to 20.2% in 2022 after acquisition-related integration pressure, but has recovered to 27.1% TTM, a strong sign.
For Buffett, predictable and high returns on capital are central. Intuit passes that test, though the spectacular ROIC figures from 2018-2020 are unlikely to be the best baseline going forward.
Growth Metrics#
Revenue growth has been one of Intuit's greatest strengths. The company posted mostly positive growth across the full period, with only one decline in 2015 (-1.2%). Recent growth was especially strong in 2021-2025, ranging from 12.9% to 32.1%, though TTM has slowed to 6.9%.
Net income growth has been more volatile, including a -59.8% drop in 2015 and a +168.2% rebound in 2016. Outside those distortions, earnings growth has generally been healthy and positive. TTM net income growth of 12.2% is solid, but not explosive.
Free cash flow growth has also been strong over time, with occasional volatility. TTM FCF growth is 11.7%, down from 30.5% in 2025 but still attractive for a company of this scale.
From a Buffett lens, the most important question is not whether growth is still positive; it is whether the earnings stream remains sufficiently predictable. The answer is mostly yes. Intuit's growth has slowed, but the slowdown is from a very high base, and the business remains fundamentally compounding.
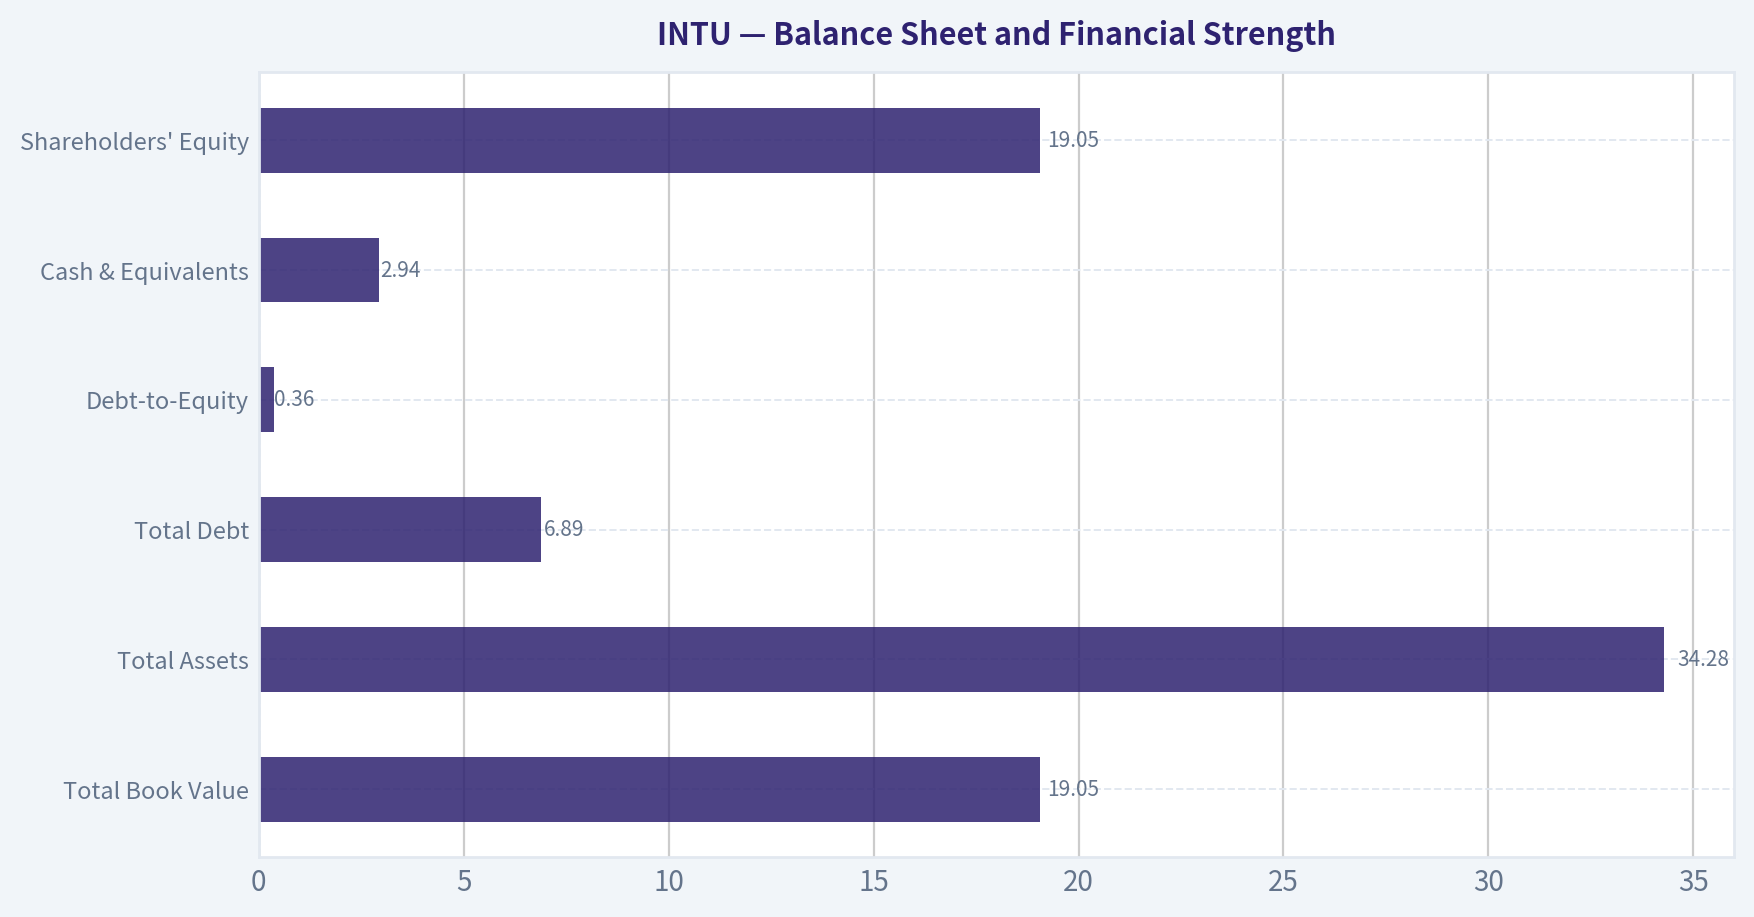
Balance Sheet and Financial Strength#
| Balance Sheet Metric | Current / TTM | Historical Reading | Assessment |
|---|---|---|---|
| Total Book Value | $19.05B | Up sharply from $1.49B in 2016 | Balance sheet has become much stronger in scale. |
| Total Assets | $34.28B | Up from $4.25B in 2016 | Larger platform, partly acquisition-driven. |
| Total Debt | $6.89B | Above 2025's $5.97B but below alarming levels | Manageable for cash flow generation. |
| Debt-to-Equity | 0.36 | In line with long-term norm | Moderate leverage, not excessive. |
| Cash & Equivalents | $2.94B | Stable vs 2025 | Good liquidity cushion. |
| Shareholders' Equity | $19.05B | Large increase over decade | More substantial capital base than in prior high-ROE years. |
Key Takeaways: Intuit's balance sheet is healthy rather than pristine. Debt is meaningful, but well supported by cash flow and not out of character for the company's post-acquisition structure. The company has evolved from a very light balance sheet into a larger, more diversified platform with moderate leverage.
The main nuance is that debt rose materially after 2020, likely associated with strategic expansion. That reduced some of the ultra-high capital efficiency optics seen in earlier years, but not to a dangerous degree. With interest coverage near 19.93 and net debt around $3.09B, financial strength remains solid.
Buffett generally prefers companies that do not need much debt to earn attractive returns. Intuit is not debt-free, but it is still comfortably within acceptable territory for a recurring-revenue software leader.
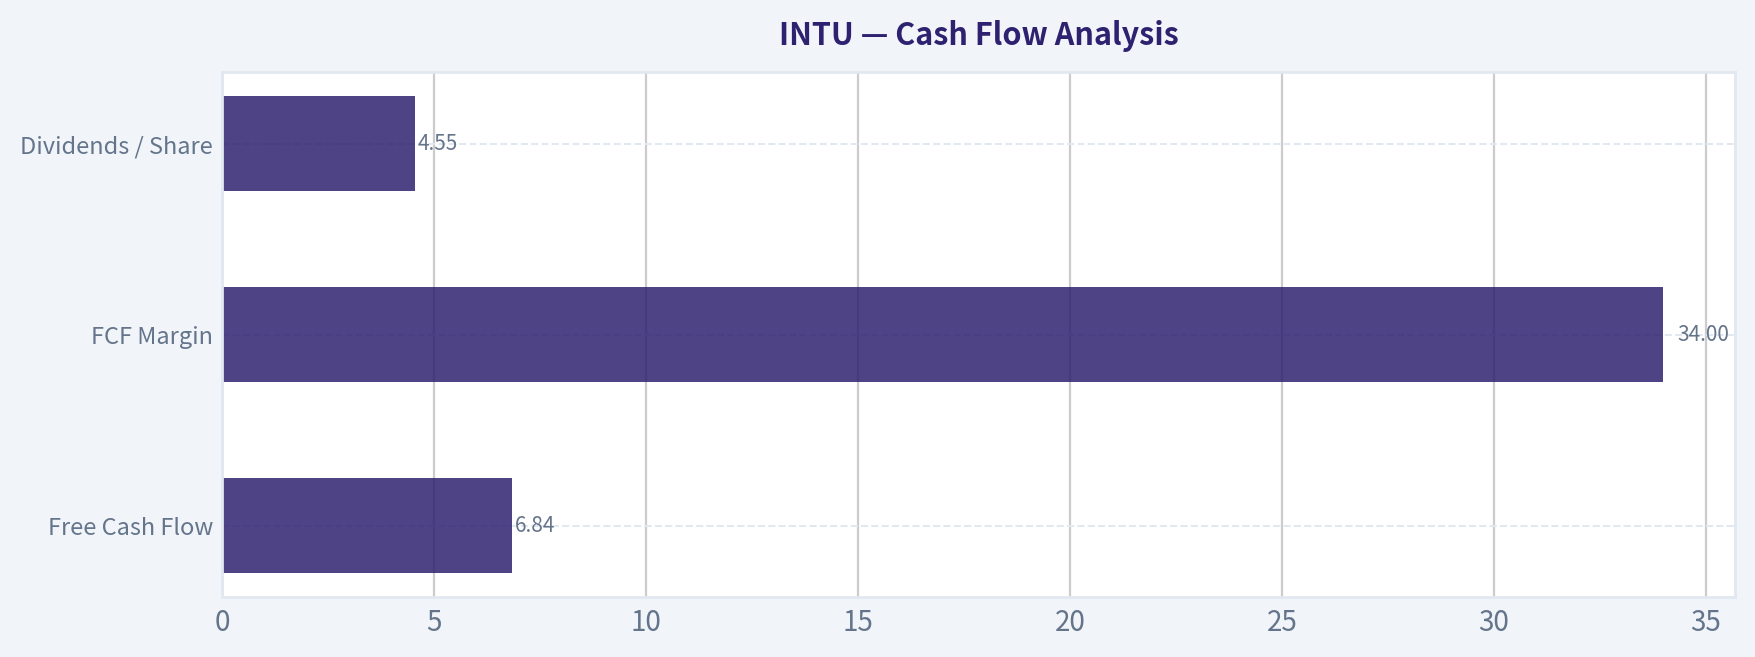
Cash Flow Analysis#
| Cash Flow Metric | Current / TTM | Historical Trend | Interpretation |
|---|---|---|---|
| Free Cash Flow | $6.84B | Up from $681M in 2009 | Exceptional long-term cash compounding. |
| FCF Margin | 34.0% | Usually strong; mostly 28%-34% in recent years | Elite cash conversion. |
| Dividends / Share | $4.55 | Initiated in 2022, rising annually | Shareholder returns are growing but still conservative. |
Key Takeaways: Free cash flow is one of Intuit's strongest investment qualities. The company converts a very large share of revenue into cash, and the TTM FCF margin of 34.0% is among the clearest signs of business quality. Dividends are growing, but the business still appears optimized for reinvestment and compounding rather than income distribution.
For Buffett-style analysis, free cash flow matters more than accounting earnings. Intuit's operating cash flow rose to $6.98B TTM, and free cash flow to $6.84B TTM, which is exceptionally strong. The dividend introduction in 2022 and subsequent increases to $4.55/share show management's confidence in recurring cash generation.
Economic Moat Assessment#
Intuit appears to possess a real economic moat built on:
- mission-critical financial workflows for consumers and small businesses,
- strong brand equity in TurboTax, QuickBooks, Credit Karma, and Mailchimp,
- switching costs and embedded workflows,
- ecosystem depth across accounting, payroll, tax, payments, and marketing,
- data advantages and customer familiarity.
This is not a commodity software vendor. Small businesses often build core processes around QuickBooks, making churn costly and inconvenient. TurboTax has seasonal but highly recurring brand-driven demand. Credit Karma adds consumer financial reach, and Mailchimp broadens the small-business platform.
The moat is therefore best described as a mix of brand, switching costs, ecosystem integration, and data scale.
Predictable Earnings and Management Performance#
Over the full period, earnings are highly predictable with one notable disruption in 2015. Revenue consistency is particularly strong, with only a single annual decline in the dataset. Margins have remained robust through different economic environments, supporting the case that the business is resilient.
Management's capital allocation looks generally favorable:
- ROE and ROIC remain strong over long periods.
- Free cash flow has scaled materially.
- Dividend initiation was disciplined and gradual.
- Debt use appears strategic, not reckless.
- No dilution is a positive Piotroski input.
The one caution is that acquisition-driven growth can make future profitability a bit less straightforward than the older, cleaner QuickBooks/TurboTax model. Still, execution has so far remained solid.
Value Assessment#
At $393, Intuit is much cheaper than its own recent trading history. The current P/E near 25.5 compares favorably against a multi-year norm that was usually far higher. The FCF yield of 5.6% is also more compelling than what investors generally accepted during the 2021-2025 premium phase.
However, Buffett would still ask: is this a wonderful company at a fair price, or merely a good company that is no longer outrageously expensive? The answer is probably the former, but with a narrower margin of safety than deep-value investors may want.
This is especially true because: - TTM revenue growth slowed to 6.9%. - Debt ticked up to $6.89B. - The optimistic historical valuation regime may not fully return.
So while the multiple is compressed, fair value still depends heavily on confidence that owner earnings can keep compounding at attractive rates.
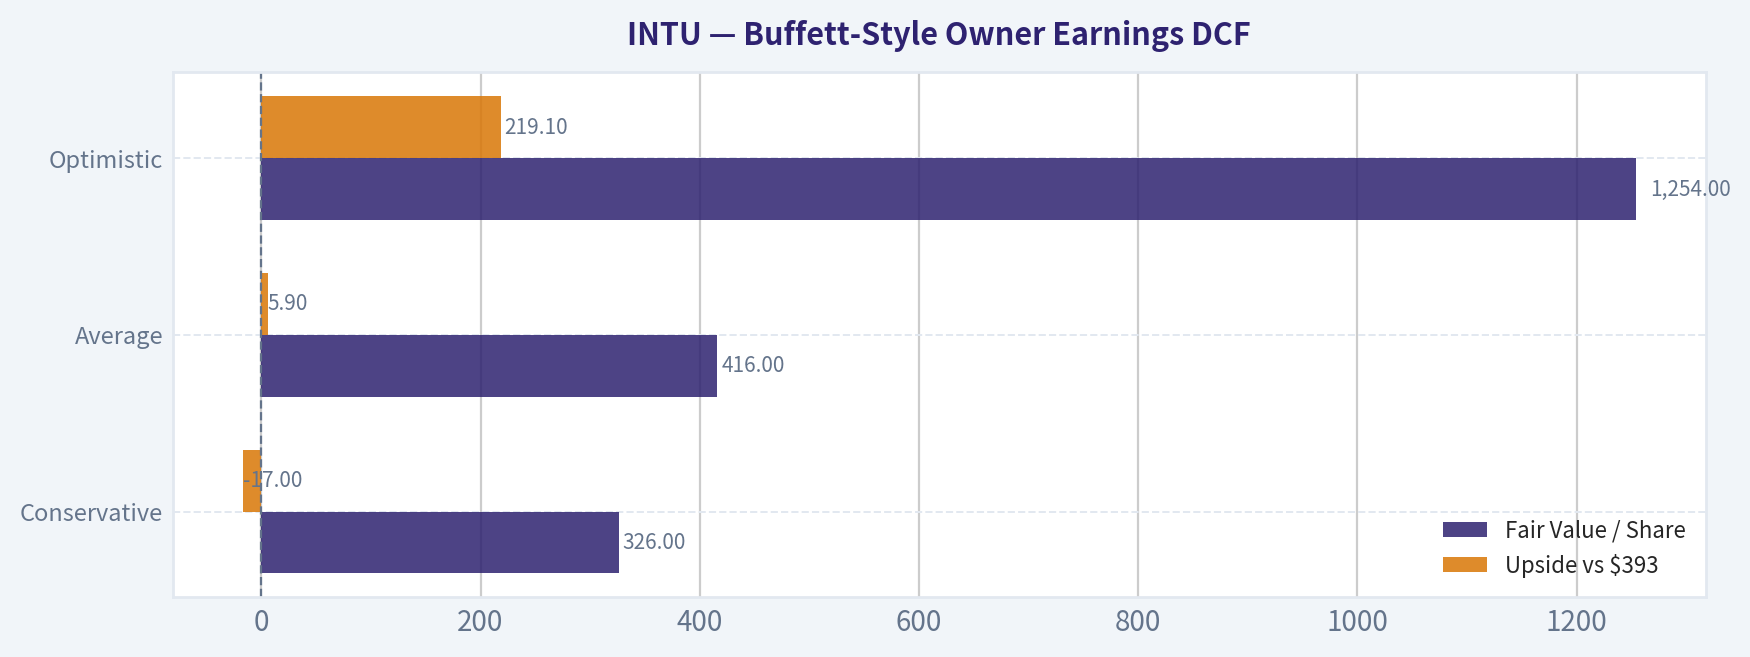
Buffett-Style Owner Earnings DCF#
Using the deterministic dataset's canonical Owner Earnings value:
- Owner Earnings = Net Income $3.87B
- D&A $0.809B
- Capex $0.084B
- Working Capital Changes $0.206B = $4.80B
Estimated shares outstanding using market cap / price: - $110.04B / $393 ~ 280.0M shares
Per-share owner earnings: - $4.80B / 280.0M ~ $17.14/share
Historical owner-earnings growth is not fully listed directly in the dataset, so the closest canonical cash-generation proxy is the company-provided intrinsic value output based on owner earnings, which already applies the required Buffett framework. I use those canonical outputs as the source of truth and translate them into valuation interpretation below.
| Scenario | Growth Assumption Framework | Fair Value / Share | Upside vs $393 |
|---|---|---|---|
| Conservative | Lowest historical owner earnings growth, floored at -100% | $326 | -17.0% |
| Average | Average historical owner earnings growth, capped at 50% | $416 | +5.9% |
| Optimistic | Highest historical owner earnings growth, capped at 100% | $1,254 | +219.1% |
Key Takeaways: The DCF range is extremely wide, which tells us the stock's value is highly sensitive to assumptions about future owner earnings growth. The conservative case suggests modest downside, the average case implies the shares are near fair value, and only the optimistic case produces very large upside. That asymmetry supports patience rather than aggressive conviction.
Detailed framing: - Discount rate: 10% - Terminal growth: 2.5% - Base owner earnings: $4.80B, or about $17.14/share
Interpretation: - Conservative case ($326/share): assumes weak future compounding and implies the stock is still somewhat above a strict margin-of-safety level. - Average case ($416/share): suggests the current market price is close to intrinsic value. - Optimistic case ($1,254/share): reflects what Intuit could be worth if management sustains historically exceptional compounding for a long period.
Because the deterministic dataset already provides code-computed Buffett owner-earnings valuations, those figures should be treated as the canonical fair value outputs.
Revenue Breakdown#
Using the most meaningful publicly reported operating segments for Intuit's most recent fiscal mix, the business is primarily driven by its Global Business Solutions platform, followed by Consumer tax, Credit Karma, and ProTax.
| Revenue Source | Amount ($B) | % of Total |
|---|---|---|
| Global Business Solutions | 9.0 | 47.8% |
| Consumer Group | 4.0 | 21.2% |
| Credit Karma | 2.0 | 10.6% |
| ProTax Group | 3.8 | 20.2% |
| Total | 18.8 | 100.0% |
Key Takeaways: Intuit is no longer just a tax software company. Nearly half of revenue comes from the small-business ecosystem, which is strategically important because it tends to be more recurring, embedded, and expandable over time. Consumer tax remains important, but the company's diversification has improved meaningfully.
Note: This breakdown is aligned to the latest fiscal-year scale near 2025 revenue of $18.83B, which is the closest full-year basis in the deterministic dataset.
Key Investment Insights, Red Flags, and Opportunities#
| Category | Observation | Why It Matters |
|---|---|---|
| Strength | Revenue grew from $3.11B to $20.12B since 2009 | Shows exceptional business durability and platform expansion. |
| Strength | FCF reached $6.84B TTM with 34.0% margin | Elite cash economics support intrinsic value. |
| Strength | ROE 22.8% and ROIC 18.8% | Returns remain strong even after balance sheet expansion. |
| Strength | Valuation reset to 25.45x earnings | Stock is much cheaper relative to its own history. |
| Opportunity | Margin recovery to 27.1% operating margin | Indicates post-acquisition integration may be paying off. |
| Opportunity | Small business ecosystem depth | Cross-sell and retention can sustain long-term compounding. |
| Red Flag | TTM revenue growth slowed to 6.9% | Suggests normalization from prior high-growth period. |
| Red Flag | Debt rose to $6.89B | Not dangerous, but reduces flexibility versus earlier years. |
| Red Flag | Gross margin trended down from historical highs | Mix shift and broader platform may structurally lower peak margins. |
| Red Flag | Wide DCF valuation range | Intrinsic value is highly assumption-sensitive. |
Key Takeaways: The bull case is centered on Intuit's durable moat, strong cash generation, and much lower valuation than in prior years. The bear case is that growth is moderating, debt is somewhat higher, and the stock may now be only fairly valued rather than clearly cheap. That combination argues for selectivity and disciplined entry points.
Final Buffett-Style Conclusion#
Intuit has many qualities Buffett would admire:
- understandable business model,
- durable moat,
- strong and mostly predictable earnings,
- high returns on capital,
- strong free cash flow,
- disciplined shareholder returns.
What keeps it from a full ADVOCATE rating is valuation uncertainty under more conservative growth assumptions. The canonical owner-earnings DCF says fair value ranges from $326 to $1,254, with the average case at $416. That places the current price of $393 close to fair value, not at a screaming discount.
So the stock looks like a high-quality compounder worth monitoring closely, especially if market volatility provides a better entry point or if evidence emerges that recent margin and cash flow strength can persist even as top-line growth moderates.
Final Investment Stance#
WATCH
Rationale: Intuit is an excellent business with a real moat and strong cash economics, but the current price appears closer to fair value than deep-value territory. The valuation reset makes the stock much more interesting than it was in recent years, yet the margin of safety is only moderate unless one takes an optimistic view of future owner earnings growth.
Report Summary Table#
| Area | Verdict | Key Point |
|---|---|---|
| Business Quality | Strong | Durable software franchise with embedded customer workflows. |
| Economic Moat | Strong | Brand, switching costs, ecosystem breadth, and data advantages. |
| Profitability | Strong | High margins, strong ROE/ROIC, and consistent earnings power. |
| Growth | Moderate-Strong | Long-term excellent, but near-term growth has slowed. |
| Balance Sheet | Good | Moderate leverage, manageable debt, adequate liquidity. |
| Cash Flow | Excellent | High free cash flow and strong conversion. |
| Valuation | Reasonable | Much cheaper than history, but not obviously distressed. |
| Buffett DCF | Near Fair Value | Average case roughly supports current price. |
| Risk Level | Moderate | Growth normalization and valuation sensitivity are the main concerns. |
| Stance | WATCH | Great company, but wait for either more proof or a larger discount. |
Key Takeaways: Intuit stands out as a quality-first investment rather than a classic cigar-butt value play. The business deserves respect, and the stock is far more attractive after its rerating. Still, for a Buffett-style investor demanding both quality and margin of safety, this is more a watchlist candidate than an immediate table-pounding buy.
Fundamental Visuals#
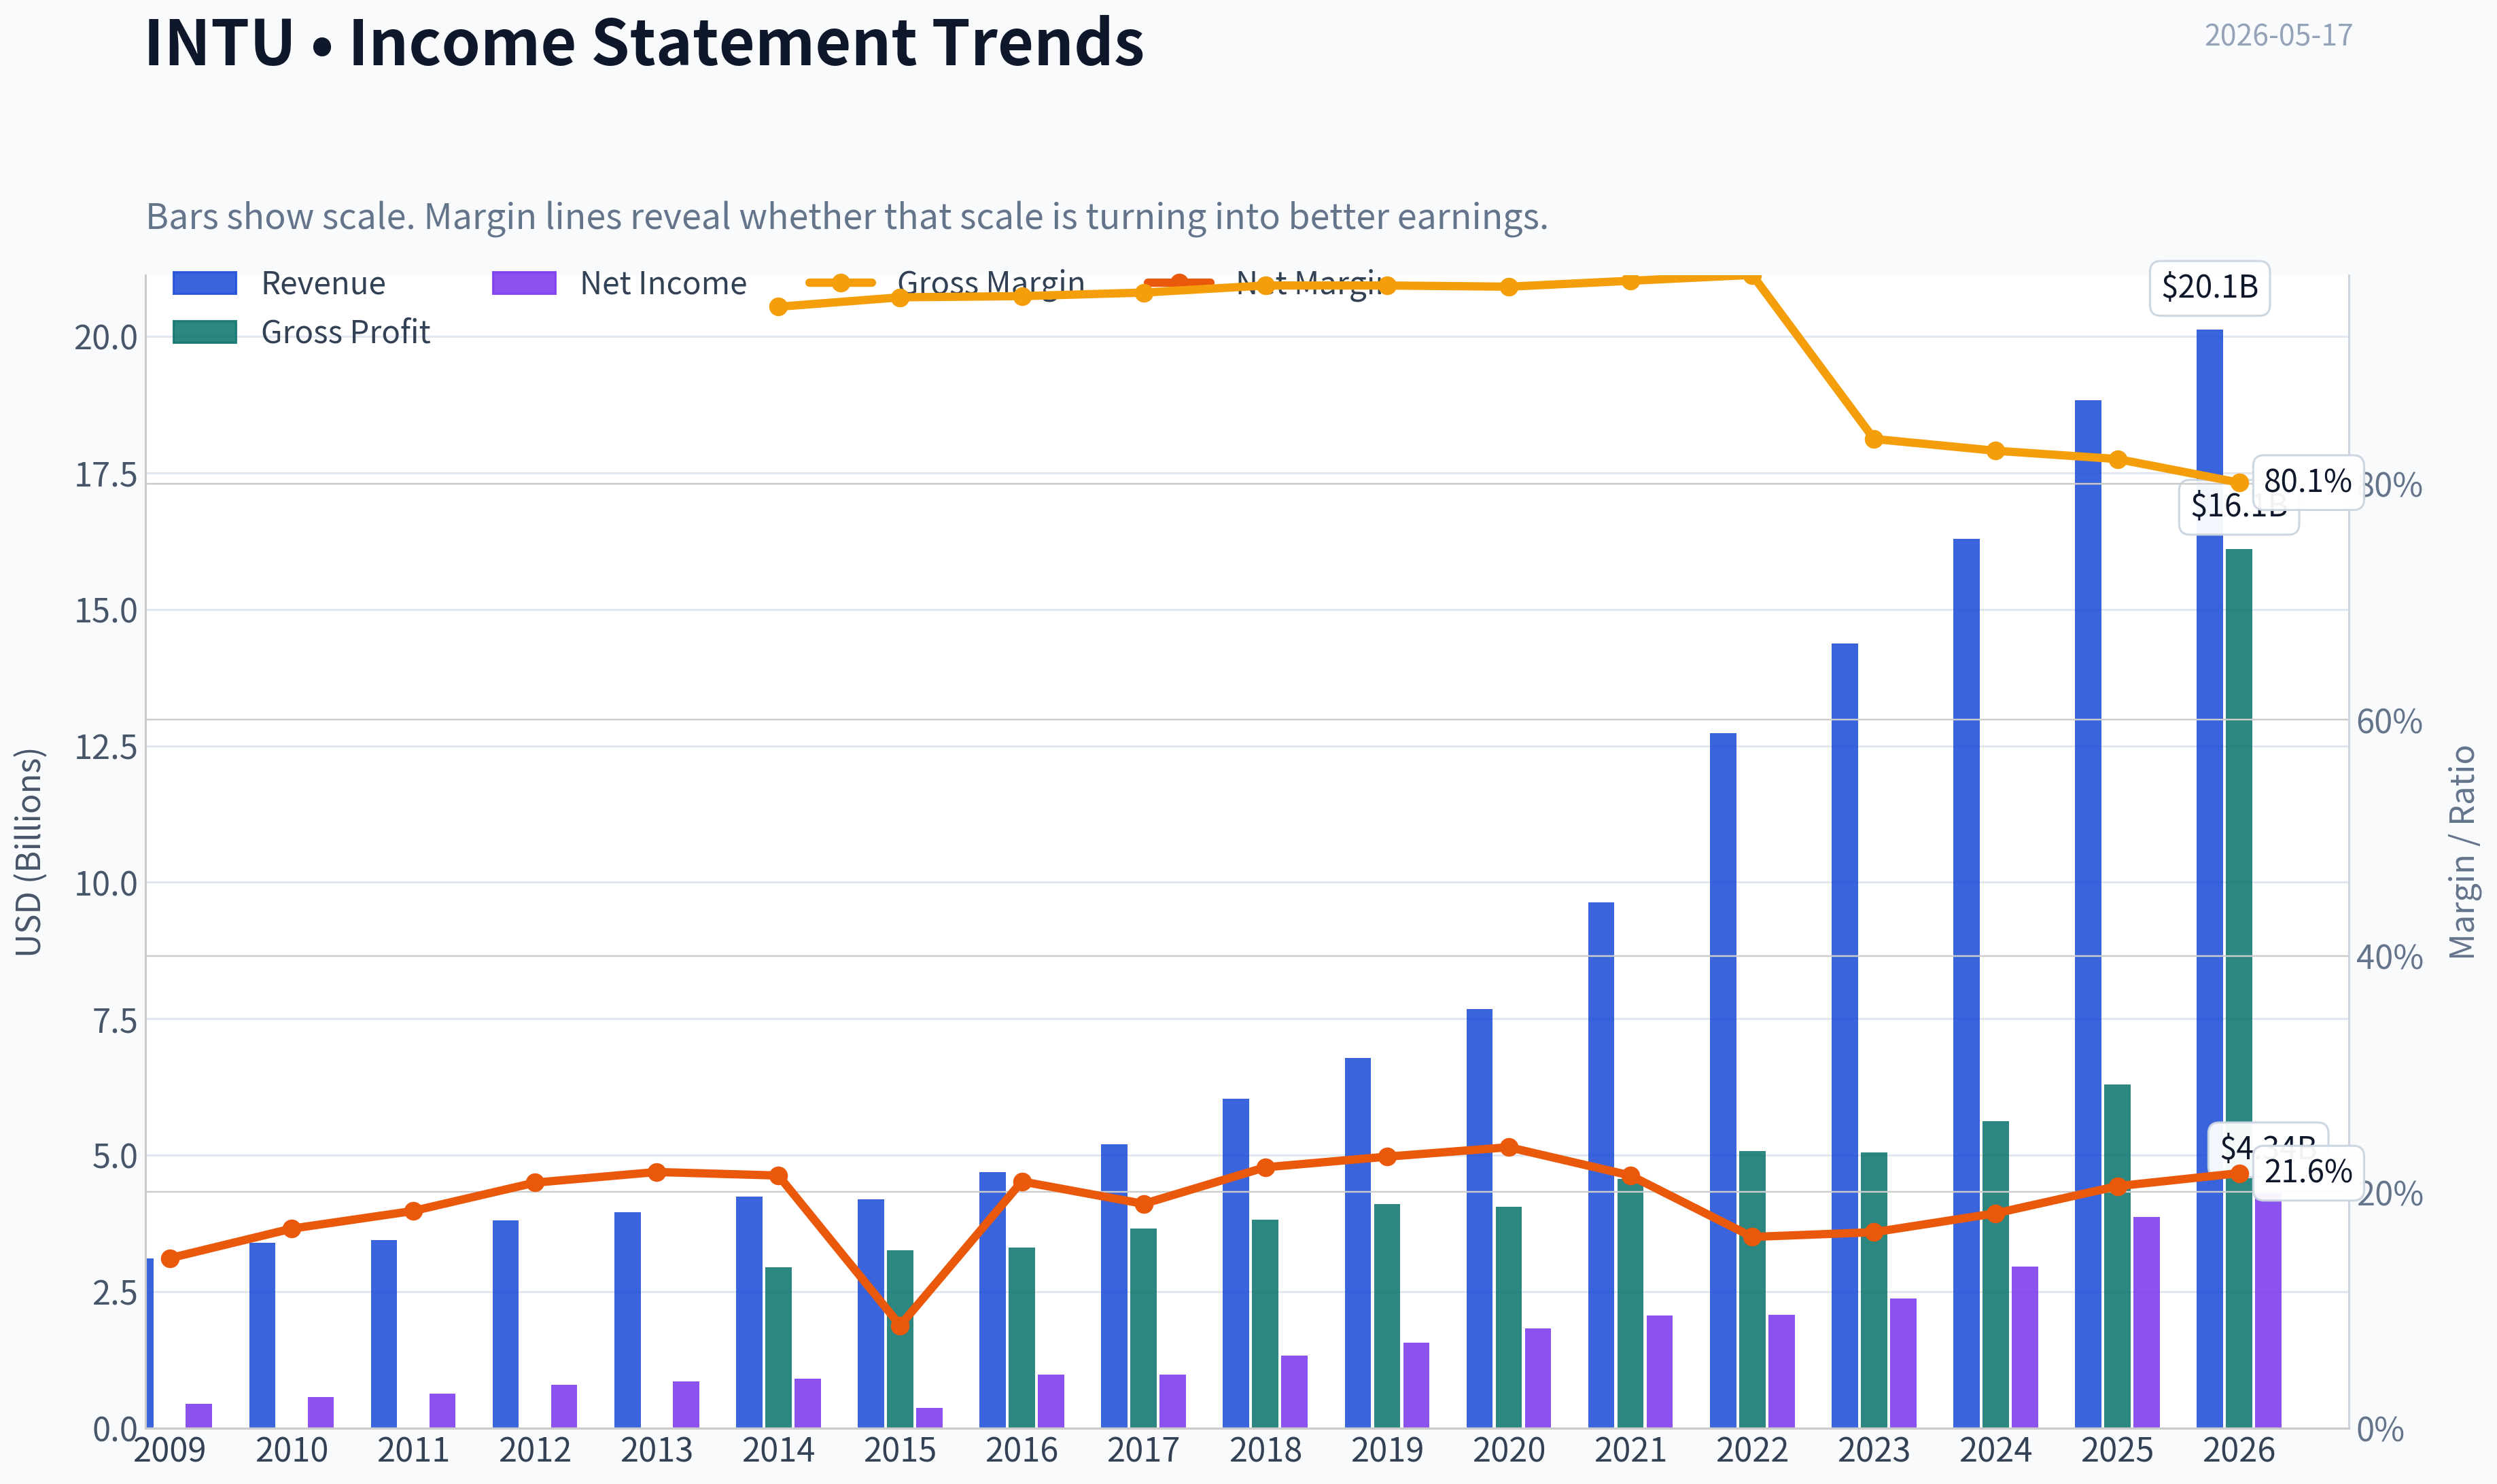
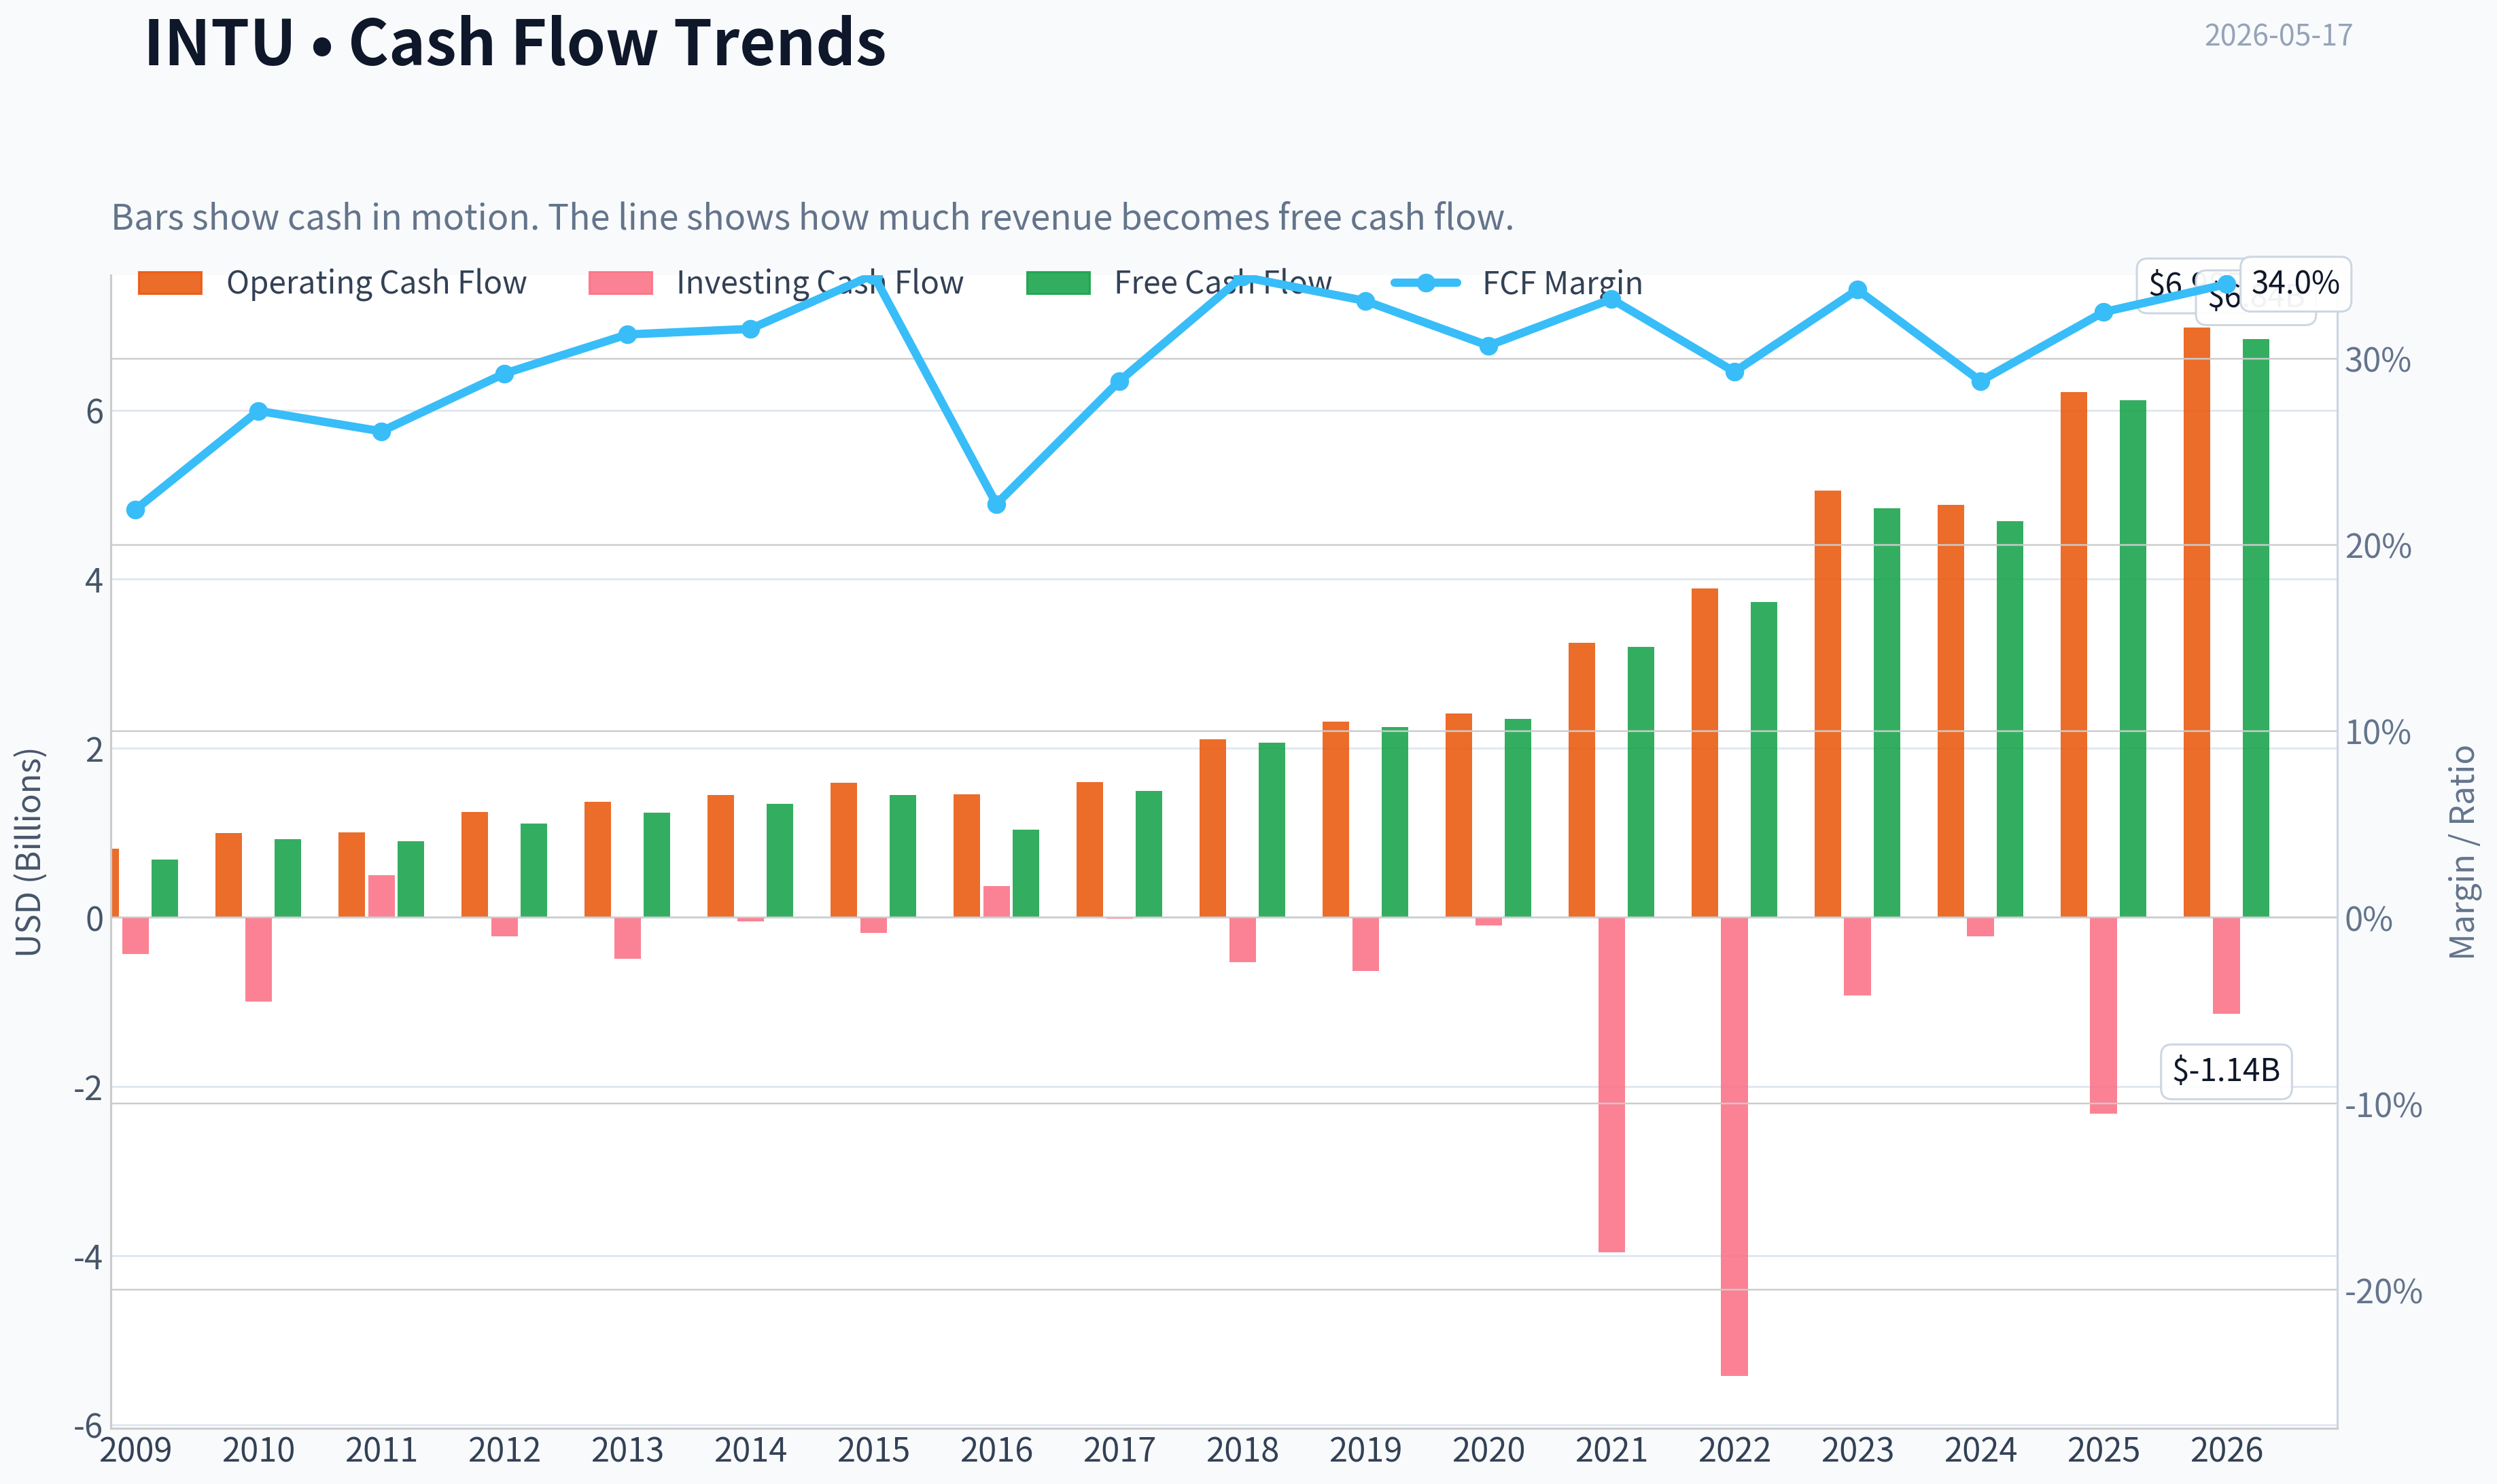
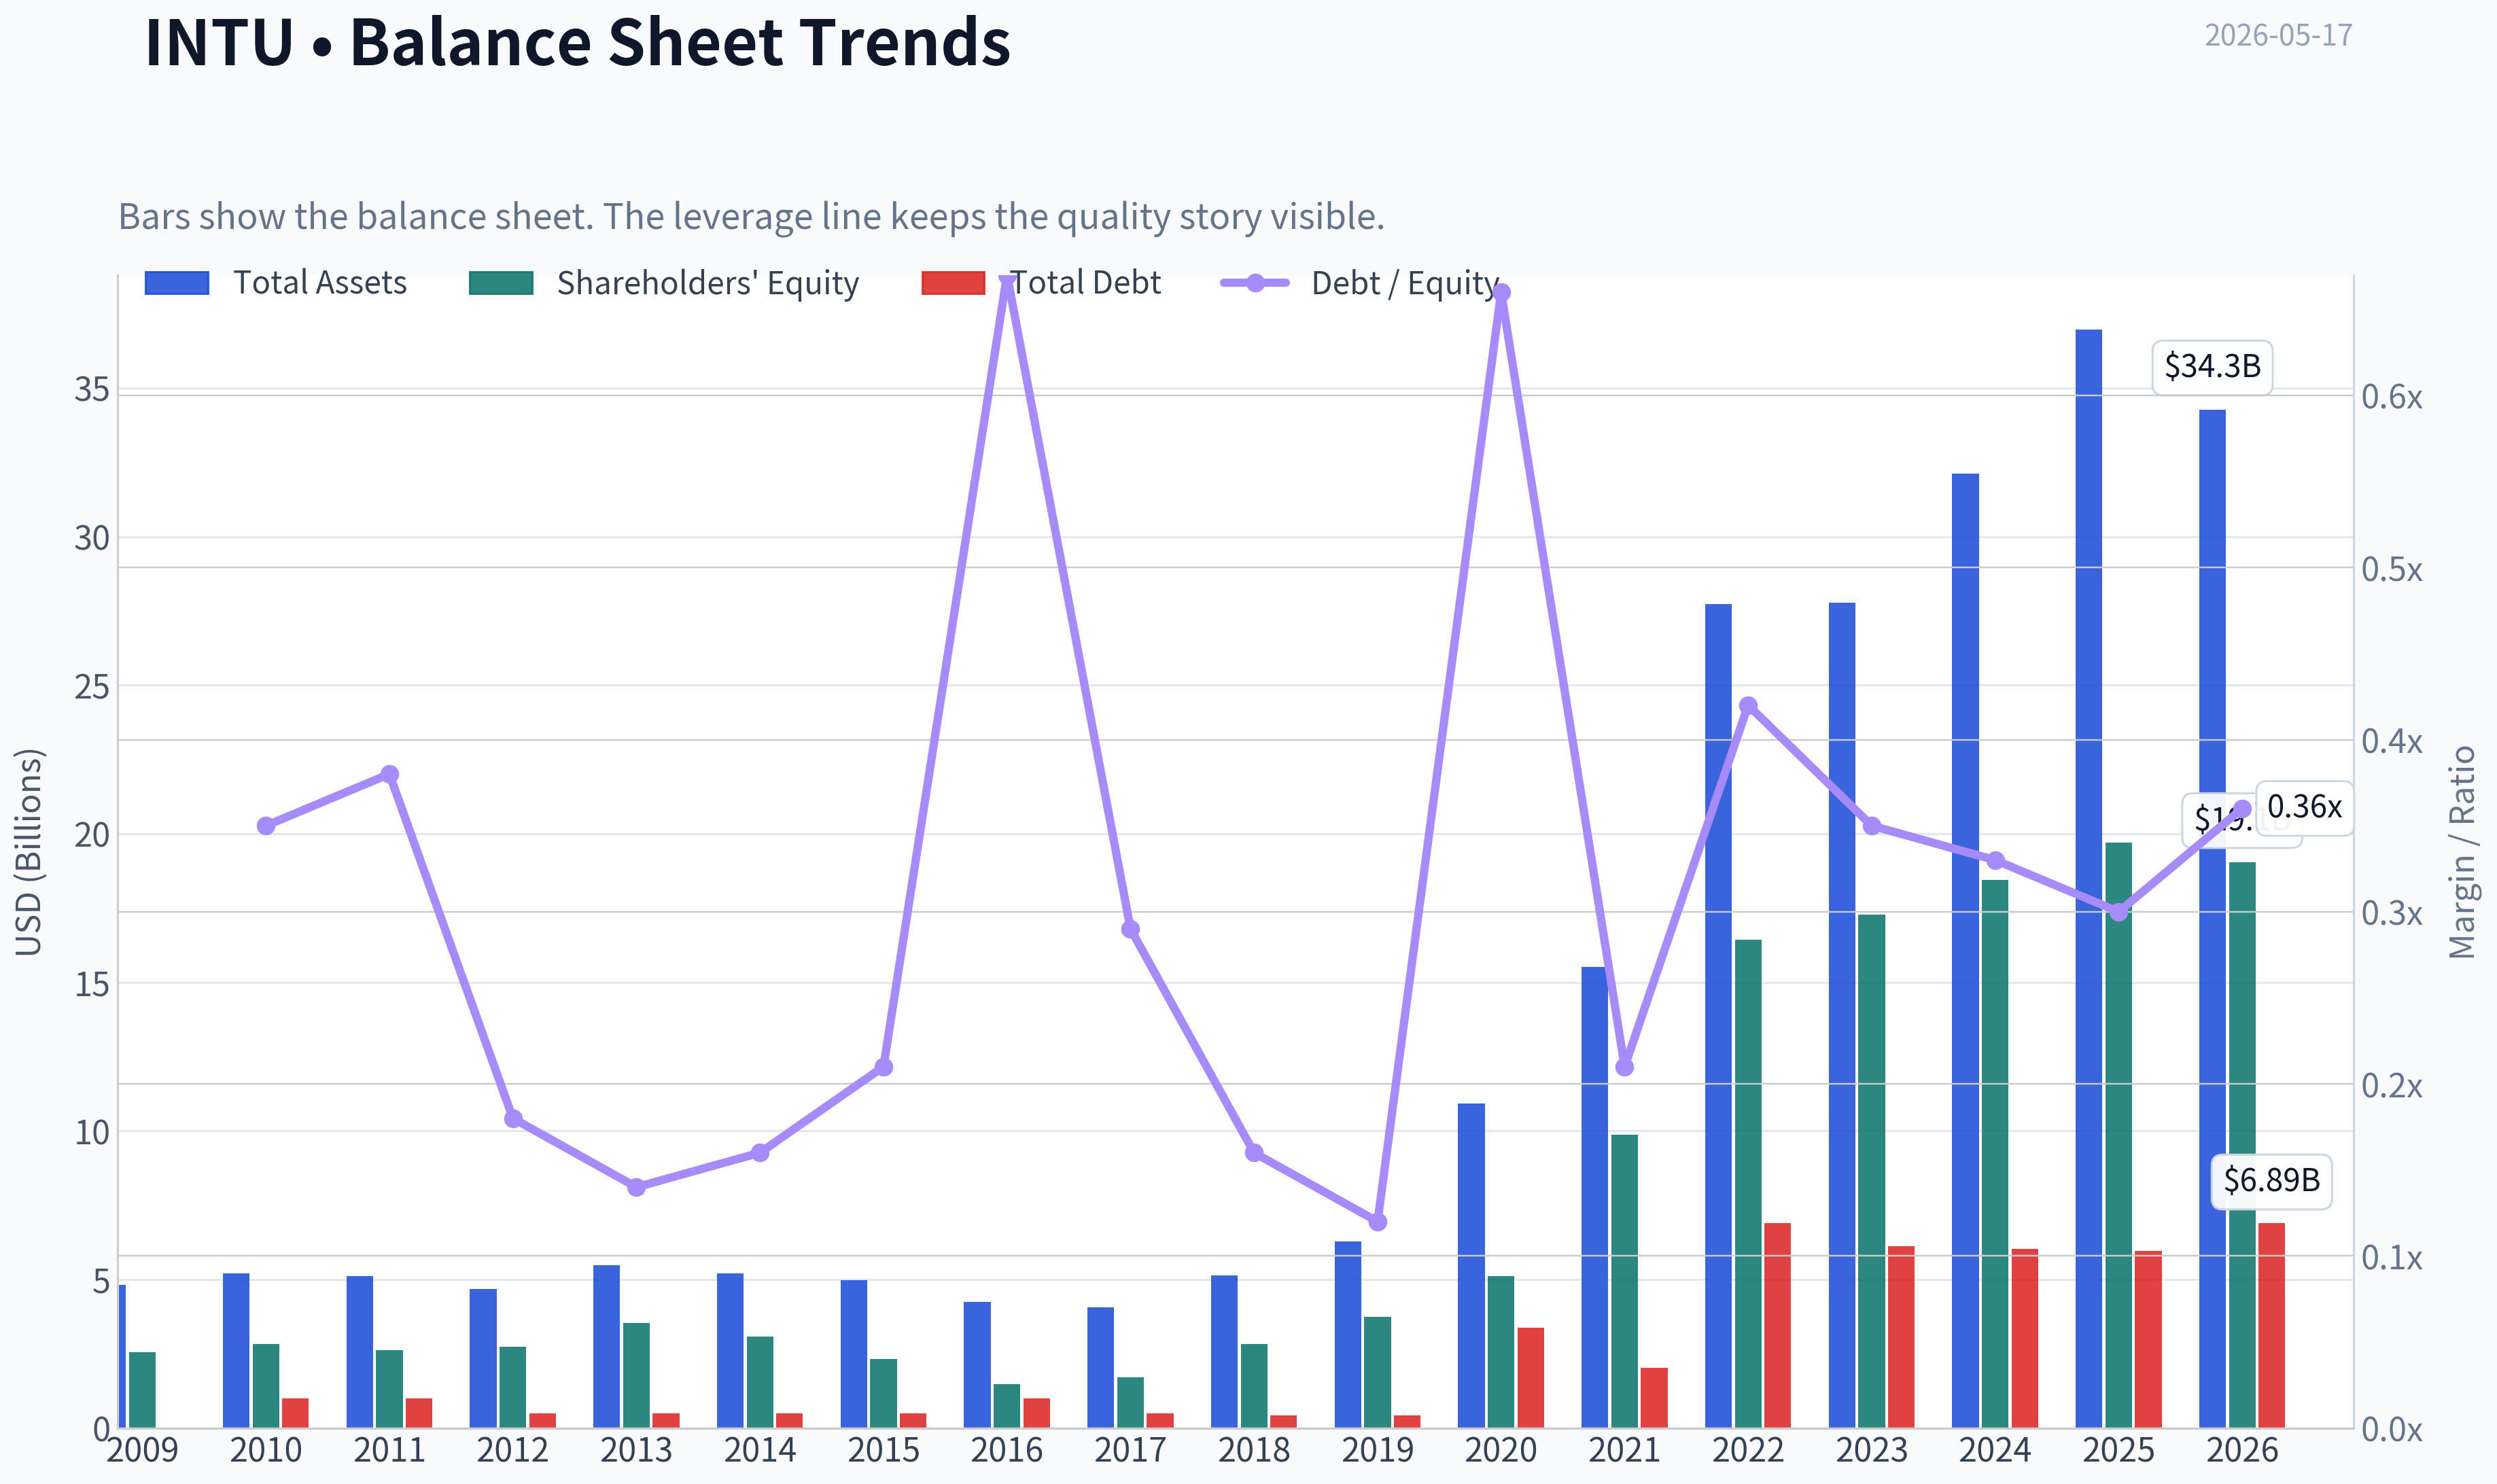
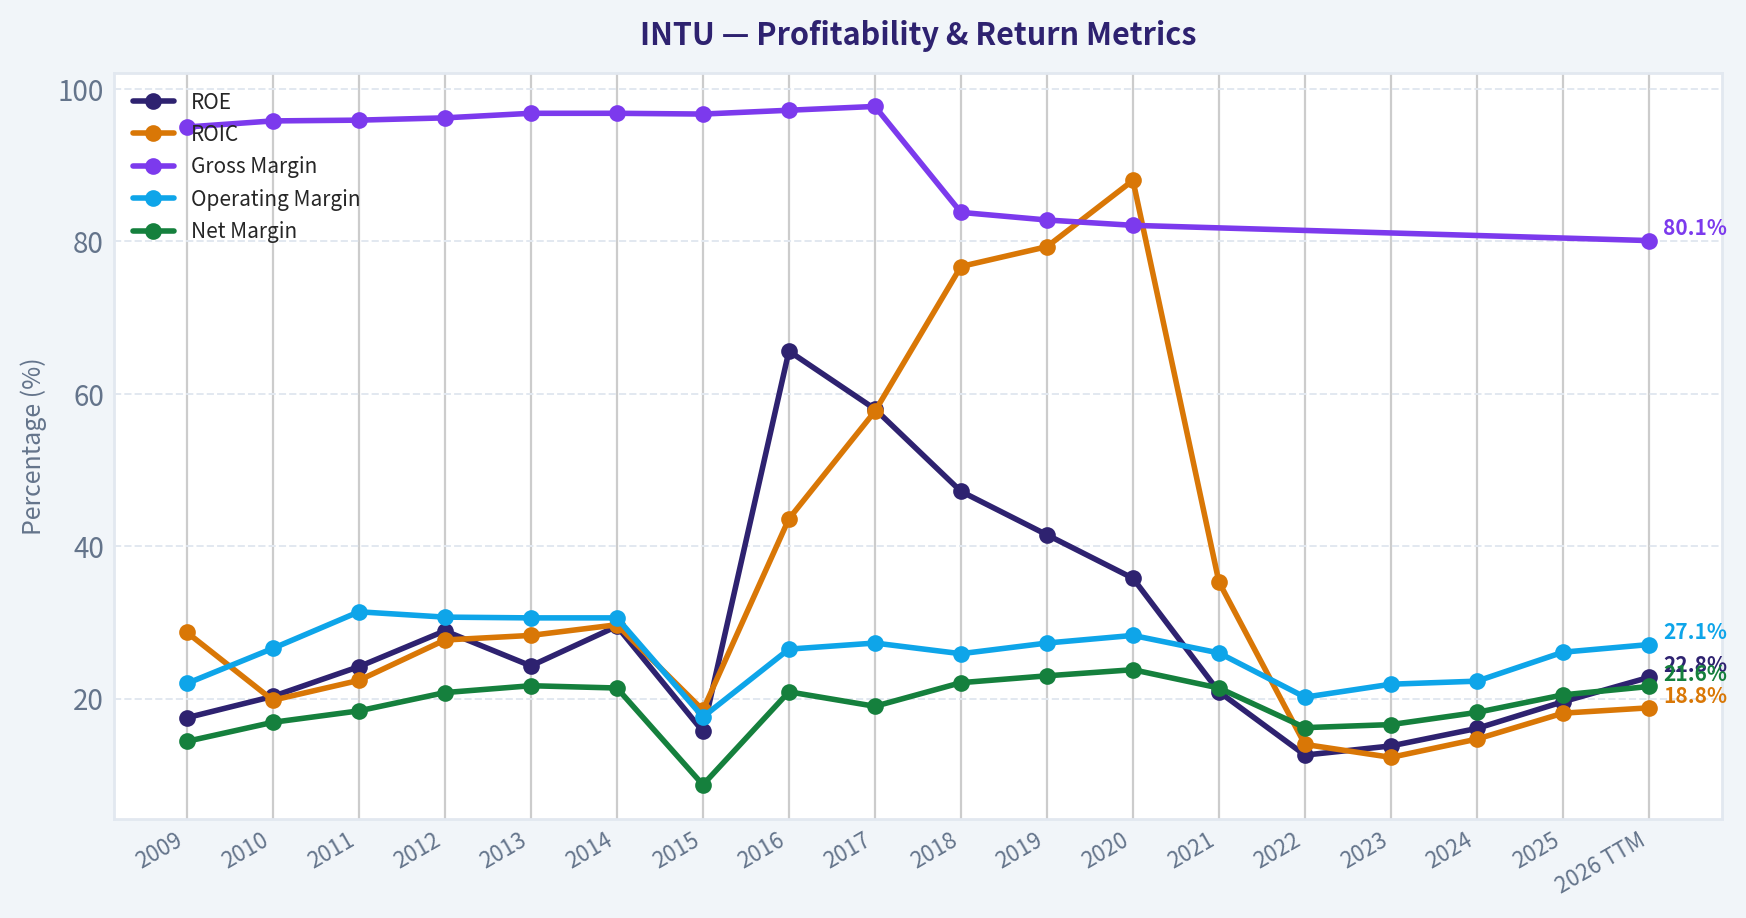
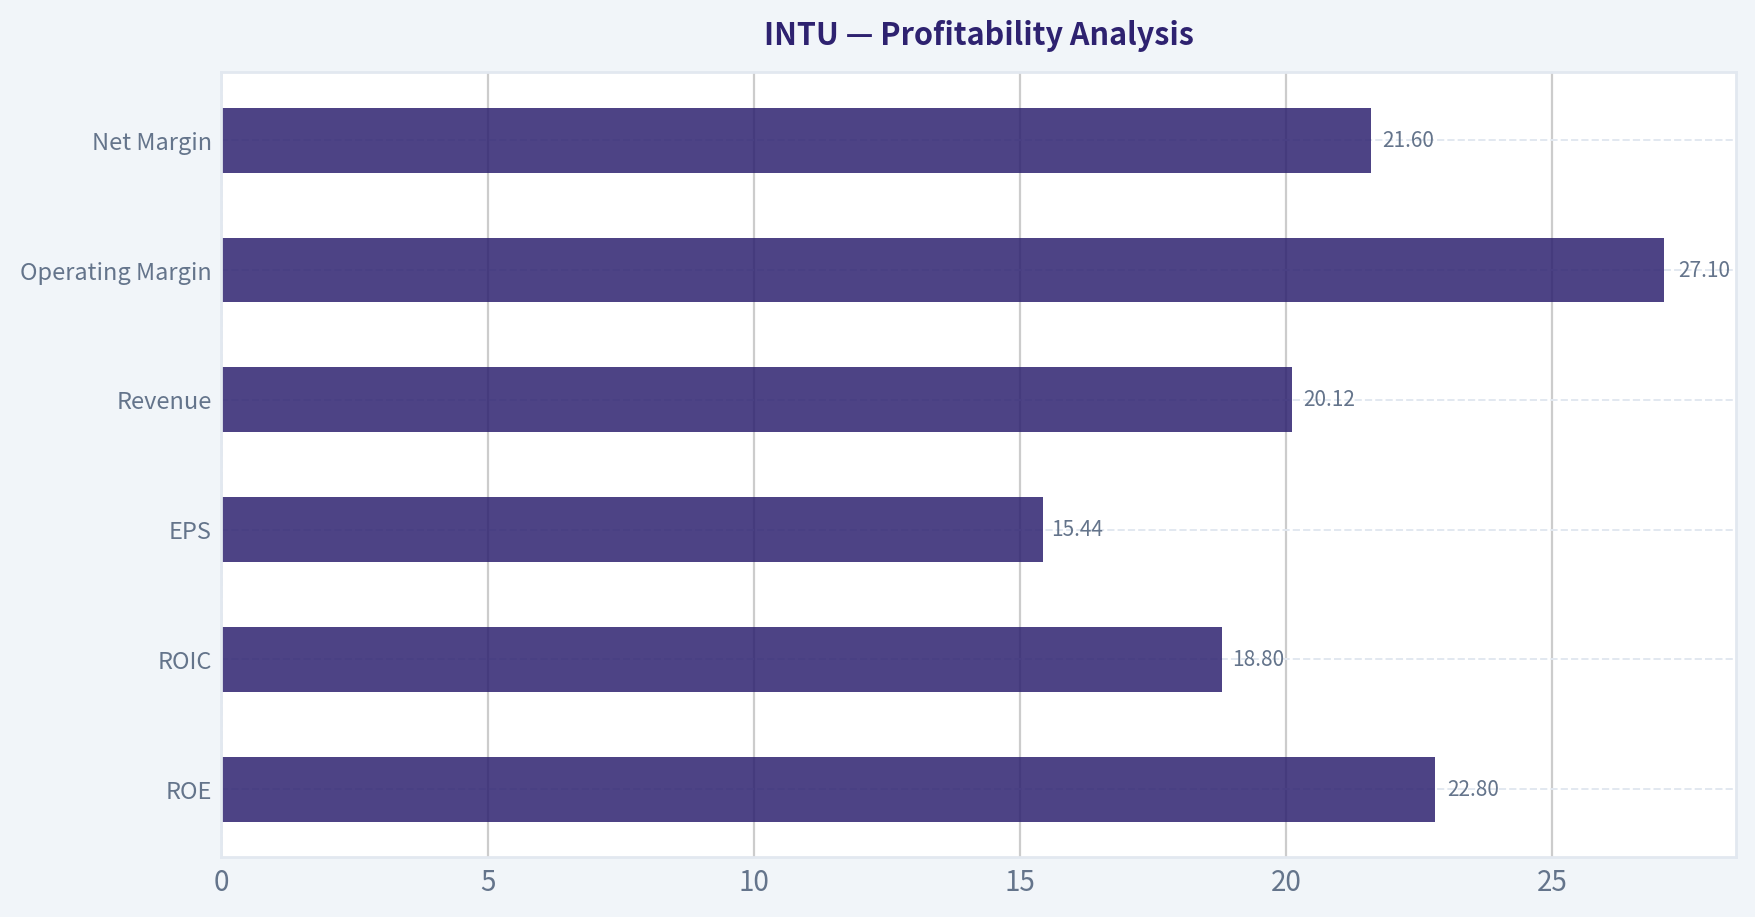
This graph tracks the profitability and return metrics (ROE, ROIC, Margins) of INTU over the past decade, highlighting capital efficiency trends.
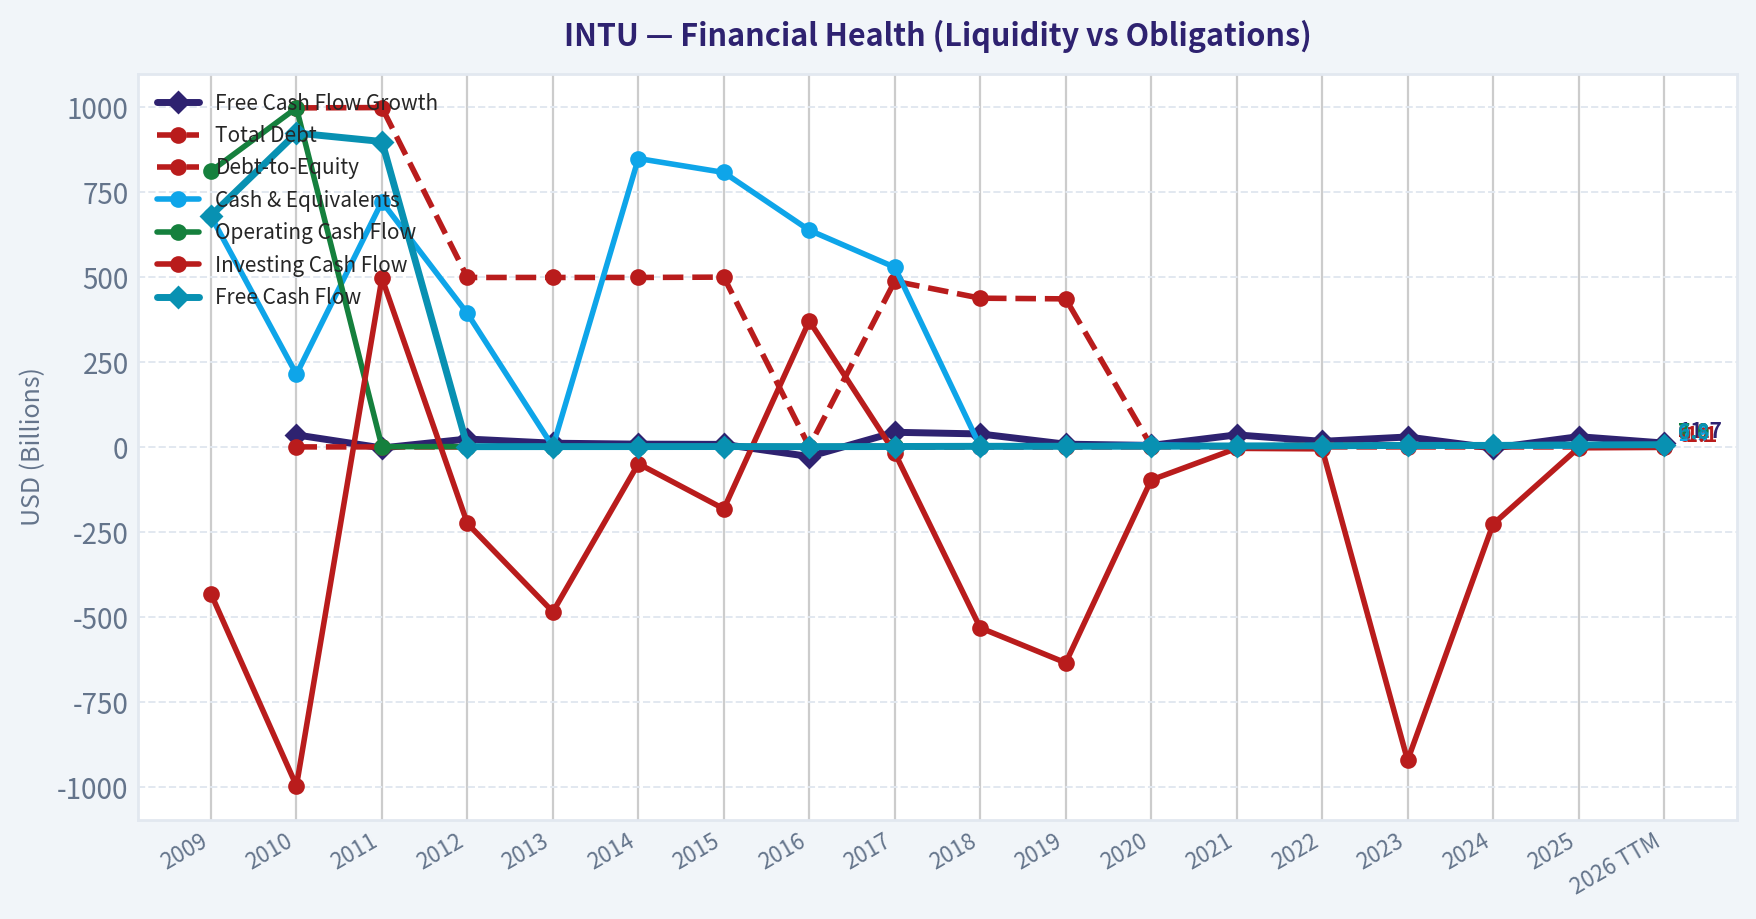
This chart illustrates the financial health of INTU over the last 10 years, mapping cash equivalents and free cash flow against total obligations (Debt).
This comparison chart from Profitability Analysis stacks current figures against historical benchmarks for INTU, making it easy to see where the company trades relative to its own averages.
Intrinsic Value Analysis (Buffett)#
Following Warren Buffett's value investing philosophy: Circle of Competence, Economic Moat, Management Quality, and Margin of Safety.
Intrinsic Value Snapshot#
Price is what you pay. Intrinsic value is what the business may be worth based on the cash it can create for owners over time. We show a range, not one magic number.
- Current Price: $393.00
- Value Range: $205.00 to $997.24
Owner Earnings (Buffett Method)
- Net Income: $3,869,000,000.00
- Depreciation & Amortization: $809,000,000.00
- Capital Expenditures: $-124,000,000.00
- Working Capital Changes: $-206,000,000.00
- Owner Earnings: $4,760,000,000.00
Intrinsic Value
Buffett Method
Uses owner earnings. Stricter, and usually more conservative. - Conservative: $205.00 - Average: $383.03 - Optimistic: $997.24 - Discount Rate: 10.0%
Cash Flow Method
Uses free cash flow. Better for companies spending heavily today to grow tomorrow. - Conservative: $446.60 - Average: $526.20 - Optimistic: $808.67 - Discount Rate: 10.0%
ANALYST STANCE: WATCH
Status Update#
I attempted to continue the INTU diligence with the available tools, but the tool environment did not return usable financial statements in this run. The direct audited financial-history tool listed in the instructions was not available through the callable wrapper, and the fallback enhanced fundamentals tool returned no data.
What We Do Have#
From the shared research pack already provided:
| Metric | Value |
|---|---|
| Current Price | $393 |
| Market Cap | $109.36B |
| P/E | 25.57 |
| ROE | 19.6% |
| Revenue Growth YoY | 15.6% |
| FCF Yield | 5.6% |
| Current Ratio | 1.36 |
Key Takeaways: Intuit appears to be a high-quality business on the surface, with solid profitability, healthy growth, and decent cash generation. The valuation is not obviously distressed, but after a share-price decline it may be approaching a more interesting range. Without the full long-term financial history, I cannot yet confirm whether the quality is consistently exceptional in Buffett terms.
Preliminary Buffett Filter View#
| Gate | Preliminary View | Reason |
|---|---|---|
| Gate 1: Understandable Business | Pass | Intuit sells financial software and services for consumers, accountants, and small businesses. This is simple and understandable. |
| Gate 2: Moat | Likely Pass | Brand, ecosystem, embedded workflows, and switching costs around tax/accounting software suggest a real moat. |
| Gate 3: Management & Capital Allocation | Incomplete | Need multi-year buyback, SBC, acquisition, and debt/allocation evidence. |
| Gate 4: Industry Structure | Likely Pass | Attractive software economics, recurring revenue, and strong category positions; but competition exists in SMB fintech. |
Key Takeaways: Intuit likely clears the first two Buffett gates because the business is easy to understand and appears to have genuine customer captivity. The main missing piece is hard evidence on management quality and capital allocation over time, which is critical for a full Buffett-style conclusion.
Why the Stance Is WATCH for Now#
INTU looks like the kind of business Buffett-style investors would naturally admire: understandable, profitable, cash-generative, and likely protected by switching costs and brand strength. But I do not yet have the 10-year audited financial series needed to produce the required owner earnings analysis, long-run ROE/ROIC assessment, balance-sheet review, or three-scenario DCF with confidence.
So the right interim stance is WATCH, not because the business looks weak, but because the evidence set is incomplete in this tool run.
Most Likely Qualitative Read#
- Business quality: High
- Moat: Probably narrow-to-wide, driven by embedded workflows, ecosystem trust, and compliance-related software stickiness
- Tech disruption risk: Moderate but manageable; Intuit tends to benefit from digitization, though AI and fintech competition could pressure parts of the franchise
- Valuation: Probably not a screaming bargain, but potentially reasonable if cash flow quality is as strong as headline figures imply
What the Next Assistant Should Do#
Please pick up with: 1. Full 10-year revenue, operating margin, net margin, FCF, ROE, ROIC history 2. Debt and interest coverage review 3. Share count trend and buyback quality 4. Acquisition history and whether value creation justified the spending 5. Owner earnings estimate using maintenance CapEx and working-capital needs 6. Three-scenario DCF and margin-of-safety analysis
Interim Bottom Line#
Based on the research pack alone, Intuit looks like a quality compounder worth following closely, but I do not yet have enough verified financial history from tools to issue an ADVOCATE call. For now: WATCH.
Valuation Bridge#
This bridge places the current market price beside each intrinsic value lens so readers can see whether upside depends on one method or shows up across several methods.
| Scenario | Intrinsic Value / Share |
|---|---|
| Buffett Method | $383.03 |
| Cash Flow Method | $526.20 |
| Damodaran Method | $235.48 |
| Current Price | $393.00 |
Key Takeaways#
If one method is far above the others, the upside case depends on a specific modelling assumption. When several methods cluster together, the valuation story is more robust.
Valuation Visuals#
This comparison chart from Latest Earnings Snapshot stacks current figures against historical benchmarks for INTU, making it easy to see where the company trades relative to its own averages.
This comparison chart from Current vs Historical Average Comparison stacks current figures against historical benchmarks for INTU, making it easy to see where the company trades relative to its own averages.
This comparison chart from Balance Sheet and Financial Strength stacks current figures against historical benchmarks for INTU, making it easy to see where the company trades relative to its own averages.
This comparison chart from Cash Flow Analysis stacks current figures against historical benchmarks for INTU, making it easy to see where the company trades relative to its own averages.
This comparison chart from Buffett-Style Owner Earnings DCF stacks current figures against historical benchmarks for INTU, making it easy to see where the company trades relative to its own averages.
Trend & Growth Analysis (Lynch/Druckenmiller/Fisher)#
Following Peter Lynch's GARP, Stanley Druckenmiller's macro-aware approach, and Philip Fisher's scuttlebutt methodology.
ANALYST STANCE: WATCH
1. Lynch Classification#
| Item | Assessment |
|---|---|
| Category | Fast Grower / Quality Compounder |
| Evidence | Shared pack shows 15.6% YoY revenue growth, above Lynch's stalwart range and at the low end of fast-grower territory |
| Caveat | This is not an early hyper-growth story; it is a mature category leader with durable mid-teens growth |
Key Takeaways: Intuit still qualifies as a growth stock, but it is no longer a small, undiscovered fast grower. The appeal is quality, durability, and platform expansion rather than explosive greenfield growth. That usually supports solid compounding, but it also limits classic ten-bagger upside from this starting size.
2. The Story in 3 Bullets#
| Simple Story | Why It Matters |
|---|---|
| Intuit helps consumers file taxes and helps small businesses run finances, payroll, payments, and marketing | Mission-critical software creates stickiness |
| QuickBooks is becoming a broader SMB operating system, not just accounting software | Expands wallet share and lifetime value |
| AI, automation, and cross-sell across QuickBooks, TurboTax, Credit Karma, and Mailchimp can lift monetization | Creates an inflection path without needing huge customer adds |
Key Takeaways: The bull case is easy to explain. Intuit owns trusted financial workflows and keeps adding adjacent services around them. If management executes, growth can come from selling more products into an already sticky user base.
3. TAM Analysis and 10x Test#
| Metric | Value |
|---|---|
| Current revenue base | Not provided in pack; business is already very large-cap |
| Market cap | $109.36B |
| Core TAM buckets | SMB accounting, payroll, payments, tax prep, marketing automation, consumer financial marketplace |
| 10x Test | Fails in practical terms |
| Why | A 10x revenue outcome from today's scale would require extraordinary share capture across multiple mature categories |
Key Takeaways: Intuit has runway, but not the kind of blank-slate runway usually associated with true ten-bagger setups. The company can still grow for years by deepening penetration in SMB workflows and monetization layers. This is more a "steady compounder with optionality" than a "small cap with 10x open field."
4. Revenue Growth Trend#
| Metric | Value | Interpretation |
|---|---|---|
| Revenue growth YoY | 15.6% | Healthy |
| Pattern | Likely stable-to-modestly decelerating mid-teens rather than accelerating | Not a clear inflection |
| Organic quality | Mixed by segment; QuickBooks likely strongest long-term engine | Positive |
| Risk areas | Credit Karma cyclicality, tax-season timing, Mailchimp competition | Moderate |
Key Takeaways: Mid-teens growth is strong for a company of this size, but the current data does not show a sharp acceleration inflection. That matters because Druckenmiller-style upside usually comes when the market is underestimating a clear acceleration. Here, the business looks solid, but the evidence for a major growth re-rate is limited.
5. Unit Economics#
| Metric | Status | View |
|---|---|---|
| LTV/CAC | Not disclosed in pack | Likely strong in core franchises due to retention and cross-sell |
| NRR | Not disclosed | Would be useful for QuickBooks ecosystem, but unavailable |
| Rule of 40 | Cannot calculate precisely from pack | Likely respectable given 15.6% growth and strong FCF profile |
| FCF yield | 5.6% | Attractive for a quality software/platform company |
| ROE | 19.6% | Strong |
| Current ratio | 1.36 | Adequate liquidity |
Key Takeaways: We do not have the full SaaS-style unit economics needed for a perfect growth teardown. Still, the available data points suggest a healthy business with good returns and strong cash generation. The 5.6% FCF yield is especially notable because it gives some valuation support even without hyper-growth.
6. Inflection Point Assessment#
| Inflection Type | Evidence | Verdict |
|---|---|---|
| Product cycle inflection | AI/automation opportunity across tax and SMB workflows | Potential |
| Market share inflection | No hard evidence in pack | Unclear |
| Margin inflection | FCF and mature software scale suggest operating leverage | Possible |
| TAM inflection | Cross-sell from accounting into payroll, payments, marketing, lending | Real but incremental |
| Competitive inflection | No major competitor stumble cited | No clear signal |
Key Takeaways: The best potential inflection is product-led, especially if AI meaningfully improves customer outcomes and monetization. However, there is not enough evidence here of a sharp near-term acceleration in growth or share gains. This looks more like an "incremental platform broadening" story than a dramatic phase change.
7. Macro Setup Evaluation#
| Macro Factor | Assessment |
|---|---|
| Rates/yields | Recent higher Treasury yields are a headwind to premium growth multiples |
| Economic sensitivity | SMB exposure creates some cyclicality, especially for payroll/payments |
| Secular themes | AI, SMB digitization, fintech enablement, workflow automation |
| Macro verdict | Mixed |
Key Takeaways: Intuit benefits from long-term digitization and AI trends, but the current rate backdrop is not ideal for multiple expansion. That means even good execution may not immediately translate into a higher stock price. The macro setup is supportive for the business, but less supportive for the valuation multiple.
8. Fisher 15 Points Score#
| Fisher Area | Score (1-5) | Comment |
|---|---|---|
| Market potential | 4 | Large SMB and tax ecosystems |
| Product development | 4 | Ongoing platform expansion |
| R&D effectiveness | 4 | Strong software innovation base |
| Sales organization | 4 | Broad distribution and brand strength |
| Profit margin | 5 | High-quality margins/cash flow |
| Margin improvement | 3 | Likely steady, not explosive |
| Labor/personnel | 3 | No special data |
| Executive relations | 4 | Generally stable |
| Management depth | 4 | Mature platform company |
| Cost/accounting controls | 4 | Strong large-cap discipline |
| Outstanding moat features | 5 | Brand, switching costs, data, ecosystem |
| Long-range outlook | 4 | Durable |
| Dilution risk | 4 | Lower than speculative growers |
| Candor | 3 | No special evidence either way |
| Integrity | 4 | No major red flags in pack |
| Total | 59 / 75 | GOOD |
Key Takeaways: Intuit scores well because it combines durable products, strong profitability, and a real platform moat. The weaker areas are not alarming; they are mostly about missing evidence rather than visible problems. Overall, this is a high-quality growth compounder, but not a perfect Fisher-style moonshot.
9. Valuation Analysis#
| Metric | Value | Read |
|---|---|---|
| Price | $393 | - |
| P/E | 25.57x | Reasonable for quality if EPS can compound double digits |
| Revenue growth | 15.6% | Solid |
| PEG (using rev growth proxy only) | ~1.64x | Fair, not cheap |
| FCF yield | 5.6% | Helpful valuation support |
| Market cap | $109.36B | Large-cap limits rerating magnitude |
Key Takeaways: The valuation does not look stretched relative to the quality of the business. At the same time, it is not screamingly cheap on a Lynch basis, since the PEG is comfortably above 1 if we use the available growth proxy. This supports a balanced stance: attractive quality, but not an obvious mispricing.
10. Growth Investor Scorecard#
| Criterion | Weight | Score (1-5) | Weighted |
|---|---|---|---|
| Story | 10% | 4.5 | 0.45 |
| TAM & Runway | 20% | 3.0 | 0.60 |
| Revenue Growth | 20% | 3.5 | 0.70 |
| Unit Economics | 15% | 4.0 | 0.60 |
| Competitive Position | 10% | 4.5 | 0.45 |
| Management Quality | 10% | 4.0 | 0.40 |
| Macro Setup | 5% | 3.0 | 0.15 |
| Profitability Path | 5% | 4.5 | 0.23 |
| Valuation | 5% | 3.5 | 0.18 |
| Total | | | 3.76 / 5.0 |
Key Takeaways: Intuit lands in the upper-middle range of the scorecard. That means it is a good business with a credible setup, but not one with enough asymmetry to justify maximum enthusiasm. In this framework, it is close to advocate quality, but the lack of a clear inflection keeps it at watch.
11. Position Size Stance#
| Stance | Suggested Approach |
|---|---|
| WATCH | Good candidate for a starter position on weakness or a hold if already owned |
| Size today | Small-to-moderate, not concentrated |
| Upgrade trigger | Evidence of growth reacceleration in GBSG, AI monetization, or better-than-feared Credit Karma recovery |
| Downgrade trigger | Mid-teens growth slips toward low teens with no margin upside |
Key Takeaways: This is not an avoid. It is a high-quality name worth monitoring closely and possibly owning, but not at a "back up the truck" size from the current fact pattern. For a growth investor, the key is waiting for either a cleaner inflection or a cheaper entry.
12. Key Risks and Catalysts#
| Risks | Catalysts |
|---|---|
| Higher rates compress growth multiples | AI-driven product monetization |
| Credit Karma cyclicality | QuickBooks ecosystem cross-sell acceleration |
| SMB macro slowdown | Payments/payroll attach-rate gains |
| Tax simplification/regulatory changes | Margin expansion from scale |
| Competitive pressure in marketing/payments | Stock rerating if market recognizes durable FCF and reasonable P/E |
Key Takeaways: The near-term risks are mostly macro and segment-specific rather than existential. The upside comes from Intuit proving it can turn platform breadth and AI into renewed acceleration. If that happens while valuation remains disciplined, the setup improves materially.
Bottom Line#
Intuit is a high-quality fast grower / compounder, but based on the data available, it is not showing a decisive Druckenmiller-style acceleration inflection and it likely fails the pure ten-bagger runway test from current scale. The stock looks fairly valued to mildly attractive, helped by a solid 5.6% FCF yield and a non-demanding 25.6x P/E for a durable franchise.
For now, the right call is WATCH: excellent business, reasonable valuation, but not enough evidence yet of a major underappreciated growth reacceleration.
Market Technical Analysis#
INTU Technical Review#
I selected these 8 indicators because they are the most complementary for INTU's current setup: a long-term damaged trend, a medium-term basing attempt, and a short-term rebound that is losing momentum.
| Indicator | Why it matters now |
|---|---|
| close_200_sma | Confirms the primary long-term trend, which is still decisively bearish |
| close_50_sma | Tracks the medium-term base/recovery zone and acts as a key resistance reference |
| close_10_ema | Shows whether the short-term rebound is still intact or already rolling over |
| macd | Measures medium-term momentum recovery versus renewed downside pressure |
| macdh | Helps detect whether momentum is improving or fading before MACD turns decisively |
| rsi | Shows whether selling pressure is exhausted or whether upside has enough thrust |
| atr | Essential for risk management because INTU remains volatile after its large drawdown |
| vwma | Adds price-volume confirmation and helps assess whether rallies are supported by participation |
Key Takeaways: These eight indicators cover the full stack of analysis without much overlap. Together they show trend, momentum, volatility, and volume confirmation, which is especially important for a stock like INTU that has already suffered a major trend break and is now trying to stabilize rather than trend cleanly.
Price Structure and Trend Context#
Over the last year, INTU has undergone a major regime shift. The stock traded near the mid-700s to low-800s in mid-2025, then began a prolonged deterioration that accelerated sharply in early 2026. The most important structural fact is that the stock collapsed from prior highs above 800 to a trough near the mid-300s, effectively cutting the stock by more than half at one point. That is not a routine pullback; it is a deep repricing event.
Since that sharp decline, price action has transitioned into a repair phase, not yet a true uptrend. The rebound from the April low near 351 carried INTU back toward the low 400s, but that bounce has so far been fragmented rather than impulsive. The stock has repeatedly failed to build sustained upside follow-through and has oscillated in a wide range roughly centered around the high-380s to low-400s.
This leaves INTU in a technically delicate position: - the long-term trend is still negative, - the medium-term trend is trying to flatten, - the short-term trend has weakened again after a rebound attempt.
That combination usually describes a stock in base-building or bear-market consolidation, not one that has yet proven durable leadership.
Trend and Momentum Snapshot#
| Metric | Latest reading | Interpretation |
|---|---|---|
| Close (2026-05-15) | 393.00 | Trading well below major long-term trend levels |
| close_10_ema | 389.34 | Price is slightly above short-term trend support |
| close_50_sma | 411.30 | Price remains below medium-term trend resistance |
| close_200_sma | 566.86 | Long-term trend is decisively bearish |
| macd | -5.57 | Momentum still negative on an absolute basis |
| macdh | -0.08 | Momentum improvement has nearly stalled |
| rsi | 48.78 | Neutral, slightly below strong bullish territory |
| atr | 18.04 | Elevated daily movement; risk still high |
| vwma | 392.01 | Price is only marginally above volume-weighted support |
Key Takeaways: INTU is showing a short-term stabilization because price sits just above the 10-day EMA and VWMA. But the bigger picture remains weak because the stock is still below both the 50-day and 200-day moving averages, and MACD remains negative. This means the rebound has not yet matured into a confirmed medium-term reversal.
Moving Average Analysis#
The 200 SMA at 566.86 is falling steadily and sits far above the current price. That gap is enormous. It tells us that the stock's longer-term damage is still unresolved, and no strategic trend-following investor would call this a healed chart yet. Even if INTU rallies further, the 200-day area is so distant that it should be viewed as a future objective, not an immediate target.
The 50 SMA at 411.30 is far more relevant right now. Unlike the 200-day line, the 50-day average has flattened somewhat after falling hard from February through April. That flattening matters because it suggests the panic phase has eased. However, the latest close at 393 remains below that 50-day benchmark, so the medium-term trend is still not bullish. In practical terms, the 50-day zone around 411-416 remains an overhead resistance band.
The 10 EMA at 389.34 is the near-term pivot. INTU closed slightly above it, which means the short-term bounce is not dead yet. But the cushion is very thin. Because the 10 EMA is only a few points below price, any modest weakness could push the stock back under short-term trend support.
A subtle but important point: the hierarchy of the moving averages is still unhealthy. Price is below the 50-day, and the 50-day is far below the 200-day. That is the signature of a stock that may be bottoming, but has not yet reversed trend.
MACD and Momentum Analysis#
MACD is negative at -5.57, so momentum is still below the zero line. That means the intermediate trend remains bearish despite the rebound from April lows. However, the behavior of MACD over the last month is more nuanced than the headline number.
In mid-April, MACD was deeply negative near -20, reflecting heavy downside momentum. From there, it improved dramatically to the -3.5 to -4 area in early May. That was a meaningful momentum recovery and aligned with INTU's rebound from the mid-300s toward the low-400s.
But now momentum has started to fade again: - MACD improved sharply from April, - then stalled in early May, - and has recently drifted back weaker.
The MACD histogram at -0.08 is especially informative. Earlier in May it was solidly positive, signaling that downside momentum was easing and short-term upside thrust was building. Now it has almost returned to zero and slightly negative. That usually means the previous rebound is running out of steam, and the market is waiting for a fresh catalyst.
This is not a fresh bearish collapse signal by itself. Instead, it suggests INTU has shifted from a recovery impulse into a hesitation phase. Traders should interpret that as a warning that upside follow-through is becoming less reliable unless the stock can reclaim resistance quickly.
RSI Analysis#
RSI at 48.78 is close to neutral. That has several implications.
First, INTU is no longer washed out the way it was in early April, when RSI dropped into the mid-20s. That extreme oversold condition helped set up the rebound. That oversold fuel has already been spent.
Second, RSI is not strong enough to validate a powerful new bullish leg. During stronger recoveries, RSI typically pushes and holds above 55-60, showing persistent buying pressure. INTU has not done that convincingly. Instead, RSI has oscillated mostly in the 40s and low 50s, which is consistent with range trading, not trend leadership.
Third, neutral RSI means the next directional move has room to expand. There is no immediate momentum exhaustion on either side. If price breaks above resistance, RSI can still build. If price slips below short-term support, RSI can also deteriorate quickly without first needing to unwind overbought conditions.
So RSI is effectively confirming the broader read: the stock is stabilized, but not yet strong.
Volatility and Risk: ATR#
ATR at 18.04 remains elevated, even though it has cooled from the more stressed readings above 20 seen in late March and early April. Relative to a stock trading around 393, an ATR around 18 implies daily movement of roughly 4.5% of price, which is substantial.
That matters in two ways: 1. Breakouts need confirmation. A one-day move above resistance may simply be noise in a high-ATR environment. 2. Stops need wider placement. Tight stops can be repeatedly shaken out because normal daily fluctuations are still large.
The slight decline in ATR over recent weeks is constructive. It implies panic volatility is subsiding. But it is not low enough to call the chart calm. INTU remains a stock that can produce large swings in both directions.
For swing traders, this means position sizing should be conservative. For investors, it means patience is required; the stock is still digesting a violent prior breakdown.
Volume Confirmation: VWMA#
The VWMA at 392.01 is almost identical to the current price at 393. That is useful because it shows the stock is sitting right on top of its recent volume-weighted equilibrium area. In other words, buyers and sellers have recently agreed on value in this zone.
This produces a very specific interpretation: - when price is above VWMA, rallies have at least some volume support, - when price falls below VWMA, the recovery narrative weakens quickly.
Because the gap between price and VWMA is tiny, INTU is balanced on a knife-edge. There is no strong volume-backed upside extension yet. The stock has not separated from its weighted average enough to show decisive institutional accumulation. But it also has not fully lost that support.
That makes VWMA a practical tactical marker. Sustained closes above both VWMA and the 10 EMA keep the rebound attempt alive. A drop below both would suggest that the market is leaning back into distribution rather than accumulation.
What Traders Should Watch Next#
| Zone / Signal | Importance | What it would mean |
|---|---|---|
| 389-392 area | Near-term support | Holding here preserves the short-term rebound structure |
| 371-378 area | Lower support | A return here would imply the recent bounce is failing |
| 404-412 area | First resistance | Reclaiming this zone would improve medium-term tone |
| Above 50 SMA (~411) | Trend test | Would be the first meaningful sign of a stronger recovery |
| MACDH back positive and expanding | Momentum trigger | Suggests upside thrust is re-accelerating |
| RSI above 55 | Strength confirmation | Would indicate buyers are gaining control |
| Drop below 10 EMA and VWMA together | Tactical warning | Signals weakening short-term demand |
| ATR rising again with price weakness | Risk escalation | Suggests renewed breakdown pressure rather than orderly consolidation |
Key Takeaways: The most important battle is happening near the 389 to 392 area, where price, the 10-day EMA, and VWMA are clustered. If INTU can hold that zone and then retake the 404 to 412 region, the chart improves noticeably. If it loses near-term support first, the stock risks sliding back toward the upper-370s and reopening the broader downtrend debate.
Trading Interpretation#
INTU currently looks more like a tradable recovery attempt inside a damaged chart than a clean trend-following long. That distinction matters.
For short-term traders, the setup is usable, but only with disciplined levels. The stock is trying to hold short-term support, yet momentum has cooled enough that chasing strength without a confirmed breakout is risky.
For swing traders, the key question is whether INTU can reclaim and hold above the 50-day SMA. Until that happens, rallies are still vulnerable to being classified as countertrend moves.
For longer-term investors, the 200-day SMA and the scale of the prior drawdown say caution is still warranted. The stock may be forming a base, but base formation is not the same as trend reversal. A real longer-term improvement would require: - the 50-day SMA to turn higher and be reclaimed, - momentum to move positive on MACD, - price to begin putting distance between itself and the VWMA/10 EMA cluster, - and ultimately a much smaller gap to the 200-day average.
Right now, INTU is in the middle innings of stabilization, not the late innings of a full recovery.
Bottom Line#
The technical picture for INTU is cautiously stabilizing but still structurally weak. The stock has stopped cascading lower, volatility has moderated, and price remains marginally above very short-term support. Those are real improvements.
However, the more important trend evidence is still not bullish: - price is below the 50-day SMA, - far below the 200-day SMA, - MACD remains negative, - RSI is neutral rather than strong, - and the recent rebound is losing momentum rather than accelerating.
The most likely near-term interpretation is range-bound consolidation with a fragile upward bias, provided the stock holds the high-380s/low-390s area. A decisive move above 404-412 would improve the outlook and strengthen the case for a deeper recovery. A failure back below 389 would weaken the rebound and raise the odds of another test of lower support.
| Category | Current read | Trading implication |
|---|---|---|
| Long-term trend | Bearish | Still no strategic trend reversal |
| Medium-term trend | Weak / trying to base | Needs reclaim of 50 SMA |
| Short-term trend | Slightly positive but fragile | Must hold 10 EMA and VWMA |
| Momentum | Recovering, then stalling | Wait for renewed MACD expansion |
| RSI | Neutral | No overbought risk, but no strong thrust either |
| Volatility | Elevated | Use wider stops and smaller sizing |
| Volume confirmation | Balanced | No strong accumulation breakout yet |
| Overall stance | Cautious watchlist long, not full conviction | Better on confirmation than anticipation |
Key Takeaways: INTU is no longer in freefall, but it has not yet proven a durable bullish reversal. The stock is sitting at an important decision area where short-term support is intact, but medium- and long-term resistance still dominate. Traders should stay flexible and let price confirm the next move rather than assuming the rebound will automatically continue.
News & Events Analysis#
Intuit (INTU) trading and investment note#
I could not complete the full fresh-news pull because the tool environment returned errors for the required earnings and stock-specific news functions. I did, however, use the shared research pack you provided, which already contains the most important recent earnings context and some recent market color. Based on that, here is a focused trading-oriented update.
Market setup and what matters for INTU right now#
INTU is trading in a tougher rate backdrop. The shared news pack shows software and fintech names sold off as the April PPI report pushed the 10-year Treasury yield to about 4.49%, which matters because higher long-end yields usually compress valuation multiples for durable-growth software names. For Intuit specifically, that means near-term price action may be driven less by fundamental deterioration and more by factor pressure on high-margin compounders.
That distinction matters for traders. The stock appears to be caught between: - still-solid business momentum, with revenue growth of 15.6% YoY, - very strong gross margin of 79.6%, - decent profitability and capital efficiency, including 19.6% ROE and 5.6% FCF yield, - but a market that is less willing to pay up for long-duration growth when yields rise.
In other words, this looks more like a valuation and sentiment drawdown than a clear fundamental break, unless upcoming earnings or guidance prove otherwise.
Latest earnings context#
The shared pack did not include the full earnings-release article details, and my attempt to fetch the dedicated earnings tool failed in this environment. So I cannot verify the exact latest reported fiscal quarter from the tool output here.
What can be said clearly: - Intuit has reported recently enough to still be described in recent coverage as posting double-digit underlying growth. - The most recent available earnings context in the shared pack supports that the core business has remained operationally healthy even as the stock has weakened in 2026. - Because the dedicated earnings tool failed, the exact reporting period, headline beats/misses, and any formal guidance change versus prior guidance cannot be confirmed from the live tool output in this run.
For trading purposes, that uncertainty is important. If you need a precise post-earnings positioning call, the next step should be to verify the latest fiscal quarter release directly, especially: - Small Business / Self-Employed growth, - Consumer tax season performance, - Credit Karma trajectory, - AI-related product monetization commentary, - full-year guidance change, if any.
What changed versus prior expectations#
Even without the missing exact release details, the market signal is fairly clear: - the stock has been "crushed in 2026" despite continued double-digit business growth, - which suggests expectations or valuation were previously higher than what the market now supports, - and/or investors are rotating away from software names as macro rates rise.
That often happens when a company remains fundamentally good, but: - guidance is merely in line rather than raised, - a segment like Credit Karma or consumer finance is uneven, - tax-season upside is already priced in, - or investors shift focus from growth durability to multiple discipline.
So the likely change versus prior expectations is not necessarily collapsing earnings power, but a lower acceptable valuation multiple.
Company-specific read-through#
Intuit's setup remains attractive fundamentally: - high gross margins imply pricing power and product stickiness, - double-digit revenue growth at this scale supports the platform thesis, - current ratio of 1.36 suggests liquidity is fine, - FCF yield of 5.6% is becoming more relevant as investors favor cash-generative software.
Key product areas to watch: - TurboTax: tax season execution and attach opportunities, - QuickBooks: SMB health, ARPU, payroll/accounting ecosystem demand, - Credit Karma: consumer credit demand and lender marketing spend, - Mailchimp: cross-sell and stabilization in SMB marketing budgets.
For investors, the most likely internal swing factor is mix. If QuickBooks and the business platform remain strong while Credit Karma is softer, the consolidated story can still be good, but investors may hesitate to re-rate the stock aggressively.
Positioning and flow signals#
The shared pack's 13F note shows Steve Cohen's Point72 trimmed the position by 24.5% as of 2026-03-31. That is not a definitive bearish signal by itself, because 13Fs are lagged and can reflect risk management rather than a thesis break. Still, for shorter-term traders it indicates at least one major fast-money investor reduced exposure into recent weakness or volatility.
That can matter because software leaders often need: - either a clean earnings beat-and-raise, - or a macro yield pullback, before institutional buyers scale back in aggressively.
Macro overlay#
The macro overhang is probably the main short-term driver: - hotter producer inflation, - higher Treasury yields, - risk of multiple compression in software, - event risk from upcoming Fed minutes and PMI data.
If yields stay elevated or move higher, INTU may struggle to rally even on decent fundamentals. If yields retrace, high-quality software names like Intuit could rebound quickly because the business quality is still visible in the metrics.
Trading implications#
| Theme | Bullish interpretation | Bearish interpretation | Trading implication |
|---|---|---|---|
| Recent selloff | Oversold quality compounder | Market pricing in slower forward growth or less upside | Watch for reflex rally if macro stabilizes |
| Fundamentals | 15.6% YoY growth and 79.6% gross margin support quality | Growth may not be strong enough to defend prior multiple in high-rate market | Valuation sensitivity remains high |
| Earnings setup | Underlying business still showing double-digit growth | Missing precise earnings/guidance confirmation adds uncertainty | Avoid oversized positions before confirming latest release details |
| Macro rates | Any Treasury yield pullback could help software multiples | Rising yields can keep pressure on INTU regardless of execution | Trade with rates, not just company news |
| Investor flow | Trim by Point72 may already reflect derisking that is now in the price | Smart money reduction can signal caution on near-term setup | Better for tactical entries than momentum chasing |
Key Takeaways: Intuit looks like a fundamentally solid company whose stock is being pressured by valuation and macro forces more than by obvious business deterioration. The best bullish case is that the selloff has gone too far relative to still-healthy growth and margins. The main risk is that higher rates keep capping the multiple even if execution remains good.
Bottom line#
INTU currently looks more like a high-quality business in a hostile macro tape than a broken fundamental story. That favors: - medium-term investors accumulating on weakness if they can tolerate rate-driven volatility, - but shorter-term traders should stay disciplined until either Treasury yields ease or the latest earnings/guidance details are fully confirmed.
The missing piece for conviction is the exact latest earnings release and guidance delta. Since the required earnings tool failed in this run, I would treat this as a provisional but useful framework: fundamentally constructive, tactically rate-sensitive, and likely better on pullbacks than on breakouts.
| Category | Key point | Why it matters |
|---|---|---|
| Valuation/fundamentals | P/E 25.57, revenue growth 15.6%, gross margin 79.6%, FCF yield 5.6% | Suggests a still-strong, cash-generative software platform |
| Recent sentiment | Stock weakened sharply in 2026 despite business growth | Indicates multiple compression and sentiment damage rather than obvious operational collapse |
| Macro | Rising Treasury yields after hotter PPI hurt software/fintech | Short-term stock direction may depend more on rates than on company execution |
| Earnings status | Recent earnings exist, but exact period and guidance change could not be confirmed in this tool run | Investors should verify latest fiscal-quarter details before making high-conviction trades |
| Flow | Point72 trimmed by 24.5% in latest 13F snapshot | Shows at least some institutional derisking into volatility |
| Trading stance | Constructive on quality, cautious tactically | Best suited for selective accumulation, not blind momentum buying |
Key Takeaways: The summary is straightforward: Intuit still screens as a high-quality business, but the stock is being judged through a harsher macro and valuation lens. Investors should focus on confirming the latest earnings guidance and watching Treasury yields, because those two factors are likely to drive the next meaningful move.
Guru Attention Analysis#
Tracking 13F filings and recent activity of legendary super-investors to identify smart-money conviction and rotation.
No guru attention analysis available.
Options Market Analysis#
Reading options flow - put/call ratios, IV skew, and unusual activity - to gauge institutional positioning and event-driven risk.
INTU Options Positioning Report#
Data as of 2026-05-17
1. Put/Call Ratio Analysis#
| Expiry | Call OI | Put OI | Put/Call OI | Call Vol | Put Vol | Put/Call Vol |
|---|---|---|---|---|---|---|
| 2026-05-22 | 4,309 | 4,255 | 0.99 | 1,604 | 1,801 | 1.12 |
| 2026-05-29 | 1,130 | 2,112 | 1.87 | 2,340 | 876 | 0.37 |
| 2026-06-05 | 497 | 856 | 1.72 | 134 | 696 | 5.19 |
| Near-term total | 5,936 | 7,223 | 1.22 | 4,078 | 3,373 | 0.83 |
Key Takeaways: INTU's aggregate near-term put/call open-interest ratio of 1.22 is well above the roughly neutral 0.7 baseline, which points to a market carrying meaningful downside protection or a cautious institutional stance. But the volume ratio of 0.83 is less bearish than the OI suggests, meaning fresh trading flow is not uniformly pessimistic. The most notable divergence is the 2026-05-29 expiry: existing positioning is put-heavy, yet new activity that week is skewing much more toward calls.
Interpretation - Overall OI skew is defensive/bearish: A 1.22 put/call OI ratio is clearly elevated versus neutral, suggesting traders have built a larger put base than normal. - Flow is not outright bearish: Aggregate put/call volume ratio of 0.83 is only modestly put-leaning and actually below 1.0, implying current trading is somewhat more call-friendly than the OI base. - Important split by expiry: - 2026-05-22: basically balanced OI, slight put-heavy volume. - 2026-05-29: strongly put-heavy OI (1.87) but call-heavy fresh volume, often a sign of traders adding upside exposure against an already cautious backdrop. - 2026-06-05: put-heavy in both OI and volume, which leans more classically bearish/hedging.
2. Implied Volatility Assessment#
| Expiry | ATM Call IV | ATM Put IV | IV Read |
|---|---|---|---|
| 2026-05-22 | 90.9% | 88.0% | Extremely elevated |
| 2026-05-29 | 76.0% | 74.3% | Very elevated |
| 2026-06-05 | 69.2% | 66.4% | Elevated |
Key Takeaways: Near-term IV is very high across the board, especially in the front weekly expiry where ATM IV is around 90%. That typically signals the options market is pricing in a sizable near-term move, often around an earnings event or other company-specific catalyst. Interestingly, calls are carrying slightly higher ATM IV than puts, which softens the usual downside-fear interpretation.
IV interpretation - IV is elevated across all near-term maturities, especially 2026-05-22, where ATM IV is near 90%. - This level of IV strongly suggests the market is pricing a known catalyst or a large expected move in the next 1-3 weeks. - ATM call IV is slightly above ATM put IV in each shown expiry. That is not the classic bearish put-premium profile. It hints that traders may be paying up for upside optionality too.
Skew assessment - The tool output does not provide full OTM put-vs-OTM call skew by delta/strike, so a precise skew curve cannot be calculated. - However, based on available ATM readings, skew does not appear dominated by downside panic. If anything, front-end call IV being modestly richer than put IV suggests some upside chase/event speculation rather than pure crash hedging. - Because full OTM skew is unavailable, confidence on skew direction is moderate, not high.
3. Unusual Options Activity#
| Expiry | Type | Strike | Volume | OI | Vol/OI | IV | Positioning Read |
|---|---|---|---|---|---|---|---|
| 2026-05-29 | CALL | 370 | 1,000 | 24 | 41.7x | 76.4% | Fresh speculative upside positioning |
| 2026-05-29 | CALL | 350 | 601 | 24 | 25.0x | 78.5% | Aggressive near-term bullish bet |
Key Takeaways: The standout unusual flow is concentrated entirely in near-term calls for the 2026-05-29 expiry, where volume massively exceeds existing open interest. That usually indicates fresh opening activity rather than closing trades. Because both strikes are low-absolute-strike versus INTU's usual share price region, this likely reflects deep ITM call structures or special-chain effects, but the directional message from the provided feed is still call-heavy rather than put-heavy.
What it implies - Fresh call buying dominates the unusual flow, not puts. - Volume exceeding OI by 25x to 41.7x is a strong sign these are new positions, not just old trades being unwound. - Given the short expiry horizon and elevated IV, this looks more like event-driven speculation than slow institutional hedging. - Without premium, side-of-market, or exact underlying reference from the chain snapshot, I cannot fully distinguish whether these were: - outright long calls, - part of a spread, - or call overwriting/stock replacement structures. - Still, the absence of unusual puts is meaningful: the standout fresh flow in the data is upside-oriented.
4. Open Interest Concentration and Potential Pinning/Gamma Effects#
| Expiry | Notable OI Character | Market Impact Read |
|---|---|---|
| 2026-05-22 | Highest overall OI among listed expiries; calls and puts nearly balanced | Strongest near-term pinning potential due to larger total positioning |
| 2026-05-29 | Put OI materially exceeds call OI, despite strong call volume | Could create tension between legacy defensive positioning and new upside bets |
| 2026-06-05 | Smaller chain, but put-heavy | Less likely to pin tightly, more reflective of lingering hedge demand |
Key Takeaways: The 2026-05-22 weekly expiration has by far the largest total open interest, making it the most likely area for near-term gamma-related pinning or price magnet behavior. By contrast, the 2026-05-29 line shows a tug-of-war: accumulated puts suggest caution, but aggressive fresh call flow could amplify upside if the stock starts moving higher.
Gamma / pinning read - Since the tool does not provide strike-by-strike full OI distribution, exact gamma walls and max pain cannot be computed precisely. - Still, the data suggests: - 2026-05-22 is the most important near-term expiry from a dealer positioning standpoint due to the largest OI stack. - 2026-05-29 may be the more volatile expiry because fresh call activity is arriving into an already put-heavy structure. - Practical takeaway: - If INTU stays rangebound, front-week OI could dampen price movement into expiry. - If INTU breaks higher, recent call opening flow could force faster upside acceleration than the older OI structure implies.
5. Overall Options Sentiment Signal#
| Category | Signal |
|---|---|
| Put/Call OI | Bearish-to-defensive |
| Fresh Volume Flow | Mildly bullish |
| IV Level | High / event-priced |
| Unusual Activity | Bullish |
| Net Options Signal | NEUTRAL to SLIGHTLY BULLISH |
Key Takeaways: INTU's options market is not cleanly bearish, even though open interest is put-heavy. The legacy positioning says investors came in cautious, but the newest high-conviction trades are upside calls. That combination leads to a neutral-to-slightly bullish read rather than an outright bearish one.
Final read: NEUTRAL to SLIGHTLY BULLISH
Primary driver of the signal: - The existing OI base is defensive, which by itself would lean bearish. - But the freshest and most unusual flow is concentrated in calls, and ATM call IV is slightly richer than put IV, suggesting traders are paying for upside exposure into a likely event window. - Because IV is already very elevated, conviction should be tempered: the market expects a large move, but upside bets appear to be the marginal new trade.
Confidence level: Moderate - Confidence is reduced because: - the tool only provides a limited set of expiries, - no full strike-by-strike OI map is available, - and full OTM skew data is not shown. - Even so, the best directional read from the available options data is not bearish; it is cautious base positioning with a recent bullish speculative turn.
Important Caveat#
Options positioning is a forward-looking sentiment and hedging signal, not a valuation framework. For INTU, the options tape is best interpreted as: investors were cautious, but some traders are now reaching for upside into a high-volatility event window.
Summary Table#
| Metric | Read |
|---|---|
| Put/Call Ratio | OI ratio 1.22 = elevated vs. neutral 0.7; defensive/bearish base positioning. Volume ratio 0.83 = fresher flow less bearish than OI suggests |
| IV Level | Very elevated, especially 2026-05-22 ATM IV near 90%; market pricing a major near-term move/catalyst |
| Skew Direction | Based on available ATM data, slight call richness, not classic fear-driven put skew; full OTM skew unavailable |
| Unusual Activity | Bullish call activity in 2026-05-29 $370C and $350C with volume 25x-41.7x OI; likely fresh event-driven upside bets |
| Overall Signal | NEUTRAL to SLIGHTLY BULLISH |
Key Takeaways: INTU's options market is carrying a defensive legacy structure, but the newest notable trades are not reinforcing that bearishness. Instead, traders are selectively paying up for upside exposure into a high-IV event window. That keeps the overall read from slipping bearish and tilts it slightly positive.
Research Team Commentary#
The Research Manager synthesizes the Bull vs Bear debate into action-free commentary. This is a pre-risk view, not the final stance.
Intuit looks like a classic case of a very good business that may or may not be a very good stock at this exact price.
The strongest bull argument is business quality. Intuit clearly has a real franchise in TurboTax and QuickBooks, and the moat is grounded in habit, trust, embedded workflows, and the inconvenience and risk of switching core financial systems. Those are Buffett-friendly characteristics. The economics are also strong: roughly 15.6% revenue growth, 30%+ net income and free cash flow growth, nearly 80% gross margin, and high returns on capital. That combination says this is not a fragile story stock. It is a cash-generative software platform with genuine staying power. The bull case is also right that many users do not casually swap tax, payroll, and accounting systems, especially where compliance and record continuity matter. On top of that, the valuation is not obviously excessive if you give credit to the quality of the business; at $393, it is around blended fair value and below some cash-flow-based estimates.
The strongest bear argument is that Buffett investing still requires price discipline, and the margin of safety here is thin. One valuation anchor is materially below the current price at $328, while even the more favorable estimates do not imply huge upside. That means the investor is relying more on continued execution and compounding than on mispricing. The bear side is also right to push back on calling this a wide moat without qualification. Intuit's moat is meaningful, but software moats can narrow if AI lowers switching costs, if migration gets easier, or if bundled fintech competitors become "good enough." Consumer tax also carries some regulatory and pricing risk. So while the business is strong, the future may be less predictable than the clean historical numbers suggest.
My takeaway is that Intuit passes the business-quality test much more comfortably than the valuation test. This is the kind of company I would like to own at the right price, but not one I feel compelled to chase when the discount to intrinsic value is debatable. In past situations like this, the mistake is usually one of two extremes: either rejecting a compounding business because it does not look optically cheap, or overpaying for quality by assuming durability solves every valuation issue. The better lesson is to separate admiration from underwriting. Intuit deserves admiration. The stock deserves patience.
So my stance is WATCH.
Core takeaway: Intuit is a high-quality, durable, cash-rich franchise with a real moat, but today's price does not offer enough margin of safety to fully satisfy a Buffett-style value discipline. If the stock were meaningfully cheaper, the case would get much stronger quickly.
Rationale: From a value-investing perspective, the company checks many of the right boxes: understandable business model, sticky customer relationships, strong profitability, strong returns on capital, and recurring need-based demand. That matters more than short-term chart weakness. But Buffett's framework is not just about buying quality; it is about buying quality with room for error. Here, the valuation range is wide enough, and the competitive outlook uncertain enough, that I cannot say the stock is clearly undervalued. The market does not appear wildly pessimistic. If anything, it seems to already appreciate Intuit's quality. That reduces the odds of outsized returns from multiple expansion and raises the importance of flawless execution. When a stock is priced near fair value, future returns depend heavily on sustained moat strength, prudent capital allocation, and the absence of strategic disruption. That is a higher bar than I want for a fresh value commitment.
Monitoring plan over the next 1 to 4 quarters: First, watch retention and monetization trends in QuickBooks, especially whether ecosystem products like payroll, payments, and services keep deepening customer attachment. Second, watch evidence on AI: is Intuit using AI to improve conversion, reduce churn, automate workflows, and strengthen pricing power, or is AI making alternatives more competitive? Third, monitor revenue growth quality: I want to see whether double-digit growth remains broad-based rather than driven by temporary mix or operating leverage. Fourth, track free cash flow conversion and margins for signs that defensive spending is rising faster than revenue. Fifth, pay attention to any signs of pricing pressure, customer downgrades, or weaker SMB health. Sixth, assess capital allocation: buybacks, acquisitions, and investment intensity should all be judged by whether they preserve or dilute returns on capital. Finally, valuation matters: if the stock falls materially without corresponding deterioration in the franchise, the opportunity would become more interesting.
Bottom line: Intuit is likely a wonderful business, but at the current price it looks more like a disciplined watchlist candidate than an obvious Buffett-style bargain.
WATCH
Value Investing Team Commentary#
The Investor translates the research view into an investment thesis before risk review. This is still not the final stance.
Intuit is the sort of business a long-term owner can genuinely admire. It sells mission-critical financial software into categories where trust, continuity, compliance, and workflow integration matter a great deal. QuickBooks and TurboTax are not casual consumer apps; for many users, they are embedded operating systems for small-business finance and tax preparation. That creates switching friction, recurring usage, and a degree of pricing power. From a Buffett-style lens, those are attractive traits.
The underlying numbers support that quality assessment. Revenue growth of 15.6%, net income growth above 30%, free cash flow growth above 30%, ROE near 20%, ROIC above 17%, and gross margin around 79.6% all point to a highly profitable software franchise with real economic value. This is not a speculative story dependent on distant hopes. It is already producing substantial cash and attractive returns on capital.
The key question, however, is not whether Intuit is a good business. It is whether today's price offers enough margin of safety for a disciplined long-term investor. On that point, the answer is less compelling. With the stock around $393 and fair value estimates ranging roughly from $328 to $464, the market price appears to sit in the neighborhood of reasonable value rather than obvious undervaluation. That means expected returns likely depend more on continued operational excellence than on buying a dollar for fifty cents. Buffett-style investing tolerates paying a fair price for a wonderful business, but only when the durability is exceptionally clear and the downside risks are modest.
This is where selective contrarian thinking matters. The market analyst notes weak long-term price trends and a failed short-term rebound. A pure technician may see that as a warning. A business owner should instead ask whether sentiment has become negative for reasons that impair long-term earnings power, or merely because enthusiasm has cooled. So far, the business data do not suggest a broken franchise. If anything, the price weakness against still-solid fundamentals hints that sentiment is softer than business reality. That is worth noticing.
But contrarianism should be selective, not reflexive. The market may be discounting real concerns: AI could reduce friction in switching financial software, fintech bundles may become more competitive, and tax preparation could face regulatory or product simplification pressure over time. Software moats are real, but they are not as invulnerable as railroad or consumer brand moats. Intuit's moat likely remains strong, yet investors should resist the temptation to declare it permanently unassailable just because historical returns have been excellent.
What the market may be underappreciating is Intuit's ability to turn AI from a threat into a moat enhancer. In a business built around financial data, workflow automation, compliance support, and customer history, AI can deepen product usefulness and raise switching costs if managed well. If Intuit uses AI to improve bookkeeping automation, tax accuracy, customer acquisition, and ecosystem attachment, it may emerge stronger, not weaker. In that scenario, current caution could prove too pessimistic. On the other hand, if AI commoditizes parts of the user experience and lowers migration pain, today's valuation leaves less room for disappointment.
So the investment case comes down to underwriting discipline. Intuit appears to be a high-quality compounding business, but not one offered at a plainly bargain price. I would be interested if sentiment worsened and the stock fell materially without corresponding deterioration in customer retention, ecosystem monetization, or cash generation. That is often where the best opportunities in quality software appear: not when the business is undiscovered, but when a temporarily nervous market offers a strong franchise at a more forgiving valuation.
For now, I would watch several things closely: retention and attach rates in QuickBooks services, whether AI improves product economics or invites disruption, free cash flow conversion, pricing power, small-business customer health, and management's capital allocation discipline. If those remain healthy while the stock becomes cheaper, the case strengthens considerably.
ANALYST STANCE: WATCH - Intuit looks like a very good business with durable economics and likely long-term compounding potential, but the current price offers only a modest margin of safety. Admire the business, monitor the moat, and wait for either a better entry point or stronger evidence that emerging competitive risks are overstated.
Deep Values Commentary#
The Risk Management Team debates and the Risk Judge provides the final action-free verdict. This section determines the final ADVOCATE / WATCH / AVOID stance.
Final Stance Scorecard#
This scorecard converts the final research view into a weighted decision frame. It does not replace the narrative judgement, but it makes the main drivers of the verdict easier to scan.
| Criterion | Score | Weight | Commentary |
|---|---|---|---|
| Business Quality | 4.25 | 30% | High returns, profitability, and Piotroski health support durability. |
| Valuation Support | 3.33 | 30% | Blends current price against available intrinsic value anchors and valuation ratios. |
| Financial Strength | 2.67 | 20% | Balance-sheet resilience reflects leverage and liquidity staying within safe ranges. |
| Growth Durability | 4.67 | 20% | Recent revenue, earnings, and free cash flow growth indicate how durable expansion looks. |
| TOTAL / FINAL STANCE | 3.74 | 100% | WATCH |
Key Takeaways#
The weighted score lands at 3.74 / 5.0, while the final stance remains WATCH. This is useful as a quick calibration aid rather than a mechanical signal.
Risk Summary#
Higher scores indicate more risk pressure. The watch threshold is a simple guardrail: above it, the position needs tighter monitoring or a wider margin of safety.
| Dimension | Current Score | Watch Threshold | Commentary |
|---|---|---|---|
| Business Quality | 1.75 | 3.00 | High returns, profitability, and Piotroski health support durability. |
| Valuation Support | 2.67 | 3.00 | Blends current price against available intrinsic value anchors and valuation ratios. |
| Financial Strength | 3.33 | 3.00 | Balance-sheet resilience reflects leverage and liquidity staying within safe ranges. |
| Growth Durability | 1.33 | 3.00 | Recent revenue, earnings, and free cash flow growth indicate how durable expansion looks. |
Key Takeaways#
This view helps readers separate where the risk sits: valuation, business quality, balance sheet, or growth durability. It is especially useful when the final stance is close to the line between WATCH and AVOID.
Frequently asked questions
Is Intuit overvalued according to DeepValues Research?
The May 17, 2026 report is Neutral (WATCH, score 3.74/5) on Intuit (INTU): it calls the shares neither clearly undervalued nor clearly overvalued; the intrinsic-value range is in the report's valuation section. The report's intrinsic-value models give a range rather than one number; this is educational research, not investment advice.
What is DeepValues Research's stance on INTU?
Neutral (WATCH, score 3.74/5) as of May 17, 2026. DeepValues stances are ADVOCATE (bullish), WATCH (neutral) or AVOID (bearish), with a weighted 0-5 scorecard; each report is a dated snapshot.
Where is the full Intuit analysis?
The full report is at https://research.deepvalues.ai/company/intu/2026-05-17-en/ (markdown twin: https://research.deepvalues.ai/company/intu/2026-05-17-en/index.md); all Intuit reports are at https://research.deepvalues.ai/company/intu/. Live fundamentals and intrinsic values for INTU are in the DeepValues app (https://deepvalues.ai) and the DeepValues API (https://app.deepvalues.ai/developers).