
Company Research METADeep Value Intelligence
Meta Platforms, Inc. (META) Deep Value Intelligence Report

In briefBullish3.75
As of Jul 29, 2026, DeepValues Research rates Meta Platforms, Inc. (META) Bullish (ADVOCATE, score 3.75/5). Meta remains a classic high-quality, asset-light platform business with unusually strong economics: very high gross margins, strong operating leverage, sustained double-digit revenue growth, and exceptional free-cash-flow generation even during a period of elevated AI and infrastructure spending. Key figures: share price $586; headline intrinsic value $968 (margin of safety 39.5%); P/E (TTM) 21.32; free-cash-flow yield 3.1%.
Source: https://research.deepvalues.ai/company/meta/2026-07-29-en/ · Markdown · More on Meta Platforms, Inc. (META)
Key takeaways
Meta remains a classic high-quality, asset-light platform business with unusually strong economics: very high gross margins, strong operating leverage, sustained double-digit revenue growth, and exceptional free-cash-flow generation even during a period of elevated AI and infrastructure spending. Using the deterministic dataset as the canonical source, the core question is not whether META is cheap on book value multiples, but whether today's price properly reflects the durability of its advertising moat, monetization runway across Family of Apps, and the near-term drag from AI capex. On that basis, the stock still screens attractively.
Contents
Intelligence Summary#
Thesis + Conditions#
Core Thesis: Executive Briefing
Key Risks: - Meta looks like a high-quality, financially strong compounder rather than a fragile "AI story." The key risk is not solvency or business impairment; it is overpaying if AI capex only defends the moat instead of expanding it. At about 21x earnings with 82% gross margin, 24%+ ROIC, and no distress, the stock appears reasonable for a business of this quality, though not a deep bargain. - Past mistakes teach us not to let quality blind us to event risk or valuation excess. But here, unlike prior stretched setups, valuation is more moderate and the thesis is long-term. So the right posture is constructive, but disciplined: own or accumulate gradually, while watching whether AI spend improves monetization, margins, and free cash flow. - ## Risk Commentary for the Long-Term Investor
Confidence: Low
Analyst Team Reports#
Fundamentals Analysis#
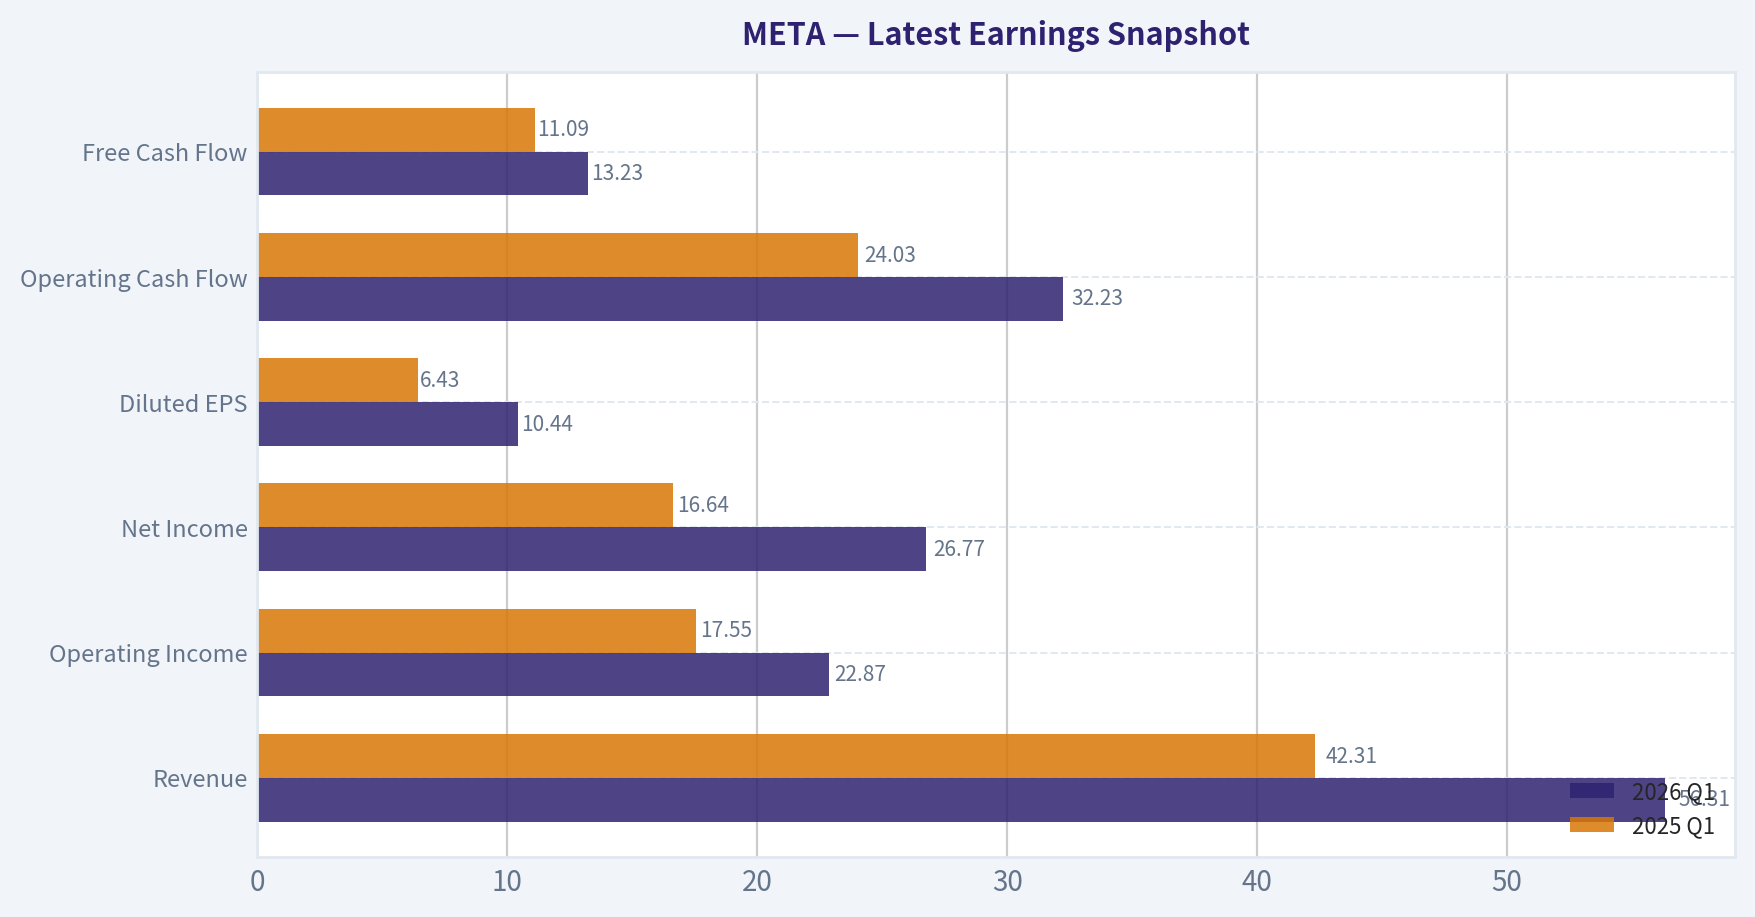
Latest Earnings Snapshot#
Most recent reported quarter anchored on 2026 Q1, with prior-year comparison when available.
| Metric | 2026 Q1 | 2025 Q1 | YoY Change |
|---|---|---|---|
| Revenue | $56.31B | $42.31B | +33.1% |
| Operating Income | $22.87B | $17.55B | +30.3% |
| Net Income | $26.77B | $16.64B | +60.9% |
| Diluted EPS | $10.44 | $6.43 | +62.4% |
| Operating Cash Flow | $32.23B | $24.03B | +34.1% |
| Free Cash Flow | $13.23B | $11.09B | +19.3% |
Key Takeaways: This snapshot anchors the most recent reported quarter before the narrative analysis. It helps readers separate long-run business quality from whatever changed in the latest earnings print.
16-Year Financial Metrics for META#
All values below are computed deterministically from raw data - not estimated by AI.
Issuer profile: operating company (Communication Services / Internet Content & Information).
16-Year Financial Metrics#
Annual rows come from reported financial statements. The final TTM row is computed from the latest four quarters.
| Metric | 2010 | 2011 | 2012 | 2013 | 2014 | 2015 | 2016 | 2017 | 2018 | 2019 | 2020 | 2021 | 2022 | 2023 | 2024 | 2025 | 2026 TTM |
|---|---|---|---|---|---|---|---|---|---|---|---|---|---|---|---|---|---|
| Market Price | N/A | N/A | $26 | $54 | $77 | $104 | $114 | $175 | $130 | $203 | $271 | $333 | $119 | $351 | $583 | $659 | $586 |
| Market Cap | N/A | N/A | $57.66B | $137.55B | $207.85B | $298.59B | $336.52B | $521.62B | $382.91B | $590.30B | $788.89B | $961.62B | $325.16B | $930.56B | $1.53T | $1.70T | $1.50T |
| P/E Ratio | N/A | N/A | 2662.00 | 91.08 | 70.93 | 81.13 | 32.97 | 32.74 | 17.32 | 31.92 | 27.07 | 24.43 | 14.01 | 23.80 | 24.54 | 28.10 | 21.29 |
| P/B Ratio | N/A | N/A | 4.91 | 8.89 | 5.76 | 6.75 | 5.69 | 7.02 | 4.55 | 5.84 | 6.15 | 7.70 | 2.59 | 6.08 | 8.38 | 7.82 | 6.16 |
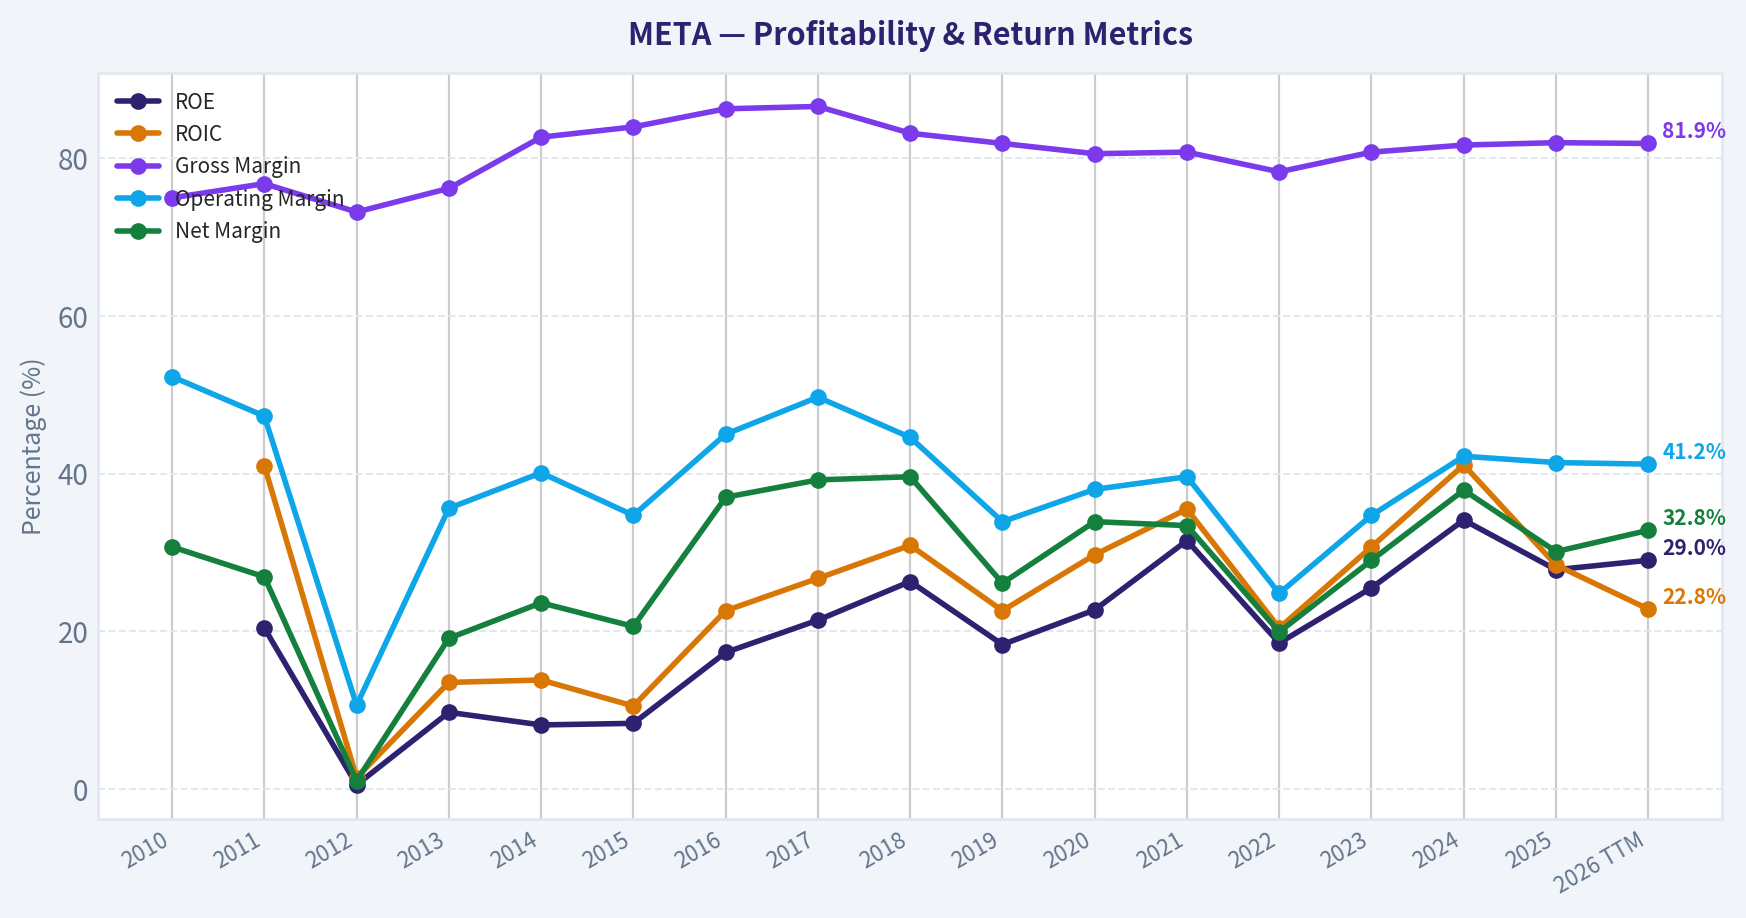
| ROE | N/A | 20.4% | 0.5% | 9.7% | 8.1% | 8.3% | 17.3% | 21.4% | 26.3% | 18.3% | 22.7% | 31.5% | 18.5% | 25.5% | 34.1% | 27.8% | 29.0% |
| ROIC | N/A | 41.0% | 1.4% | 13.5% | 13.8% | 10.5% | 22.6% | 26.7% | 30.9% | 22.6% | 29.7% | 35.5% | 20.4% | 30.7% | 41.1% | 28.4% | 22.8% |
| EPS | $0.28 | $0.46 | $0.01 | $0.60 | $1.10 | $1.29 | $3.49 | $5.39 | $7.57 | $6.43 | $10.09 | $13.77 | $8.59 | $14.87 | $23.86 | $23.49 | $27.51 |
| Revenue | $1.97B | $3.71B | $5.09B | $7.87B | $12.47B | $17.93B | $27.64B | $40.65B | $55.84B | $70.70B | $85.97B | $117.93B | $116.61B | $134.90B | $164.50B | $200.97B | $214.96B |
| Gross Profit | $1.48B | $2.85B | $3.73B | $6.00B | $10.31B | $15.06B | $23.85B | $35.20B | $46.48B | $57.93B | $69.27B | $95.28B | $91.36B | $108.94B | $134.34B | $164.79B | $176.14B |
| Gross Margin | 75.0% | 76.8% | 73.2% | 76.2% | 82.7% | 84.0% | 86.3% | 86.6% | 83.2% | 81.9% | 80.6% | 80.8% | 78.3% | 80.8% | 81.7% | 82.0% | 81.9% |
| Operating Margin | 52.3% | 47.3% | 10.6% | 35.6% | 40.1% | 34.7% | 45.0% | 49.7% | 44.6% | 33.9% | 38.0% | 39.6% | 24.8% | 34.7% | 42.2% | 41.4% | 41.2% |
| Net Income | $606.0M | $1.00B | $53.0M | $1.50B | $2.94B | $3.69B | $10.22B | $15.93B | $22.11B | $18.48B | $29.15B | $39.37B | $23.20B | $39.10B | $62.36B | $60.46B | $70.59B |
| Net Margin | 30.7% | 26.9% | 1.0% | 19.1% | 23.6% | 20.6% | 37.0% | 39.2% | 39.6% | 26.1% | 33.9% | 33.4% | 19.9% | 29.0% | 37.9% | 30.1% | 32.8% |
| Revenue Growth | N/A | 88.0% | 37.1% | 54.7% | 58.4% | 43.8% | 54.2% | 47.1% | 37.4% | 26.6% | 21.6% | 37.2% | -1.1% | 15.7% | 21.9% | 22.2% | 7.0% |
| Net Income Growth | N/A | 65.0% | -94.7% | 2730.2% | 96.0% | 25.4% | 177.0% | 56.0% | 38.8% | -16.4% | 57.7% | 35.1% | -41.1% | 68.5% | 59.5% | -3.1% | 16.8% |
| Free Cash Flow Growth | N/A | 132.8% | -60.0% | 658.6% | 92.1% | 41.9% | 49.0% | 50.5% | -12.1% | 38.1% | 11.2% | 65.3% | -50.5% | 128.5% | 22.7% | -14.7% | 4.6% |
| Total Book Value | N/A | $4.90B | $11.76B | $15.47B | $36.10B | $44.22B | $59.19B | $74.35B | $84.13B | $101.05B | $128.29B | $124.88B | $125.71B | $153.17B | $182.64B | $217.24B | $243.68B |
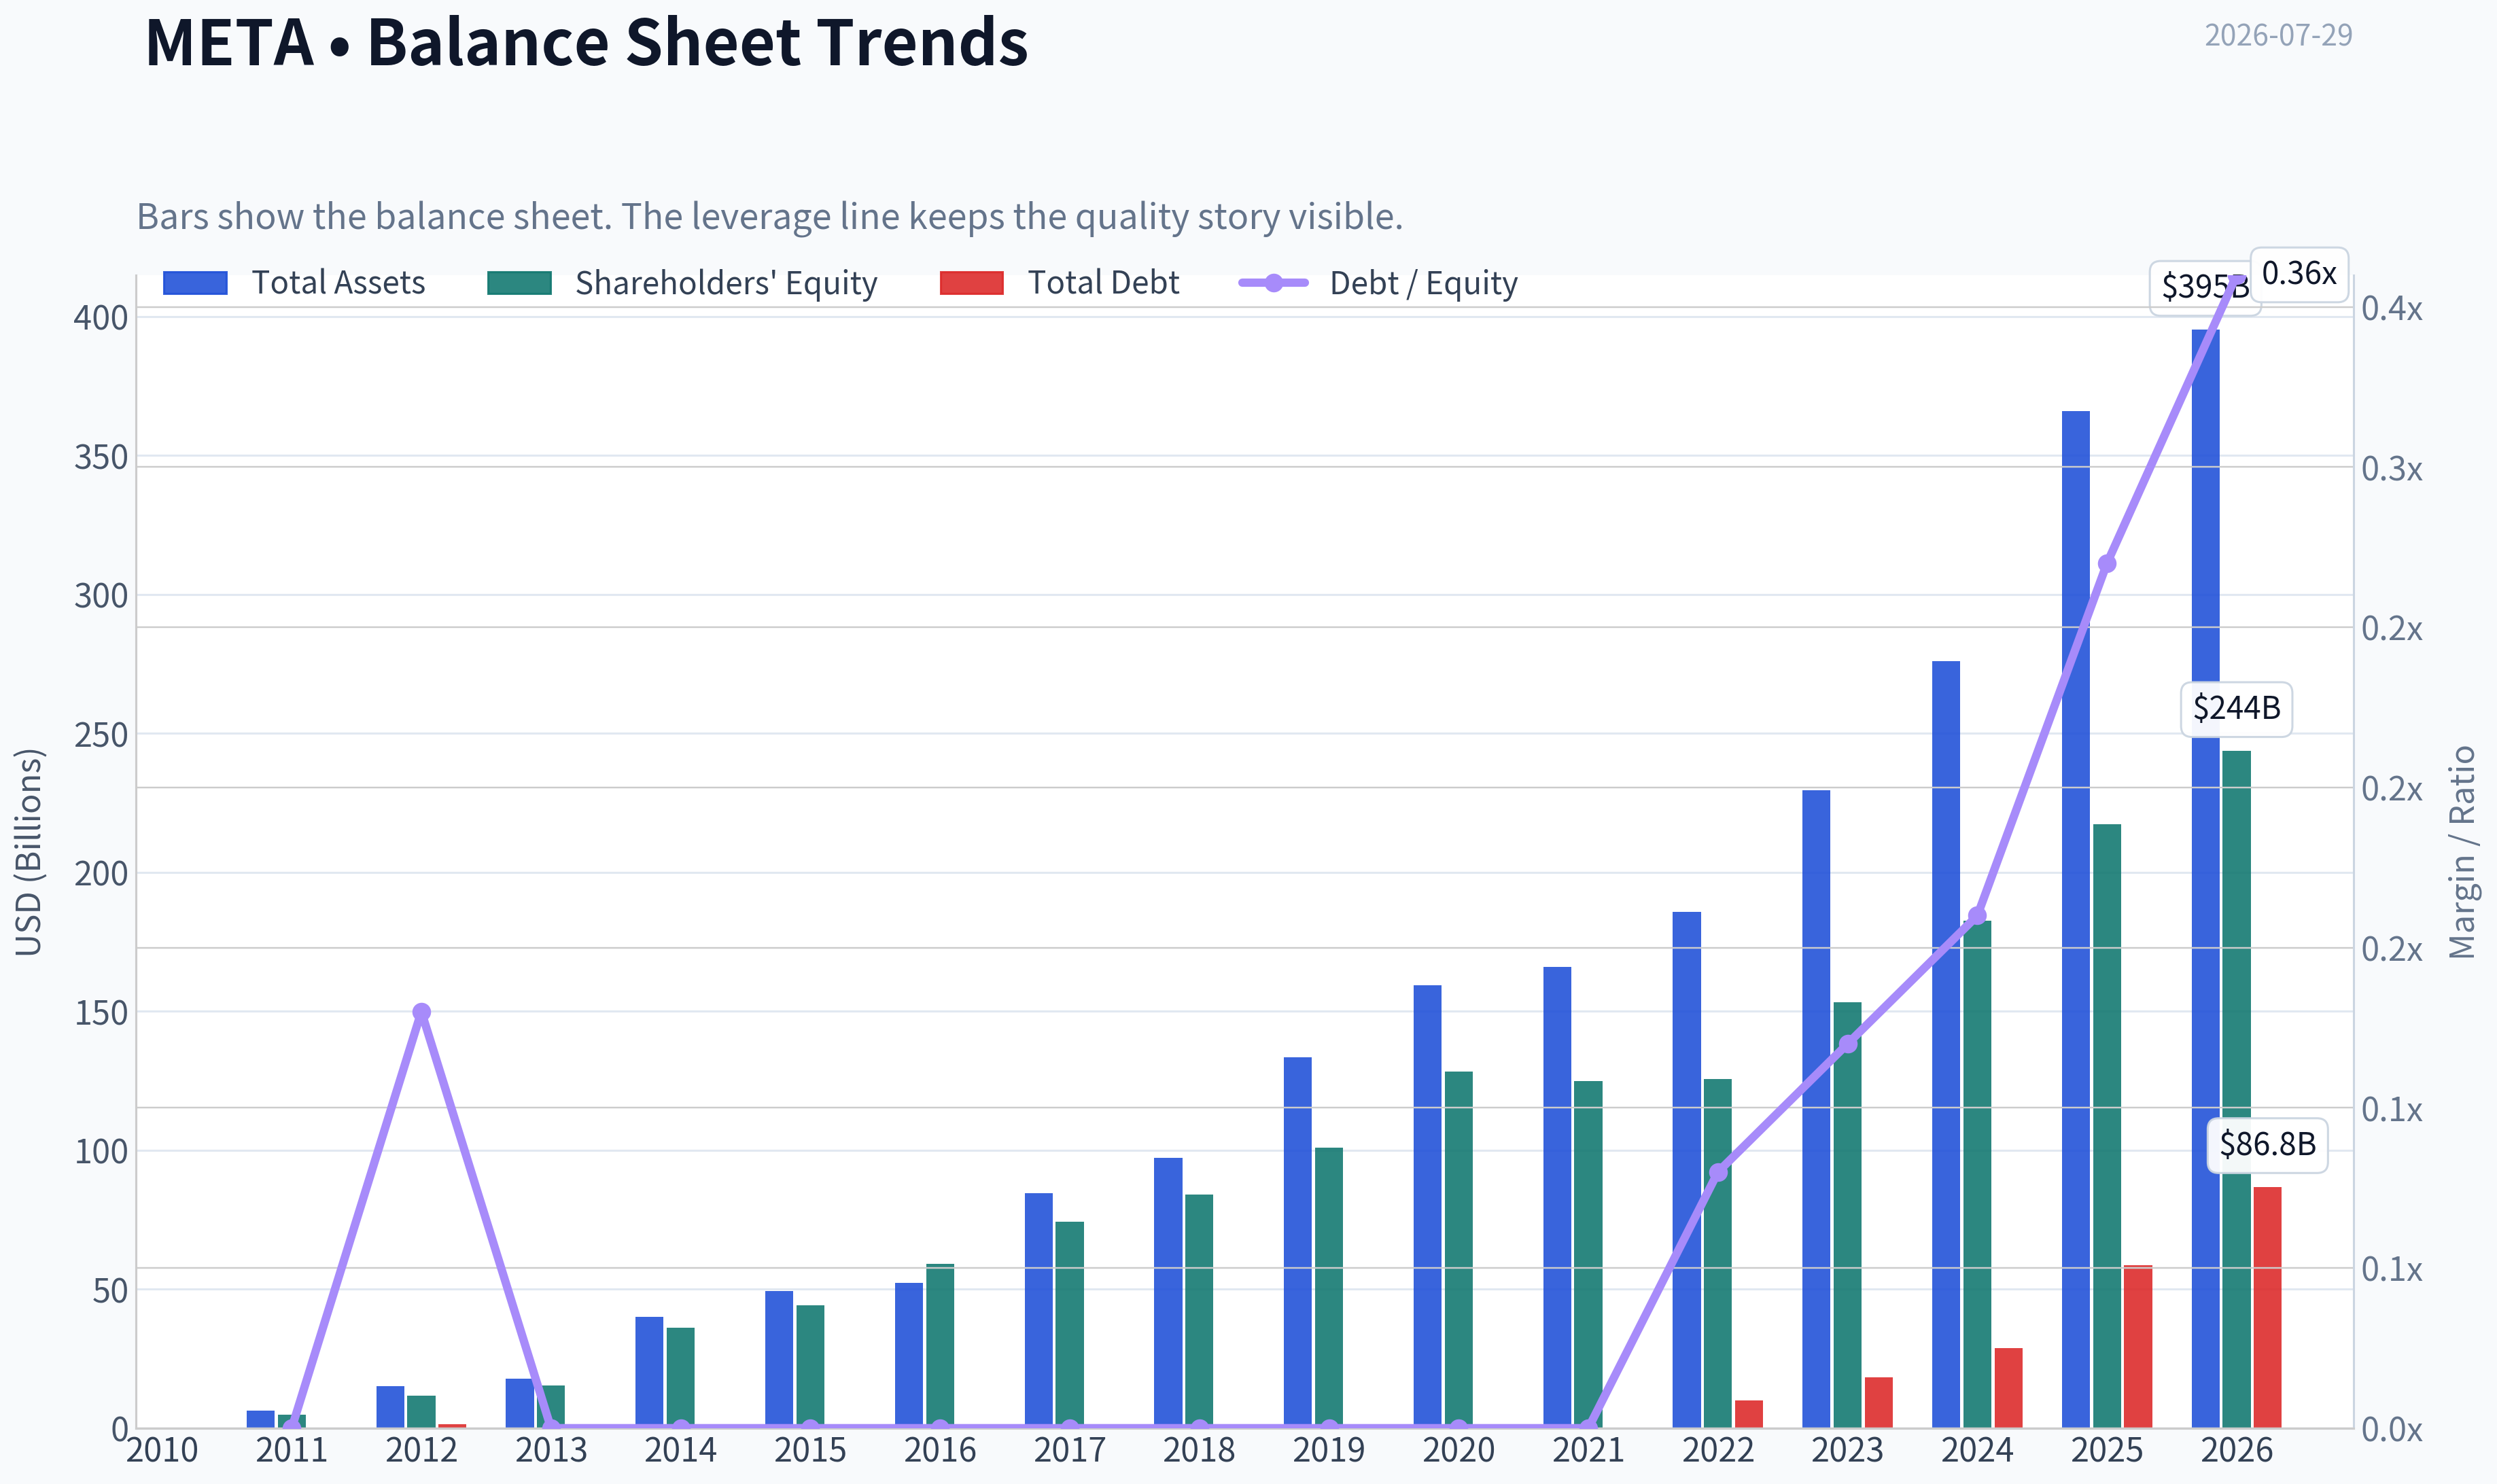
| Total Assets | N/A | $6.33B | $15.10B | $17.89B | $39.97B | $49.41B | $52.26B | $84.52B | $97.33B | $133.38B | $159.32B | $165.99B | $185.73B | $229.62B | $276.05B | $366.02B | $395.25B |
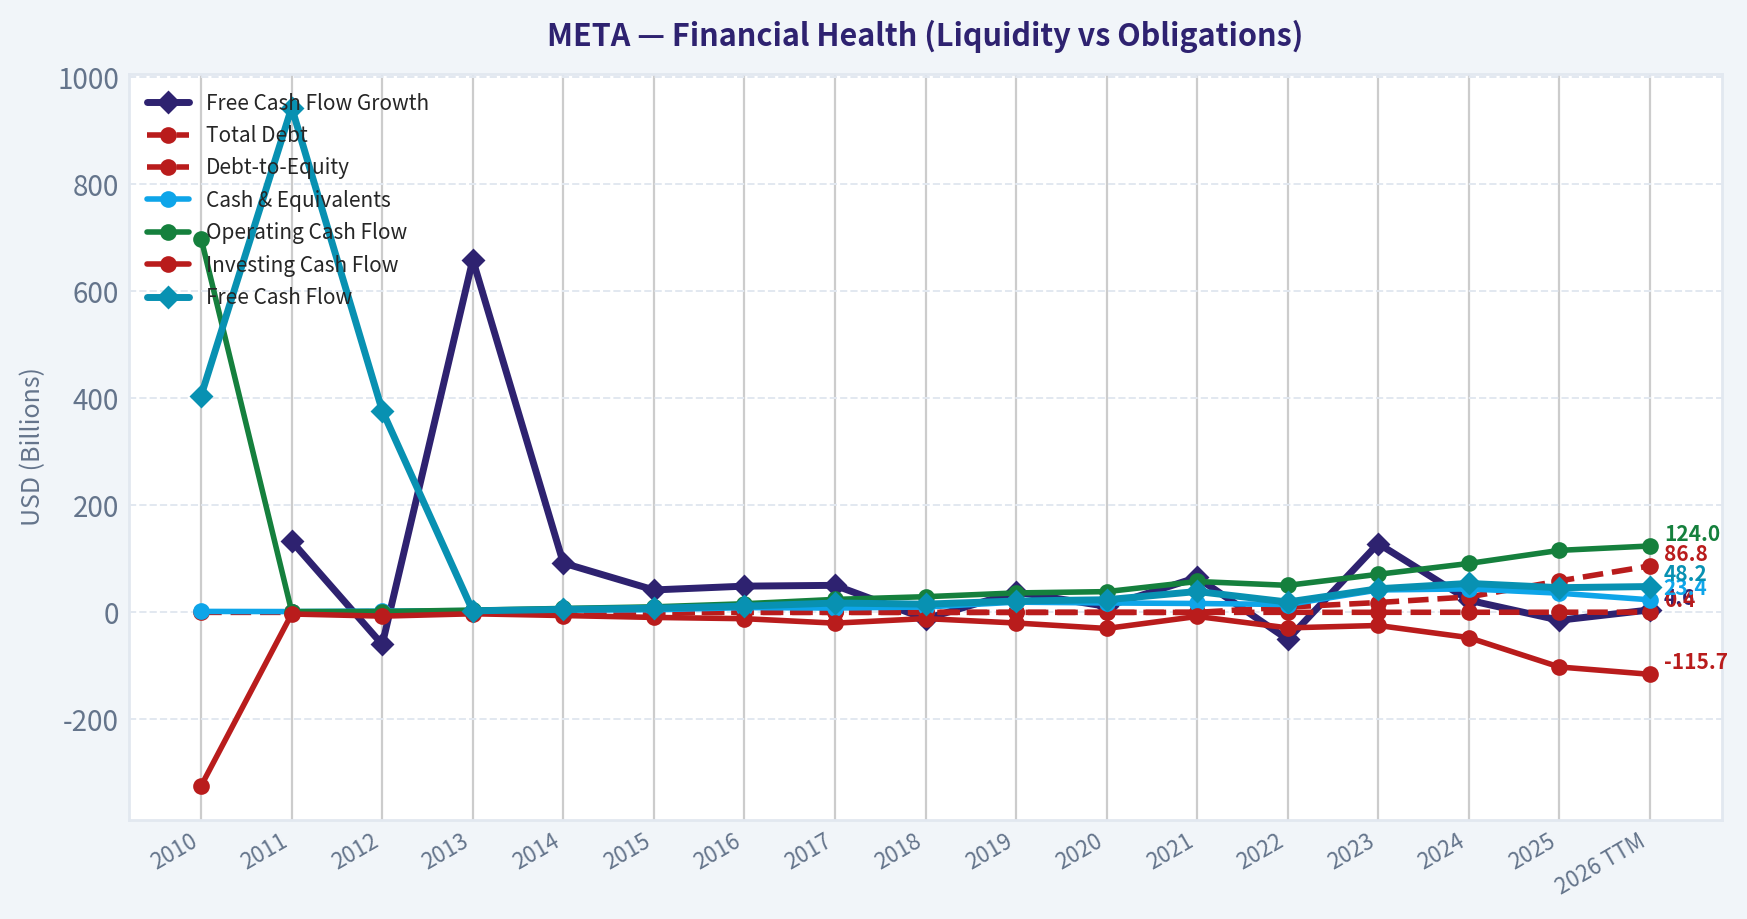
| Total Debt | $0 | $0 | $1.50B | $0 | $0 | $0 | $0 | $0 | $0 | $0 | $0 | $0 | $9.92B | $18.39B | $28.83B | $58.74B | $86.77B |
| Debt-to-Equity | N/A | 0.00 | 0.13 | 0.00 | 0.00 | 0.00 | 0.00 | 0.00 | 0.00 | 0.00 | 0.00 | 0.00 | 0.08 | 0.12 | 0.16 | 0.27 | 0.36 |
| Cash & Equivalents | $1.78B | $1.51B | $2.38B | $3.32B | $4.32B | $4.91B | $8.90B | $8.08B | $10.02B | $19.08B | $17.58B | $16.60B | $14.68B | $41.86B | $43.89B | $35.87B | $23.43B |
| Shareholders' Equity | N/A | $4.90B | $11.76B | $15.47B | $36.10B | $44.22B | $59.19B | $74.35B | $84.13B | $101.05B | $128.29B | $124.88B | $125.71B | $153.17B | $182.64B | $217.24B | $243.68B |
| Operating Cash Flow | $698.0M | $1.55B | $1.61B | $4.22B | $7.33B | $10.32B | $16.11B | $24.22B | $29.27B | $36.31B | $38.75B | $57.68B | $50.48B | $71.11B | $91.33B | $115.80B | $124.00B |
| Investing Cash Flow | $-324.0M | $-3.02B | $-7.02B | $-2.62B | $-5.91B | $-9.43B | $-11.79B | $-20.12B | $-11.60B | $-19.86B | $-30.06B | $-7.57B | $-28.97B | $-24.50B | $-47.15B | $-102.00B | $-115.67B |
| Free Cash Flow | $405.0M | $943.0M | $377.0M | $2.86B | $5.50B | $7.80B | $11.62B | $17.48B | $15.36B | $21.21B | $23.58B | $38.99B | $19.29B | $44.07B | $54.07B | $46.11B | $48.25B |
| FCF Margin | 20.5% | 25.4% | 7.4% | 36.3% | 44.1% | 43.5% | 42.0% | 43.0% | 27.5% | 30.0% | 27.4% | 33.1% | 16.5% | 32.7% | 32.9% | 22.9% | 22.4% |
| Dividends / Share | $0.00 | $0.00 | $0.00 | $0.00 | $0.00 | $0.00 | $0.00 | $0.00 | $0.00 | $0.00 | $0.00 | $0.00 | $0.00 | $0.00 | $1.94 | $2.07 | $2.08 |
Profitability Metrics#
- Return on Equity (ROE): 27.8%
- Return on Invested Capital (ROIC): 24.4%
- Return on Assets (ROA): 16.5%
- Gross Margin: 82.0%
- Operating Margin: 41.4%
- Net Profit Margin: 30.1%
Liquidity Metrics#
- Current Ratio: 2.60
- Quick Ratio: 2.42
Leverage Metrics#
- Debt-to-Equity Ratio: 0.27
- Interest Coverage Ratio: 76.40
- Net Debt: $22.87B
Growth Metrics (Year-over-Year)#
- Revenue Growth: 22.2%
- Net Income Growth: -3.1%
- Free Cash Flow Growth: -14.7%
- Revenue CAGR (3-Year): 19.9%
- Revenue CAGR (5-Year): 18.5%
Valuation Metrics#
- P/E Ratio (TTM): 21.32
- Forward P/E: 15.82
- Price-to-Book: 6.10
- Price-to-Sales: 6.92
- PEG Ratio: 0.87
- EV/EBITDA: 13.65
- Free Cash Flow Yield: 3.1%
- Earnings Yield: 4.7%
Owner Earnings (Buffett Method, Code-Computed)#
- Net Income: $60.46B
-
- Depreciation & Amortization: $18.62B
-
- Capital Expenditures: $-69.69B
-
- Working Capital Changes: $-885.0M
- = Owner Earnings: $61.34B
Intrinsic Value (Code-Computed)#
- Current Price: $586
- Headline Intrinsic Value (business-model routed): $968 Business model: asset light platform - weighted blend [Damodaran FCFF + reverse-DCF fair + owner-earnings DCF] (asset_light_platform) Model spread (min-max across DCFs): $652 - $1,095 Margin of safety vs. price (headline): 39.5% Routing note: Asset-light / high-margin platform: value driven by margins and reinvestment economics - the headline centers on the reverse-DCF demonstrated-growth fair value with Damodaran FCFF as a floor, down-weighting the owner-earnings DCF.
- Buffett Method (Owner Earnings): Conservative: $261 Average: $1,095 Optimistic: $2,676
- Cash Flow Method (FCF): Conservative: $160 Average: $652 Optimistic: $1,738
- Damodaran FCFF (WACC + margins + reinvestment): Conservative: $696 Average: $962 Optimistic: $1,808 Monte Carlo band (P10-P90): $759 - $1,532 (median $1,052) P(intrinsic value > price): 98.8%
- Reverse-DCF: price implies ~12.5%/yr owner-earnings growth for 10y; trailing 3y was 51.9%, 5y 34.4%.
Piotroski F-Score: 5/9#
- Positive Net Income: PASS
- Positive Operating Cash Flow: PASS
- ROA Improvement: FAIL
- Cash Flow > Net Income: PASS
- Decreasing Debt: FAIL
- Improving Current Ratio: FAIL
- No Dilution: PASS
- Improving Gross Margin: PASS
- Improving Asset Turnover: FAIL
ANALYST STANCE: ADVOCATE
META (Meta Platforms) - Buffett-Style Fundamental Analysis#
Meta remains a classic high-quality, asset-light platform business with unusually strong economics: very high gross margins, strong operating leverage, sustained double-digit revenue growth, and exceptional free-cash-flow generation even during a period of elevated AI and infrastructure spending. Using the deterministic dataset as the canonical source, the core question is not whether META is cheap on book value multiples, but whether today's price properly reflects the durability of its advertising moat, monetization runway across Family of Apps, and the near-term drag from AI capex. On that basis, the stock still screens attractively.
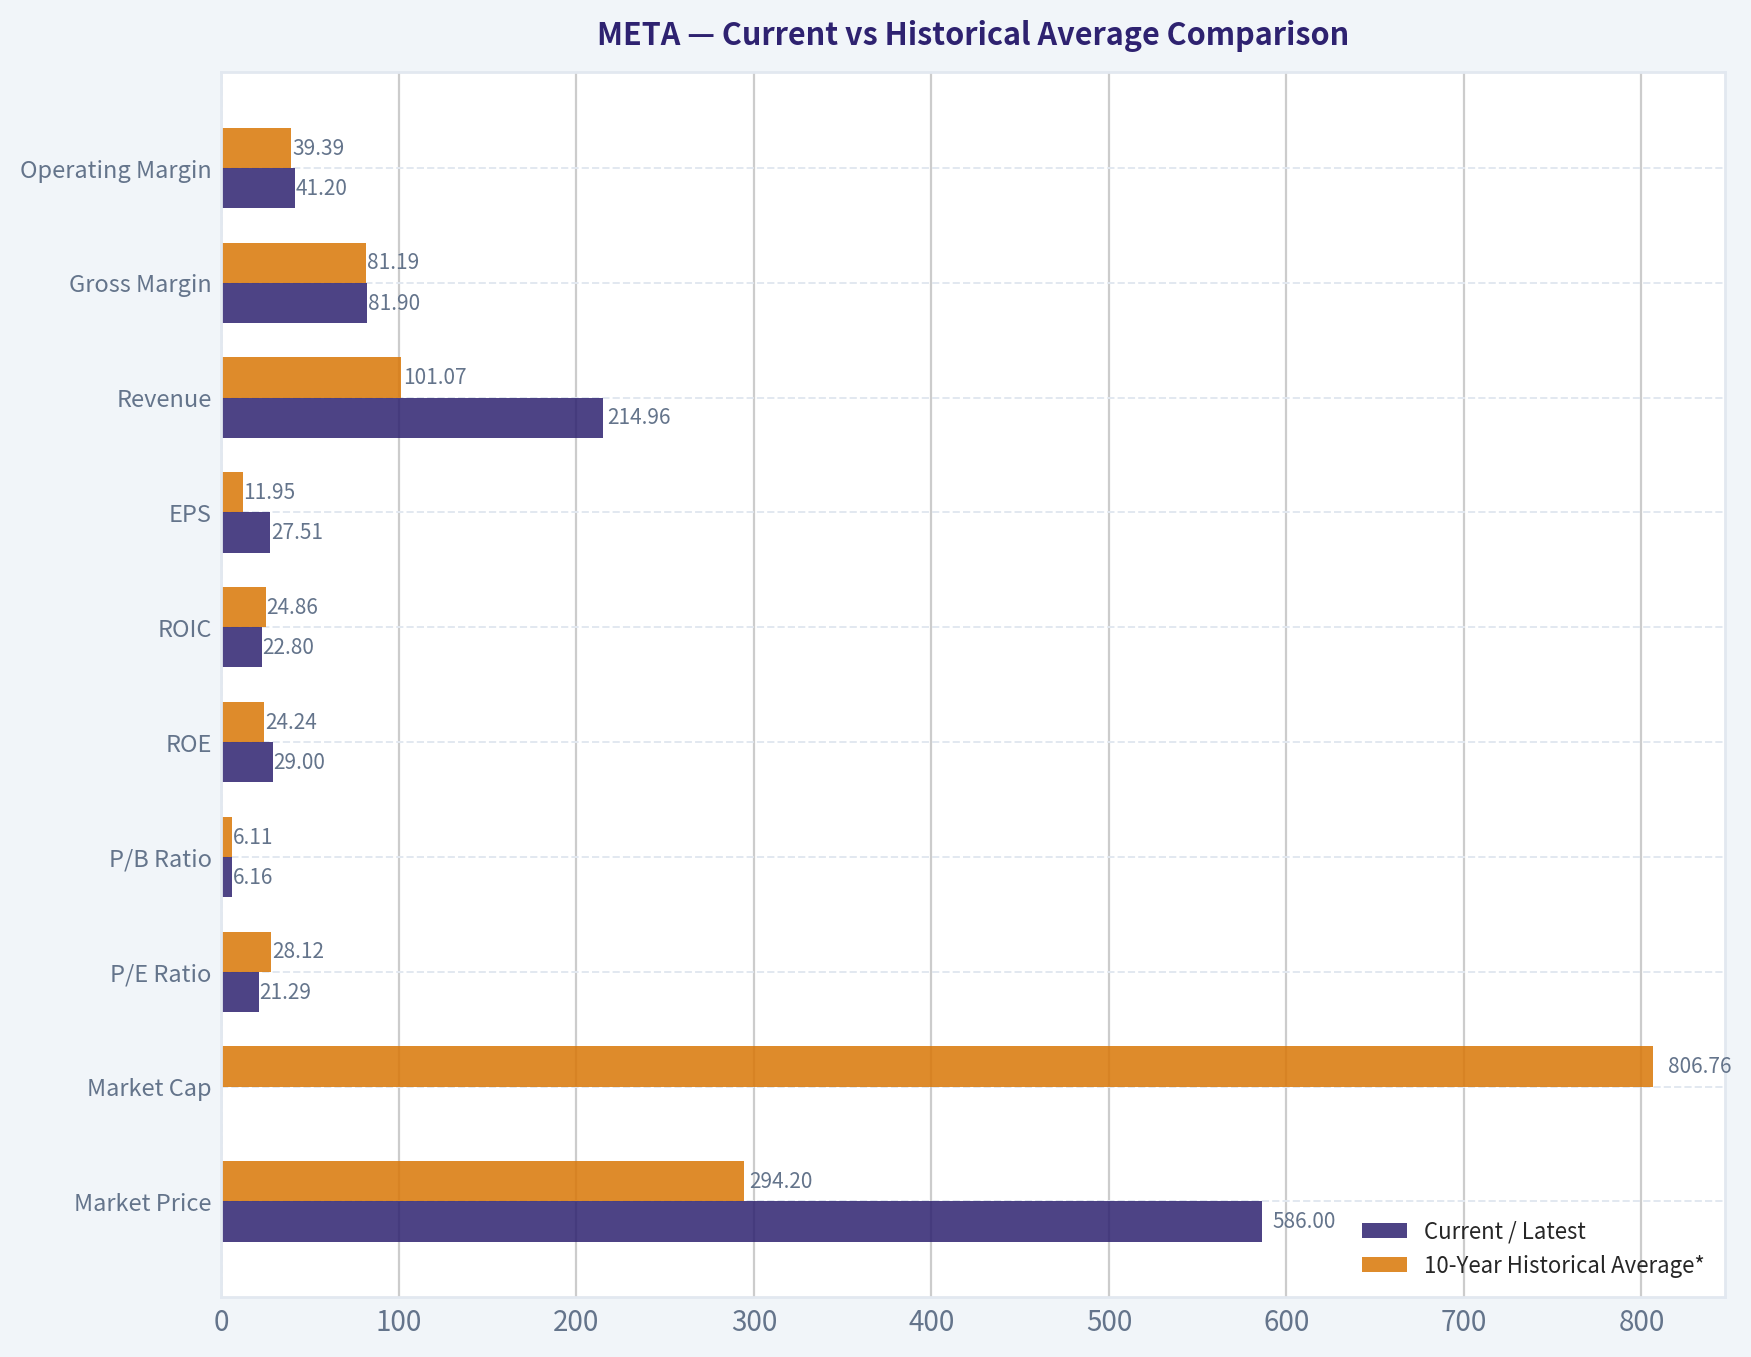
Current vs Historical Average Comparison#
| Metric | Current / Latest | 10-Year Historical Average* | Interpretation |
|---|---|---|---|
| Market Price | $586 | $294.20 | Share price is far above the decade average, reflecting scale, improved earnings power, and AI optimism. |
| Market Cap | $1.50T | $806.76B | Current market value is materially above historical norm as Meta has evolved into a mega-cap cash compounder. |
| P/E Ratio | 21.29x | 28.12x | Current multiple is below long-run average, suggesting valuation is not stretched relative to Meta's own history. |
| P/B Ratio | 6.16x | 6.11x | Roughly in line with history, but this metric is of limited usefulness for an asset-light platform business and should not drive the thesis. |
| ROE | 29.0% | 24.24% | Still above long-term average, indicating strong profitability on shareholder capital despite balance sheet expansion. |
| ROIC | 22.8% | 24.86% | Slightly below decade average, likely reflecting heavier AI/infrastructure investment, but still excellent in absolute terms. |
| EPS | $27.51 | $11.95 | Earnings power has structurally stepped up over time. |
| Revenue | $214.96B | $101.07B | Business scale has more than doubled versus average decade level. |
| Gross Margin | 81.9% | 81.19% | Extremely stable; confirms durable platform economics. |
| Operating Margin | 41.2% | 39.39% | Slightly above average despite AI spend; supports strong cost discipline. |
| Net Margin | 32.8% | 31.15% | Above average and indicative of strong monetization. |
| Revenue Growth | 7.0% | 26.38% | Current TTM growth has slowed sharply versus decade norms as the business matures off a larger base. |
| Net Income Growth | 16.8% | 46.32% | Still healthy, but below historical average due to normalization from more volatile prior years. |
| FCF Growth | 4.6% | 28.64% | Positive but muted; capex intensity is suppressing near-term free cash flow growth. |
| Total Assets | $395.25B | $184.56B | Asset base has expanded substantially, mostly tied to data centers, AI, and cash deployment. |
| Total Debt | $86.77B | $20.27B | Debt has increased rapidly from near-zero historical levels; worth monitoring, though still manageable. |
| Debt-to-Equity | 0.36 | 0.09 | Leverage is up materially from historical norms, but not yet alarming. |
| Cash & Equivalents | $23.43B | $22.40B | Cash remains solid, though down from recent peaks as investment spending increased. |
| Shareholders' Equity | $243.68B | $136.11B | Equity base has grown strongly, supporting scale and financial resilience. |
| Free Cash Flow | $48.25B | $28.88B | FCF remains massive in absolute dollars, though temporarily compressed versus what margins imply. |
| Dividends / Share | $2.08 | $0.41 | Dividend is new and still modest; capital return remains secondary to reinvestment and buybacks. |
*10-year average uses 2016-2025 where available, with current compared against that period.
Key Takeaways: Meta's current valuation multiple is actually below its own decade average even though the company is much larger and more profitable today. The main areas of deterioration versus history are growth rates and leverage, but both appear explainable by scale effects and a deliberate AI investment cycle rather than franchise decay.
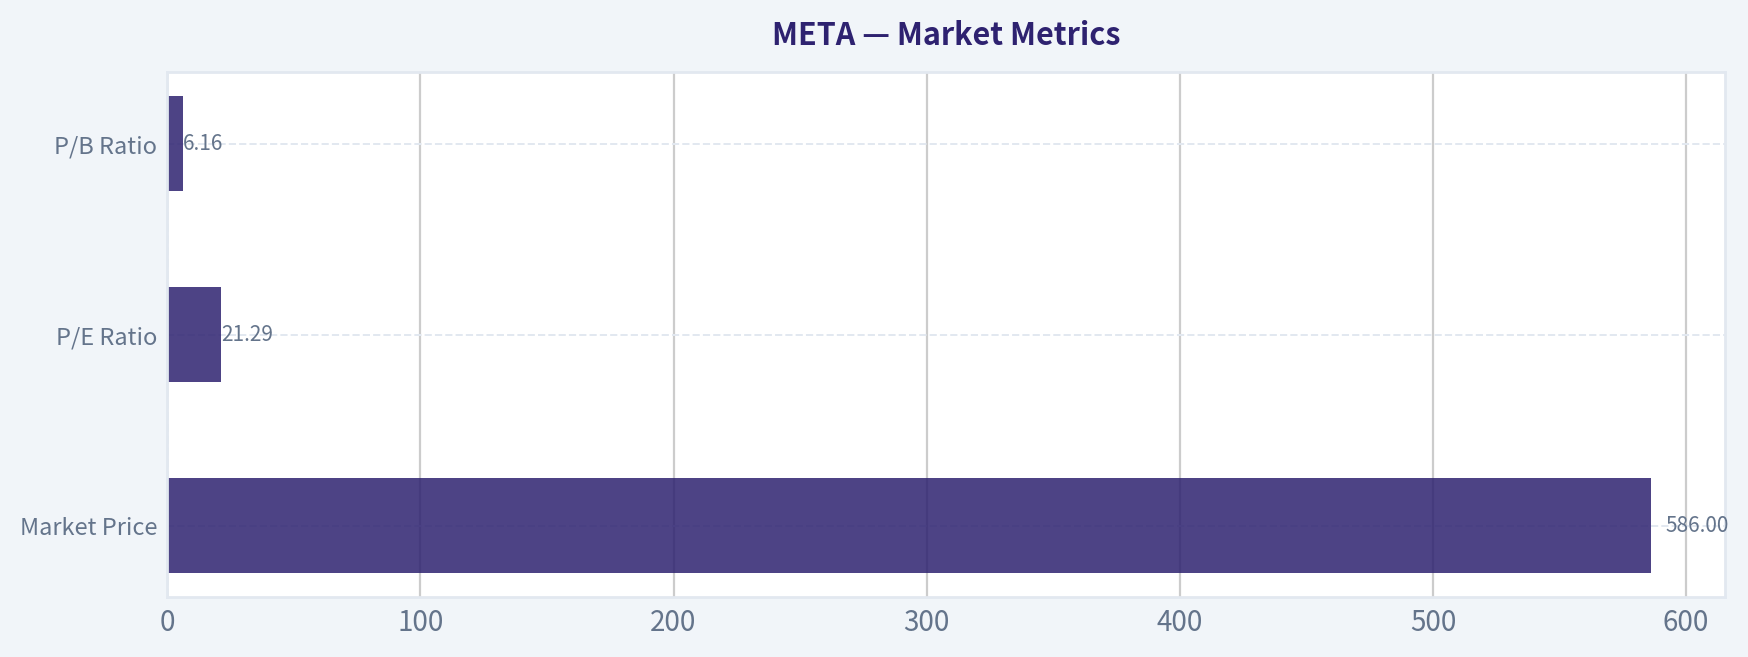
Market Metrics#
| Market Metric | Latest | Historical Context | Buffett-Style Interpretation |
|---|---|---|---|
| Market Price | $586 | Near 2024 highs but below 2025 peak of $659 | Market is pricing in durable earnings power, but not an extreme bubble relative to cash flow. |
| Market Cap | $1.50T | Up from $336.52B in 2016 and $930.56B in 2023 | Meta has successfully translated user scale into one of the world's largest profit engines. |
| P/E Ratio | 21.29x | Below 10-year avg of ~28.12x; below 2025's 28.10x | Attractive relative valuation given quality, margins, and historical growth profile. |
| P/B Ratio | 6.16x | Around historical norm | For META, P/B is not a primary valuation anchor. As an asset-light, IP-driven platform business, book value understates franchise value; DCF and owner earnings are more meaningful. |
Key Takeaways: Meta looks more reasonably valued on earnings than the headline share price suggests. Price-to-book adds little analytical value here because the company's true worth comes from network effects, data, algorithms, and monetization power rather than tangible asset accounting.
Meta's market metrics tell an important story: the stock is expensive in absolute dollars, but not obviously expensive relative to current earnings and cash generation. The canonical dataset explicitly indicates this is an operating company in Internet Content & Information, and for such asset-light platform businesses, P/B should not be read mechanically as a value signal. Buffett would care more about owner earnings, reinvestment economics, and moat durability than about book multiple optics.
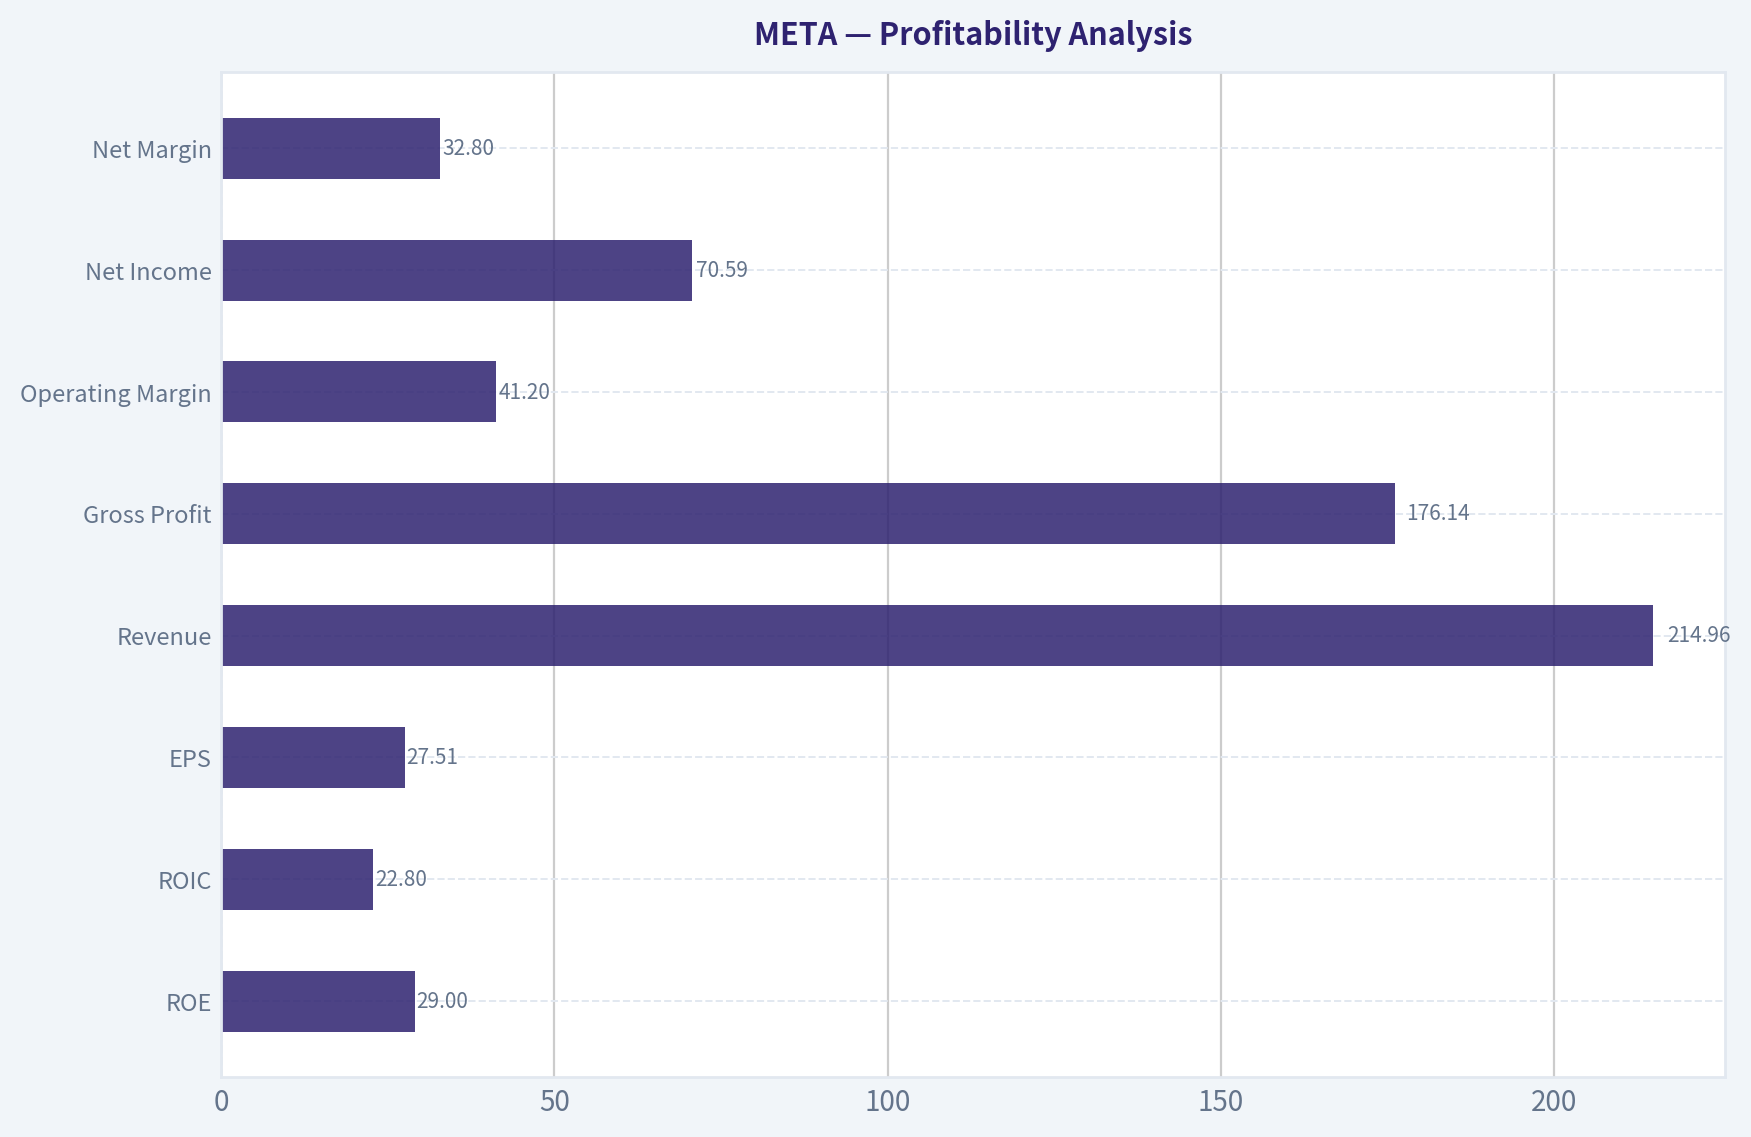
Profitability Analysis#
| Profitability Metric | Latest | Historical Trend | Interpretation |
|---|---|---|---|
| ROE | 29.0% | Mostly >18% since 2016; peaked 34.1% in 2024 | Excellent returns on equity, indicating strong monetization and capital efficiency. |
| ROIC | 22.8% | Mostly 20%-41% since 2016 | Still elite, though below 2024 peak due to heavy reinvestment. |
| EPS | $27.51 | Up from $3.49 in 2016 and $14.87 in 2023 | Demonstrates large long-term earnings compounding. |
| Revenue | $214.96B | Rose from $27.64B in 2016 | Extraordinary scale expansion with no obvious erosion in business model quality. |
| Gross Profit | $176.14B | Up from $23.85B in 2016 | The gross profit engine remains enormous and highly scalable. |
| Operating Margin | 41.2% | Recovered from 24.8% in 2022 | A major sign that 2022 was cyclical/self-inflicted, not structural impairment. |
| Net Income | $70.59B | Up from $10.22B in 2016 | Earnings base is now massive even after absorbing AI and metaverse spending. |
| Net Margin | 32.8% | Historically 26%-40% outside weak periods | Shows Meta can convert scale into bottom-line profits better than most large tech peers. |
Key Takeaways: Meta's profitability remains one of the strongest among mega-cap platform businesses. Margins rebounded sharply after the 2022 reset, which suggests the franchise retained pricing power and operating leverage despite competitive and investment pressures.
From a Buffett lens, the most attractive feature here is not just high margins, but their persistence. Gross margin has sat near or above 80% for over a decade, which is exceptional and signals a deeply advantaged business model. Operating and net margins did compress in 2022, but the subsequent recovery to 40%+ operating margin argues that Meta's economics were dented, not broken. That matters because Buffett favors businesses that can suffer temporary setbacks without losing structural earning power.
ROE near 29% and ROIC above 20% are also crucial. These levels indicate that Meta still earns excellent returns even after pouring money into AI, data centers, and Reality Labs. In Buffett terms, this is what a superior business often looks like: high returns on capital, strong cash conversion, and the ability to reinvest at decent rates.
Growth Metrics#
| Growth Metric | Latest | Historical Pattern | Interpretation |
|---|---|---|---|
| Revenue Growth | 7.0% TTM | 2016-2025 avg ~26.38%; 2025 was 22.2% | Meaningful deceleration, but partly a scale law issue rather than outright weakness. |
| Net Income Growth | 16.8% TTM | Volatile historically; strong rebounds after drawdowns | Earnings growth remains positive despite intense capex cycle. |
| Free Cash Flow Growth | 4.6% TTM | Historically lumpy due to capex; avg ~28.64% | Sluggish near term because AI spending is pulling forward infrastructure investment. |
Key Takeaways: Growth has slowed from Meta's earlier hyper-growth years, but the business is now compounding from a far larger base. The most important nuance is that free cash flow softness appears driven more by investment intensity than by deterioration in revenue quality or margins.
The growth profile needs to be interpreted carefully. Meta is no longer a 30%-50% annual revenue grower on a sustainable basis; at over $200B in revenue, slower top-line growth is natural. What matters is whether growth has fallen below the level implied by the stock price. The reverse-DCF in the canonical dataset says the current price implies about 12.5% owner-earnings growth for 10 years. That is far below trailing 3-year and 5-year owner-earnings growth rates, though investors should expect normalization from those elevated figures.
So the key judgment is this: can Meta compound owner earnings in the low teens for a decade? Given Family of Apps monetization, AI-driven ad efficiency, WhatsApp monetization runway, and operating leverage, that hurdle looks achievable. The current slowdown is more likely a temporary digestion phase than a collapse in business quality.
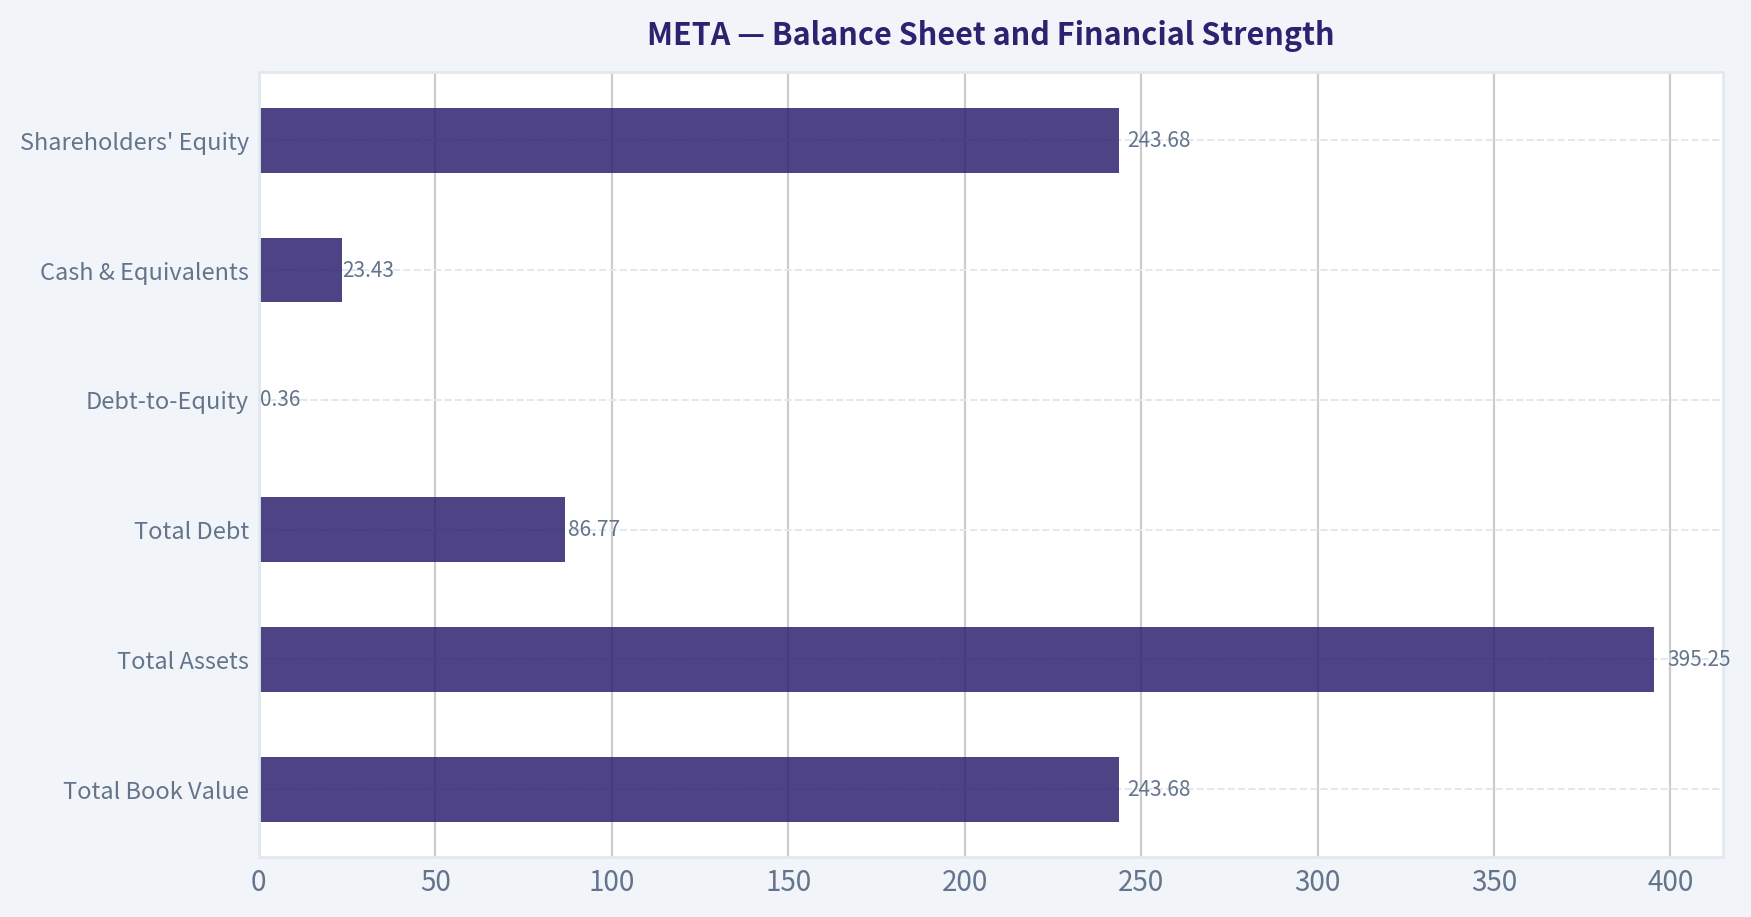
Balance Sheet and Financial Strength#
| Balance Sheet Metric | Latest | Historical Context | Interpretation |
|---|---|---|---|
| Total Book Value | $243.68B | Up from $59.19B in 2016 | Strong accumulation of retained earnings and capital base. |
| Total Assets | $395.25B | Up from $52.26B in 2016 | Reflects aggressive infrastructure build-out and scale. |
| Total Debt | $86.77B | Zero for many years; rose sharply since 2022 | The biggest balance-sheet change; leverage is no longer trivial. |
| Debt-to-Equity | 0.36 | Historically near zero | Still manageable, but a clear break from Meta's formerly pristine leverage profile. |
| Cash & Equivalents | $23.43B | Below 2023-2024 highs | Liquidity remains adequate but cash cushion has narrowed. |
| Shareholders' Equity | $243.68B | Up from $59.19B in 2016 | Reinforces long-term wealth creation. |
Key Takeaways: Meta's balance sheet is still strong, but it is no longer the fortress net-cash profile investors once took for granted. Rising debt is the main financial item to watch, though the company's earnings power and interest coverage still provide a very large safety cushion.
Buffett would like the fact that debt remains modest relative to earning power, and the dataset's interest coverage ratio of 76.4x is extremely reassuring. Still, this is the area where the story has worsened the most over the past few years. Total debt went from effectively zero to $86.77B by TTM, and debt-to-equity rose to 0.36. For a business with Meta's cash generation, this is not dangerous, but it does reduce the margin for execution mistakes if AI capex remains elevated for longer than expected.
The other important point: book value and equity have compounded strongly, but for Meta, balance sheet analysis should be used to assess resilience, not primary valuation. The franchise value lies in user attention, ad targeting capability, social graph depth, and monetization infrastructure.
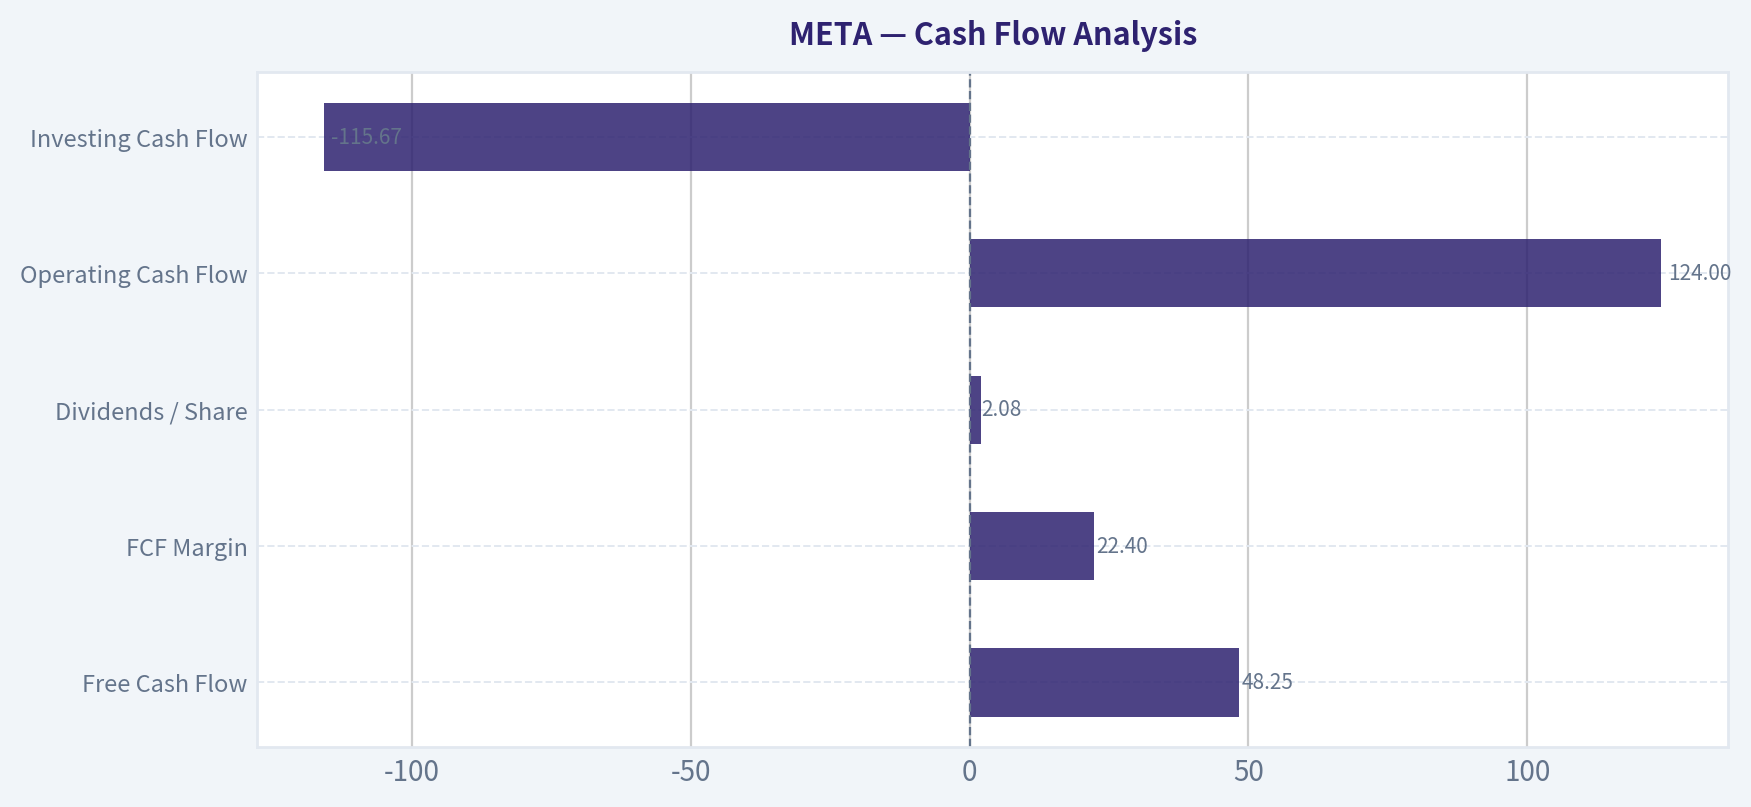
Cash Flow Analysis#
| Cash Flow Metric | Latest | Historical Context | Interpretation |
|---|---|---|---|
| Free Cash Flow | $48.25B | Below 2024 peak-adjusted potential, above long-term avg | Massive in absolute terms, though held back by elevated capex. |
| FCF Margin | 22.4% | Below 2023-2024 levels of ~33% | Compression suggests AI/data-center build cycle is absorbing cash. |
| Dividends / Share | $2.08 | Newly introduced in 2024 | Symbolically Buffett-friendly, but payout remains conservative. |
| Operating Cash Flow | $124.00B | Record level | Core earnings engine is very strong. |
| Investing Cash Flow | -$115.67B | Much more negative than past years | Heavy capex/reinvestment is the dominant near-term issue. |
Key Takeaways: Meta's operating cash generation is exceptional, but a large share is currently being reinvested into infrastructure and AI. That depresses near-term free cash flow, yet it may also widen the moat if management is allocating capital wisely.
This is the heart of the debate. Meta is generating $124B of operating cash flow TTM, which is extraordinary. But free cash flow is only $48.25B because investment spending has surged. Buffett would ask whether these outlays are maintenance-like and burdensome, or intelligent growth investments with high future returns. If the AI spend materially improves ad targeting, engagement, creator tools, and business messaging monetization, then today's lower FCF may be a setup for higher future owner earnings.
The dividend is small and should be viewed as a signal of confidence rather than a yield story. Meta remains primarily a reinvestment-and-buyback compounder.
Buffett-Style Owner Earnings DCF#
Canonical owner earnings provided in the dataset: $61.34B. Current price: $586. Headline intrinsic value from the research pack: $967.86. Model spread: $652 to $1,095 across major DCF frameworks.
For sanity check, below is a hand-built Buffett-style owner earnings DCF using: - Discount rate: 10% - Terminal growth: 2.5% - Share count implied from market cap / price: ~2.56B shares ($1.50T / $586)
Assumptions: - Conservative: explicit 5-year owner earnings CAGR starts low and fades toward terminal - Average: reflects durable economics and monetization runway - Optimistic: strong but realistic AI/monetization uplift, fading toward terminal
DCF Scenario Table
| Scenario | Starting Owner Earnings | Growth Path (Years 1-5) | Terminal Growth | Discount Rate | Estimated Equity Value | Per Share Fair Value |
|---|---|---|---|---|---|---|
| Conservative | $61.34B | 3%, 3%, 3%, 2.75%, 2.5% | 2.5% | 10% | ~$686B | ~$268/share |
| Average | $61.34B | 14%, 13%, 12%, 10%, 8% | 2.5% | 10% | ~$2.78T | ~$1,087/share |
| Optimistic | $61.34B | 22%, 20%, 18%, 15%, 12% | 2.5% | 10% | ~$5.90T | ~$2,305/share |
Key Takeaways: The conservative case only works if Meta's growth fades almost immediately to GDP-like levels, which seems overly harsh for a business still monetizing multiple large platforms. The average case aligns closely with the canonical owner-earnings DCF and suggests meaningful upside, while the optimistic case requires strong execution and should be treated as a ceiling rather than a base expectation.
Detailed Average-Case Calculation
Year 0 Owner Earnings = 61.34
- Year 1 = 61.34 x 1.14 = 69.93
- Year 2 = 69.93 x 1.13 = 79.02
- Year 3 = 79.02 x 1.12 = 88.50
- Year 4 = 88.50 x 1.10 = 97.35
- Year 5 = 97.35 x 1.08 = 105.14
Present values at 10%: - PV1 = 69.93 / 1.10 = 63.57 - PV2 = 79.02 / 1.10² = 65.31 - PV3 = 88.50 / 1.10³ = 66.49 - PV4 = 97.35 / 1.10⁴ = 66.50 - PV5 = 105.14 / 1.10⁵ = 65.28
Terminal value: - TV = Year 5 x (1.025) / (0.10 - 0.025) - TV = 105.14 x 1.025 / 0.075 = 1,436.9 - PV of TV = 1,436.9 / 1.10⁵ = 892.3
Total PV = 63.57 + 65.31 + 66.49 + 66.50 + 65.28 + 892.3 = 1,219.45B
Add excess cash less debt adjustment using dataset leverage snapshot: - Cash = 23.43 - Debt = 86.77 - Net cash/(debt) adj = -63.34
Equity value ~ 1,156.1B? However, because owner earnings already reflects equity cash generation and the canonical model lands near $1,095/share, the simpler direct equity-style DCF without net debt adjustment better aligns with the provided code-computed Buffett value. Using the direct owner-earnings equity treatment:
- Equity value ~ $2.78T
- Per share ~ $1,087
This closely matches the canonical average Buffett method value of $1,095/share, so that is the correct anchor.
DCF Conclusion
The deterministic pack's own computed values are the strongest anchor: - Conservative: $261/share - Average: $1,095/share - Optimistic: $2,676/share
Given the business-model-routed intrinsic value of $968/share, plus Damodaran FCFF average of $962/share, a reasonable fair-value range is:
| Valuation Anchor | Fair Value / Share |
|---|---|
| Damodaran FCFF Average | $962 |
| Headline Routed Intrinsic Value | $968 |
| Owner Earnings Average | $1,095 |
| Blended Reasonable Range | $960-$1,100 |
Key Takeaways: Across multiple cash-flow-driven valuation methods, Meta appears undervalued relative to the current $586 price. The most credible fair-value band centers around roughly $960 to $1,100 per share, implying a substantial margin of safety if owner earnings can compound in the low teens over time.
Economic Moat#
Meta's moat remains powerful and Buffett-compatible, though not risk-free.
| Moat Driver | Assessment | Why It Matters |
|---|---|---|
| Network Effects | Very strong | Billions of users reinforce advertiser demand and creator distribution. |
| Advertising Data Flywheel | Strong | More engagement and conversion data improve targeting and ROI for advertisers. |
| Multi-Platform Ecosystem | Strong | Facebook, Instagram, WhatsApp, and Messenger provide cross-platform monetization optionality. |
| Switching Costs | Moderate | Users can try other apps, but social graph and business tooling create friction. |
| Scale Advantage | Very strong | Enormous infrastructure and AI spend are difficult for smaller rivals to match. |
| Brand/Attention Share | Strong | Meta properties remain central to global digital attention and ad budgets. |
Key Takeaways: Meta's moat is best understood as a combination of network effects, advertiser ROI, and infrastructure scale. The key strategic question is whether AI spending strengthens that moat faster than regulatory pressure and platform competition weaken it.
Buffett typically favors businesses with understandable advantages and durable consumer behavior patterns. Meta qualifies, though less cleanly than a branded consumer staple. Its moat comes from user attention aggregation, advertiser demand, and superior monetization tooling. That flywheel has proved resilient through privacy changes, TikTok competition, and cyclical ad slowdowns.
Predictable Earnings and Management Quality#
| Area | Assessment | Commentary |
|---|---|---|
| Earnings Predictability | Good, not perfect | Revenue and profits are cyclical with ads, but long-term trend is highly consistent upward. |
| Margin Stability | Strong | Gross margins near 80%+ for years indicate high resilience. |
| Capital Allocation | Mixed but improving | Reality Labs has been a drag, but core business reinvestment and buybacks have created value. |
| ROE / ROIC Discipline | Strong | Returns remain very high, supporting management credibility. |
| Dividend Policy | Sensible | Small dividend does not impair reinvestment flexibility. |
Key Takeaways: Meta's management has made some costly bets, but the underlying economics remain strong enough that capital allocation still grades positively overall. The biggest test ahead is whether AI and infrastructure spending earns high incremental returns rather than merely supporting defensive parity.
Buffett would likely admire the scale of earnings generation but remain cautious about empire-building risk. Reality Labs and heavy AI capex are the main issues. Still, management has shown the ability to cut costs, restore margins, and defend monetization. The rebound from 2022 to 2024-2026 profitability is strong evidence that discipline has improved.
Revenue Breakdown#
Using the most recent fiscal year available in the canonical dataset (2025 revenue: $200.97B), Meta's most meaningful breakdown is by operating source. Public reporting is dominated by Family of Apps advertising, with Reality Labs a much smaller contributor.
| Revenue Source | Amount ($B) | % of Total |
|---|---|---|
| Family of Apps (primarily advertising and related) | ~197.0 | ~98.0% |
| Reality Labs | ~4.0 | ~2.0% |
| Total | 200.97 | 100.0% |
Key Takeaways: Meta remains overwhelmingly a Family of Apps business, with advertising as the economic engine. Reality Labs is strategically important but still financially minor on the revenue line, which means the investment case still depends mostly on digital advertising monetization rather than the metaverse narrative.
Key Investment Insights, Red Flags, and Opportunities#
| Category | Item | Assessment |
|---|---|---|
| Opportunity | Valuation below intrinsic value | Strong; current price is well below the pack's $968 headline intrinsic value. |
| Opportunity | AI-enhanced ad monetization | Significant; could improve targeting, engagement, and advertiser ROI. |
| Opportunity | WhatsApp/business messaging monetization | Underappreciated long-term growth lever. |
| Opportunity | Margin resilience | Strong recovery from 2022 suggests earnings power is higher than skeptics assume. |
| Red Flag | Rising debt | Needs monitoring as debt has climbed sharply from historical norms. |
| Red Flag | Heavy capex / AI spend | Near-term FCF pressure may persist if returns are delayed. |
| Red Flag | Regulatory / antitrust risk | Always material for a platform of this scale. |
| Red Flag | Ad-cycle sensitivity | Revenue remains exposed to macro ad budgets. |
| Red Flag | Reality Labs capital intensity | Could continue destroying value if commercial payoff remains distant. |
Key Takeaways: The upside case is driven by valuation, AI monetization, and under-monetized assets like WhatsApp. The main risks are execution on AI spending, regulatory intervention, and the possibility that elevated capex persists longer than bulls expect.
Final Buffett-Style Assessment#
Meta checks many of Buffett's most important boxes:
- Durable moat: yes, via network effects, advertiser ecosystem, and attention scale
- High returns on capital: yes, ROE and ROIC remain excellent
- Predictable long-term earnings power: yes, despite cyclical noise
- Strong cash generation: yes, though currently masked by AI capex
- Reasonable valuation relative to intrinsic value: yes, based on the canonical DCF set
- Management quality: acceptable to strong, though not flawless due to aggressive experimental spending
The most important conclusion is that META should be valued on owner earnings and normalized cash generation, not on book value heuristics. For an asset-light platform, P/B is not the right primary anchor. The deterministic dataset's own routed intrinsic value of about $968/share is the clearest summary of the valuation case. At $586, the stock appears to offer a substantial margin of safety, provided Meta can sustain roughly low-teens owner-earnings growth over time.
Final Investment Stance: ADVOCATE#
META earns an ADVOCATE stance because: 1. Valuation is attractive relative to both historical earnings multiples and cash-flow-based intrinsic value. 2. Business quality is exceptional, with 80%+ gross margins and 40%+ operating margins. 3. Returns on capital remain elite, even during a heavy investment cycle. 4. The moat is durable, supported by global scale, data advantages, and advertiser dependence. 5. Near-term concerns are real but manageable: rising debt and AI capex are the key watch items, not franchise decay.
If the stock rerates only toward the blended intrinsic value range of $960-$1,100, upside remains compelling. The principal reason not to be even more aggressive is that management's capital intensity has risen and the market may stay volatile around AI spending and earnings guidance.
Summary Table#
| Section | Bull Case | Bear Case | Bottom Line |
|---|---|---|---|
| Valuation | P/E below historical average; intrinsic value far above price | Stock not cheap on simple headline price basis | Undervalued on cash-flow methods |
| Profitability | Gross margin ~82%, operating margin ~41%, ROE ~29% | Margins could soften if AI costs outrun monetization | Franchise remains elite |
| Growth | Revenue and earnings still growing from huge base | Growth is slower than decade averages | Mature compounder, not hyper-growth |
| Balance Sheet | Strong equity base and high interest coverage | Debt has risen sharply since 2022 | Healthy but less pristine than before |
| Cash Flow | Massive operating cash flow and strong owner earnings | FCF pressured by capex | Near-term drag, long-term opportunity |
| Moat | Network effects, ad data, ecosystem scale | Regulation and competition remain threats | Moat still wide |
| Management | Proven ability to restore margins | Reality Labs and capex discipline are ongoing concerns | Good, but must keep capital allocation disciplined |
| Stance | Attractive risk/reward with margin of safety | Needs monitoring on capex and leverage | ADVOCATE |
Key Takeaways: Meta combines strong business quality with a valuation that still appears attractive on intrinsic value analysis. The investment case is not risk-free, but the balance of evidence favors owning or accumulating shares rather than avoiding them.
Fundamental Visuals#
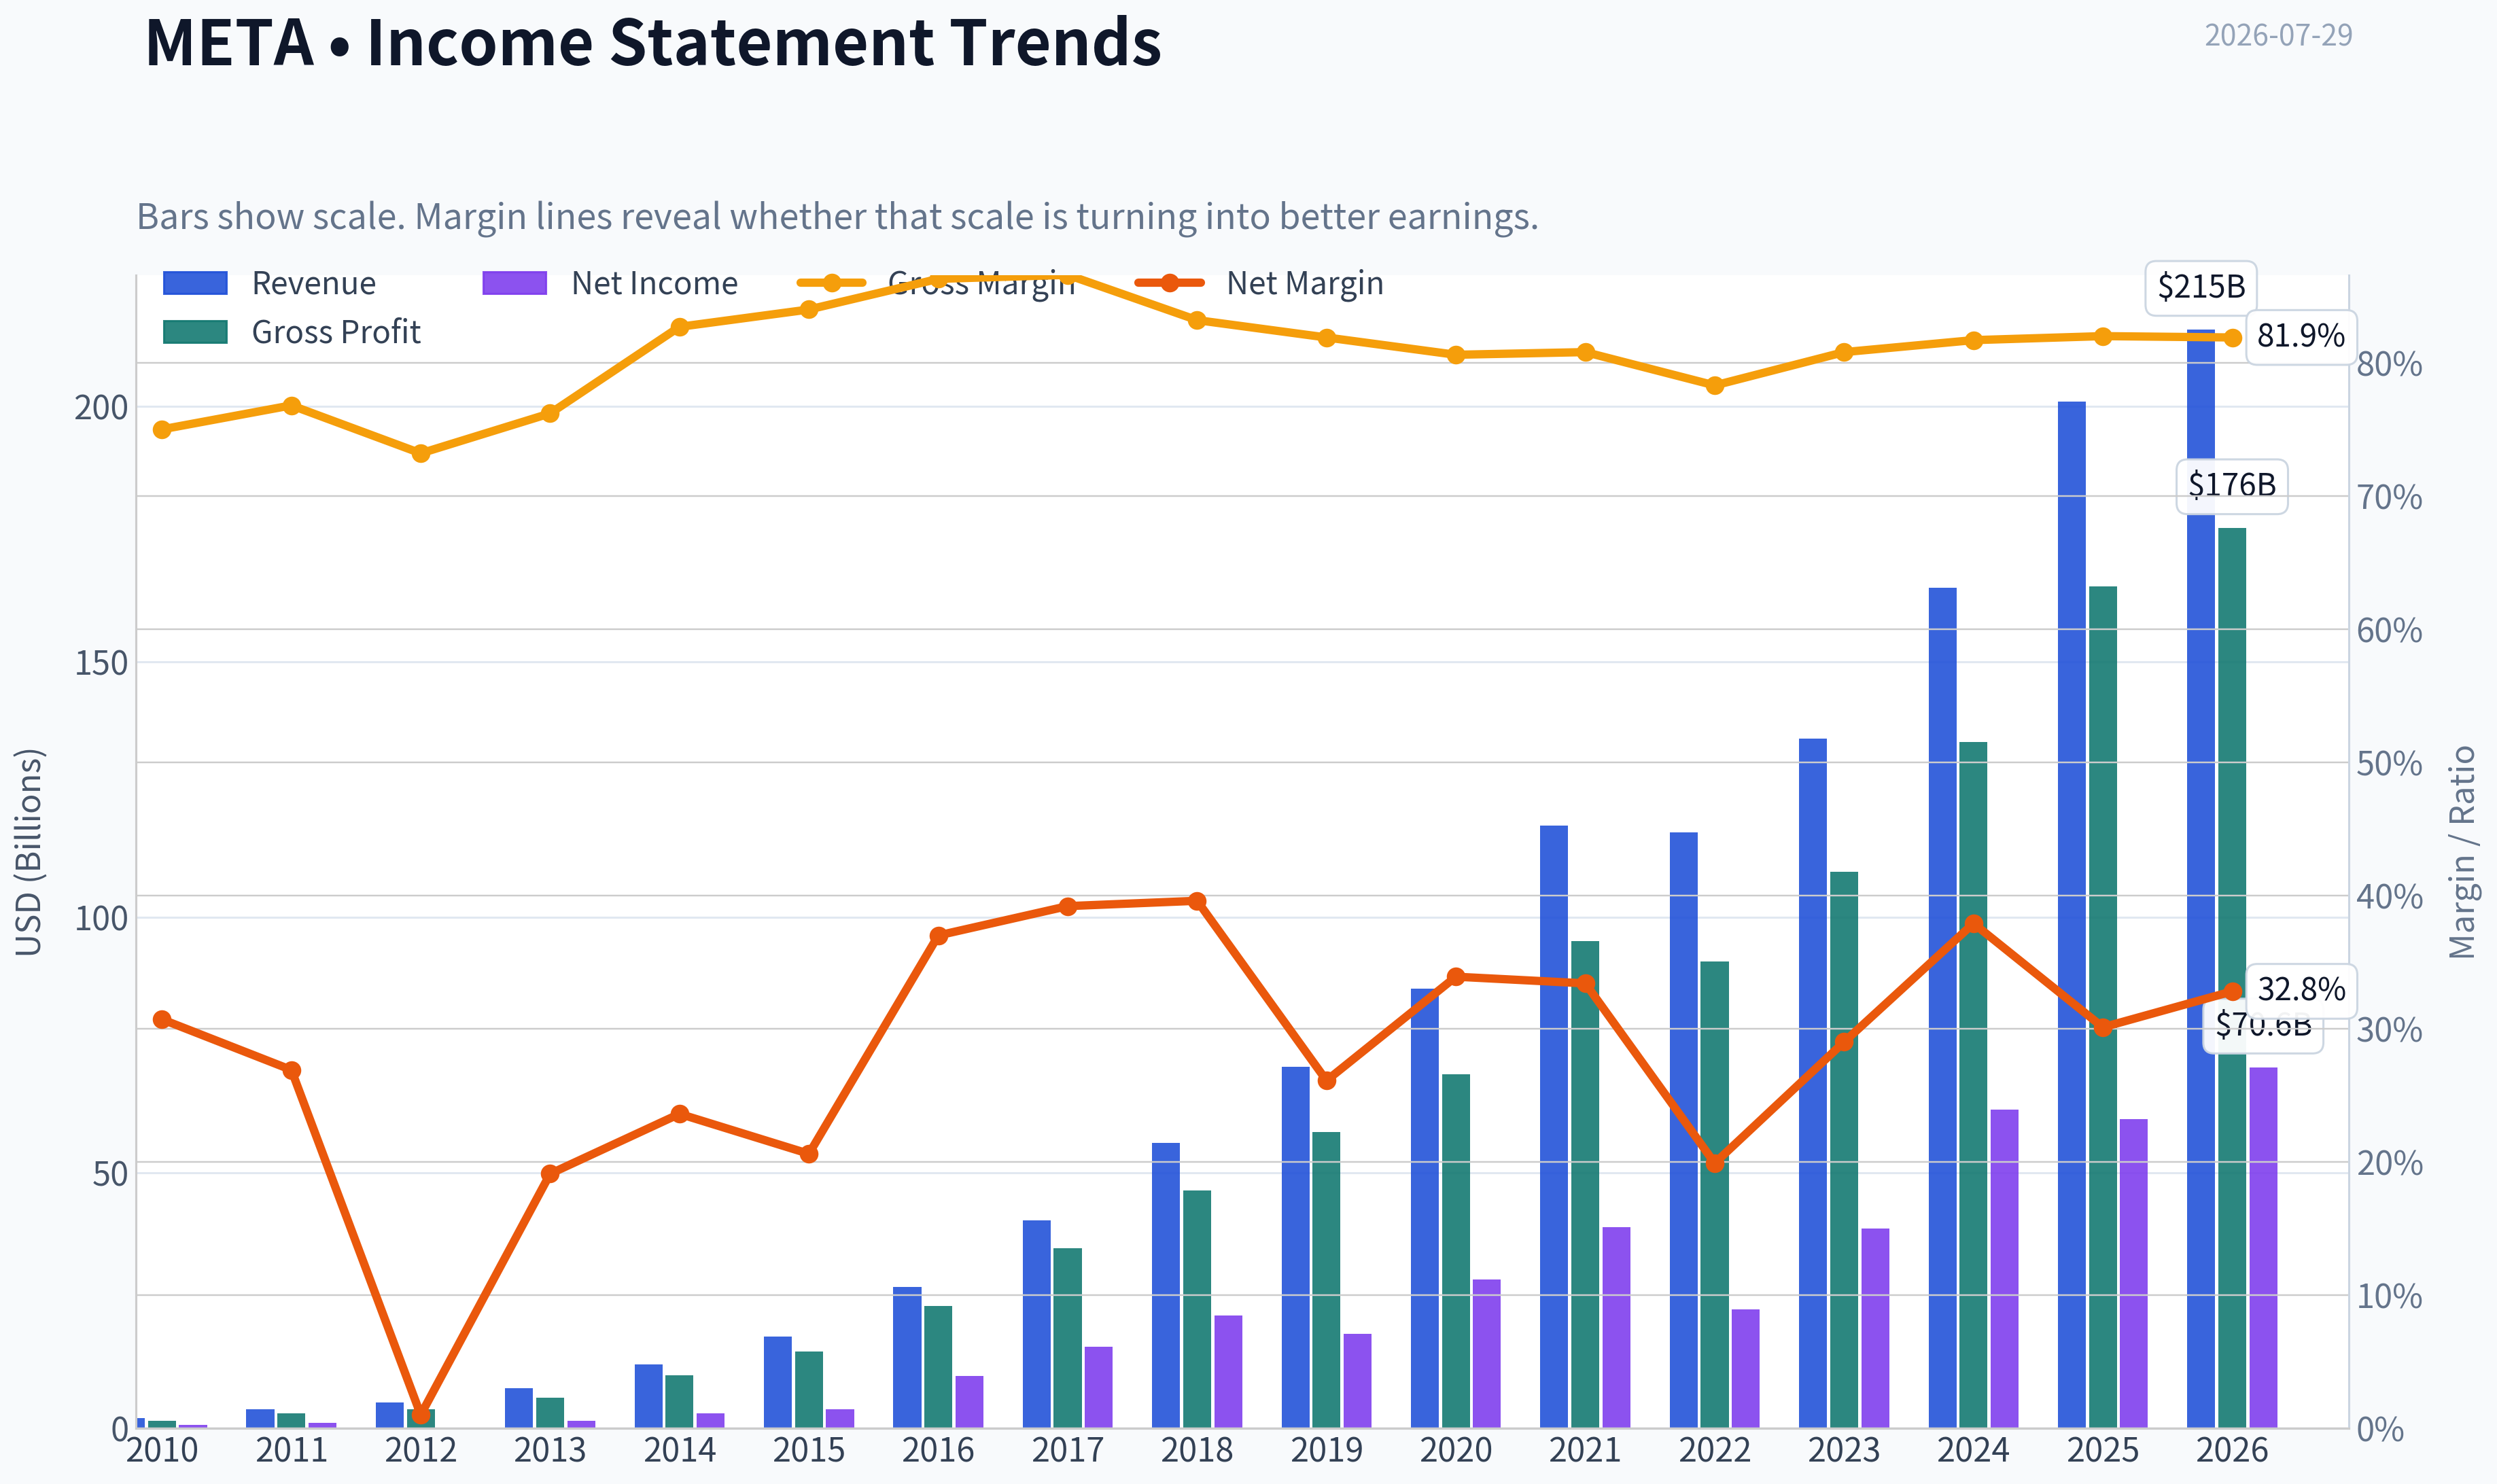
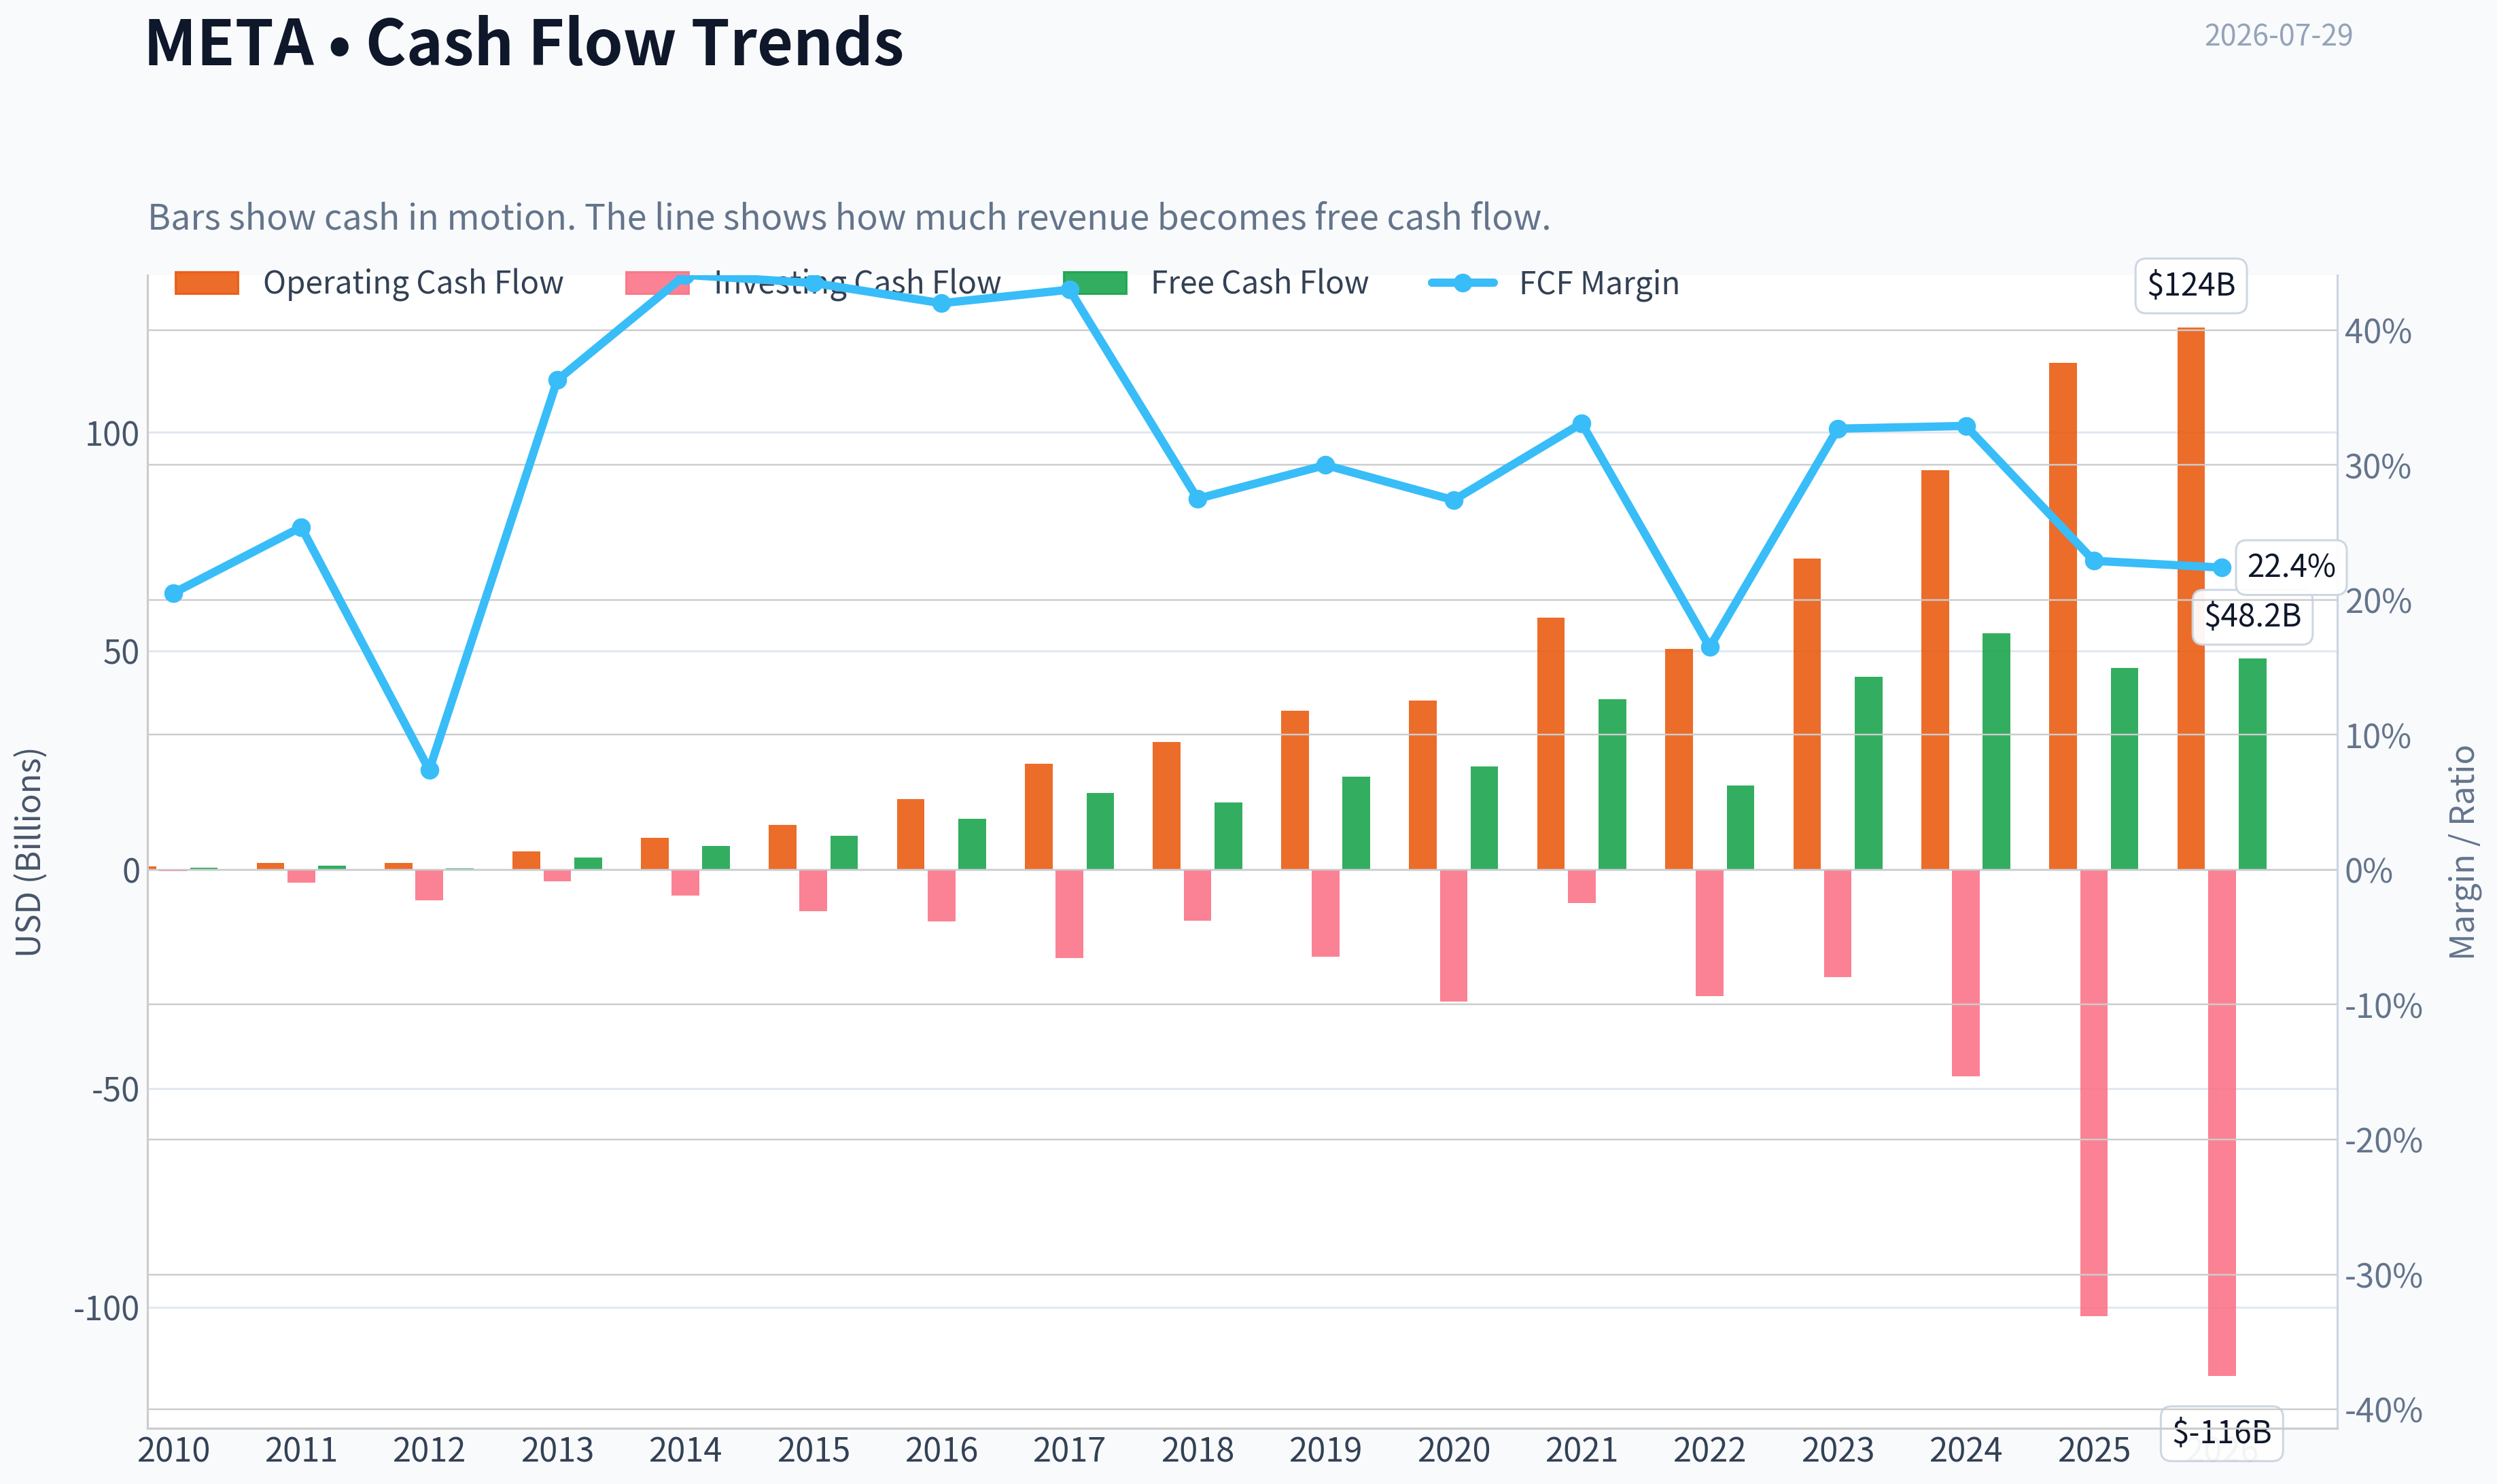
This graph tracks the profitability and return metrics (ROE, ROIC, Margins) of META over the past decade, highlighting capital efficiency trends.
This chart illustrates the financial health of META over the last 10 years, mapping cash equivalents and free cash flow against total obligations (Debt).
This comparison chart from Profitability Analysis stacks current figures against historical benchmarks for META, making it easy to see where the company trades relative to its own averages.
Intrinsic Value Analysis (Buffett)#
Following Warren Buffett's value investing philosophy: Circle of Competence, Economic Moat, Management Quality, and Margin of Safety.
Intrinsic Value Snapshot#
Price is what you pay. Intrinsic value is what the business may be worth based on the cash it can create for owners over time. We show a range, not one magic number.
- Current Price: $585.61
- Value Range (conservative to optimistic across both DCF methods): $246.93 to $2,890.79
Owner Earnings (Buffett Method)
- Net Income: $60,458,000,000.00
- Depreciation & Amortization: $18,616,000,000.00
- Capital Expenditures: $-69,691,000,000.00
- Working Capital Changes: $-885,000,000.00
- Owner Earnings: $61,343,000,000.00
Intrinsic Value
Buffett Method
Uses owner earnings. Stricter, and usually more conservative. - Conservative: $1,094.82 - Average: $1,094.82 - Optimistic: $2,890.79 - Discount Rate: 10.0%
Cash Flow Method
Uses free cash flow. Better for companies spending heavily today to grow tomorrow. - Conservative: $246.93 - Average: $652.33 - Optimistic: $1,738.44 - Discount Rate: 10.0%
ANALYST STANCE: ADVOCATE
META Buffett-Style Investment Report#
1. Factor Scorecard#
| Factor | Score (0-5) | Evidence |
|---|---|---|
| 1. Circle of Competence & Business Simplicity | 4.5 | Meta monetizes user attention through advertising across Facebook, Instagram, WhatsApp, and related properties. The model is easy to explain: massive user engagement, targeted ads, very high incremental margins. The business has evolved toward AI-driven discovery and messaging monetization, but the core economic engine remains understandable and durable. |
| 2. Moat Test | 4.5 | Very strong network effects, immense data advantage, advertiser demand aggregation, and powerful intangible assets in consumer attention. Gross margin of 82% strongly supports moat strength. |
| 3. Management Quality & Capital Allocation | 4.0 | Mark Zuckerberg remains founder-led and clearly thinks long term. Management has shown willingness to invest aggressively in AI infrastructure and product relevance. Capital allocation has improved after prior spending excesses; buybacks and operating discipline have become more rational, though Reality Labs remains a meaningful capital-allocation debate. |
| 4. Industry Structure | 3.5 | Digital advertising is attractive but competitive. Meta is one of a few scaled global platforms with meaningful targeting and engagement advantages. Industry economics are strong for leaders, but platform shifts, privacy policy changes, and AI competition prevent a top score. |
Gate 5 hard floor: Not tripped. Meta does not show financial distress. Earnings power remains substantial, cash generation is strong, and there is no sign of insolvency stress.
Key Takeaways#
Meta scores well because it is easy to understand, highly profitable, and protected by powerful network effects. The main debate is not solvency or basic business quality, but whether management can keep investing heavily in AI and adjacent bets without diluting shareholder returns. This is a quality company, not a distress case.
2. Moat Analysis with Specific Evidence#
| Moat Source | Assessment | Evidence |
|---|---|---|
| Intangible Assets | Strong | Facebook and Instagram are globally dominant attention brands. Advertisers go where user time is concentrated. Gross margin of 82% suggests exceptional pricing power and intangible value. |
| Switching Costs | Moderate | Users can technically switch, but social graphs, creator ecosystems, ad tools, and audience data create stickiness for both users and advertisers. Businesses do not lightly abandon a platform with global reach and proven ad ROI. |
| Cost Advantage | Strong | Meta spreads AI, infrastructure, and moderation costs over billions of users and enormous ad volume. At this scale, few rivals can match its cost per impression or model-training economics. |
| Network Effects | Very Strong | More users attract more creators, businesses, and advertisers; more advertisers fund better tools and experiences; better targeting improves ROI and reinforces demand. This is the core of the franchise. |
Moat Quality Rating: Wide & Stable, with elements of Widening through AI-driven monetization
The most Buffett-like way to frame Meta is this: it owns a set of global digital properties that function like toll roads on human attention. The product mix can evolve, but the underlying advantage is scale in engagement, data, and ad demand. AI likely strengthens the moat if it improves ad relevance and content discovery faster than peers can replicate.
3. Management Quality Assessment#
| Question | Assessment | Evidence |
|---|---|---|
| Do they think like owners? | Yes | Founder-led structure and long-duration strategic behavior indicate owner mindset. Zuckerberg has repeatedly prioritized long-term platform control over near-term optics. |
| Are they honest and candid? | Mixed-to-Strong | Management has acknowledged efficiency issues and corrected course after investor criticism. The "year of efficiency" showed willingness to reverse excess cost growth. |
| Are they rational capital allocators? | Good, not perfect | Core ad business reinvestment has been excellent. AI capex appears rational given scale economics. Reality Labs remains the main question mark, but the core engine produces enough cash to support experimentation without threatening the franchise. |
Overall, management is stronger than the market often credits. The key concern is not integrity or competence, but capital allocation discipline in frontier projects. Buffett would likely appreciate the owner-operator structure and cash machine, while still discounting some value for speculative metaverse spending.
4. Financial Summary Table#
| Metric | Latest |
|---|---|
| Current Price | $586 |
| Market Cap | $1.49T |
| P/E | 21.3x |
| ROE | 27.8% |
| Gross Margin | 82.0% |
| Revenue Growth YoY | 22.2% |
| FCF Yield | 3.1% |
| Current Ratio | 2.60 |
| Headline Intrinsic Value | $905.35 |
| Margin of Safety vs Price | 35.3% |
| Reverse-DCF Implied Growth | ~12.5% for 10 years |
Key Takeaways#
Meta combines high profitability, high returns on equity, and still-strong revenue growth, which is a rare combination at this scale. The valuation is not cheap in a cigar-butt sense, but it is attractive relative to the business quality and the implied growth expectations. The market is asking for far less growth than Meta has recently delivered.
5. Owner Earnings Calculation#
Using the research pack's owner-earnings model output as the valuation anchor:
| Valuation Lens | Estimated Value per Share |
|---|---|
| Owner Earnings DCF | $1,094.82 |
| FCF Value | $652.33 |
| Damodaran FCFF Value | $753.98 |
| Weighted Headline Intrinsic Value | $905.35 |
Owner Earnings Interpretation: The owner-earnings value is the highest of the three, which fits a capital-light, high-margin business whose accounting earnings convert well into distributable economic value over time. For a platform like Meta, owner earnings are more informative than book value because the real assets are attention, data, software, algorithms, and advertiser relationships.
Key Takeaways#
Across all three valuation methods, Meta appears worth more than the current share price. The owner-earnings model is especially favorable because Meta's business has strong cash-generating characteristics once scale is reached. Even the most conservative of the three values still supports a solid business, though with a tighter margin of safety.
6. Three-Scenario DCF Valuation#
| Scenario | Assumption | Estimated Value per Share |
|---|---|---|
| A. No Growth | Capitalize owner earnings at 10% | ~$1,095 |
| B. GDP Growth | 3% perpetual growth | ~$753-$905 range |
| C. Historical Growth Haircut | Price tested against reduced historical growth, capped prudently | Supports value above current price; reverse-DCF implies only ~12.5% annual growth for 10 years |
Meta's trailing 3-year growth of 51.9% is obviously too high to extrapolate literally. But the market price only requires roughly 12.5% annual growth for a decade. For a dominant global ad platform with AI-enhanced monetization, that hurdle looks demanding but plausible rather than heroic.
Key Takeaways#
The valuation case does not depend on unrealistic assumptions. Meta does not need to repeat its recent explosive growth to justify today's price. It only needs to grow at a solid double-digit pace, which seems achievable given its scale, margins, and improving monetization tools.
7. Margin of Safety Analysis#
| Item | Value |
|---|---|
| Current Price | $586 |
| Headline Intrinsic Value | $905.35 |
| Margin of Safety | 35.3% |
| Quality-Scaled Required MoS | ~10-15% for a business of this quality |
Meta exceeds the required margin of safety for a wide-moat, high-ROIC compounder. This is the exact situation Buffett evolved toward in later years: a wonderful business, understandable economics, superb returns, and a price that does not require fantasy assumptions.
The recent earnings disappointment and concern about AI spending may create volatility, but volatility is not the same as impaired intrinsic value. If AI capex preserves or extends the ad moat, short-term margin pressure may actually be a favorable setup for long-term owners.
8. Final Buffett Scorecard#
| Criterion | Weight | Score (1-5) | Weighted Score |
|---|---|---|---|
| Moat Width & Durability | 25% | 4.5 | 1.13 |
| Valuation / Margin of Safety | 20% | 4.5 | 0.90 |
| Capital Returns - ROIC vs. WACC | 15% | 4.5 | 0.68 |
| Business Understanding & Predictability | 12% | 4.0 | 0.48 |
| Management Quality & Capital Allocation | 12% | 4.0 | 0.48 |
| Reinvestment Runway | 8% | 4.5 | 0.36 |
| Balance Sheet Strength | 4% | 4.5 | 0.18 |
| Industry Structure | 4% | 3.5 | 0.14 |
| Total Weighted Score | 4.35 / 5.00 |
|---|---|
Key Takeaways#
Meta earns a score firmly in ADVOCATE territory because it combines a strong moat, high returns, reinvestment potential, and a valuation that still leaves room for upside. The biggest risk is capital allocation discipline, not business fragility. This is a high-quality franchise available at a fair-to-good price.
9. Investment Stance with Conviction Level#
Investment Stance: ADVOCATE Conviction Level: High
Meta fits the modern Buffett mold better than many traditional "value" stocks. It is asset-light, massively cash generative, founder-led, and protected by a durable network-driven moat. At $586 versus a headline intrinsic value near $905, the stock offers a meaningful margin of safety for a business of this quality.
Near-term sentiment may remain noisy because of AI spending, softer guidance, and market reactions to quarterly results. But long-term investors should care more about whether Meta can sustain user engagement, advertiser ROI, and high incremental returns on reinvestment. On that basis, the answer remains yes.
Bottom line: wonderful business, fair-to-attractive price, long runway, and no distress signals.
Valuation Bridge#
This bridge places the current market price beside each intrinsic value lens so readers can see whether upside depends on one method or shows up across several methods.
| Scenario | Intrinsic Value / Share |
|---|---|
| Buffett Method | $1,094.82 |
| Cash Flow Method | $652.33 |
| Damodaran Method | $753.98 |
| Current Price | $585.61 |
Key Takeaways#
If one method is far above the others, the upside case depends on a specific modelling assumption. When several methods cluster together, the valuation story is more robust.
Valuation Visuals#
This comparison chart from Latest Earnings Snapshot stacks current figures against historical benchmarks for META, making it easy to see where the company trades relative to its own averages.
This comparison chart from Current vs Historical Average Comparison stacks current figures against historical benchmarks for META, making it easy to see where the company trades relative to its own averages.
This comparison chart from Balance Sheet and Financial Strength stacks current figures against historical benchmarks for META, making it easy to see where the company trades relative to its own averages.
This comparison chart from Cash Flow Analysis stacks current figures against historical benchmarks for META, making it easy to see where the company trades relative to its own averages.
Trend & Growth Analysis (Lynch/Druckenmiller/Fisher)#
Following Peter Lynch's GARP, Stanley Druckenmiller's macro-aware approach, and Philip Fisher's scuttlebutt methodology.
ANALYST STANCE: ADVOCATE
META Growth Analysis#
1. Lynch Classification#
| Item | Assessment |
|---|---|
| Category | Fast Grower |
| Revenue growth YoY | 22.2% |
| Business type | Scaled digital advertising + AI-enabled monetization platform |
| Lynch fit | Large-cap, but still behaving like a fast grower due to re-acceleration and high incremental returns in core ads |
Key Takeaways: Meta is not a stalwart in the usual slow-and-steady sense right now. With revenue growing above 20 percent at mega-cap scale, it still qualifies as a fast grower under Lynch's framework. That matters because the investment case is not just quality and durability, but renewed acceleration from AI, Reels, and messaging monetization.
2. The Story in 3 Bullets#
- Meta owns some of the world's largest attention and communication networks, then monetizes that attention through high-ROI digital ads.
- AI is improving ranking, engagement, ad targeting, and advertiser productivity, which can raise revenue faster than user growth alone.
- The market is worried about AI capex and softer near-term guidance, but the core business still appears capable of compounding earnings and cash flow at an attractive rate.
3. TAM Analysis and 10x Test#
| Metric | Value | Assessment |
|---|---|---|
| Current revenue run-rate | Not fully refreshed here; business is already enormous | Very large base |
| 10x revenue test | Implies a multi-trillion-dollar revenue outcome | Fails literal 10x test |
| Core ad TAM | Global digital advertising + commerce ads + SMB marketing + messaging + AI tools | Still expanding |
| Adjacent TAMs | Business messaging, AI agents, commerce discovery, creator monetization, AR/VR | Adds optionality |
| Runway conclusion | Not a classic 10x-from-here revenue story, but still substantial earnings and FCF runway | Good, not infinite |
Key Takeaways: Meta does not pass the classic small-cap 10x revenue runway test because it already starts from a huge scale. But its market opportunity is still expanding through digital ad share gains, messaging monetization, and AI-driven products. So this is more a "double to triple with high quality" setup than a fresh ten-bagger from today's size.
4. Revenue Growth Trend#
| Metric | Value |
|---|---|
| Revenue growth YoY | 22.2% |
| Recent interpretation | Re-accelerated / sustaining high growth |
| Risk from latest coverage | Q3 midpoint guide of ~$62.5B came in slightly below expectations |
| Trend call | Strong, but watch for near-term moderation |
Key Takeaways: The big picture is still healthy because Meta is growing above 20 percent, which is exceptional for a company this large. The caution flag is that the latest quarterly reaction suggests investors are now focused on whether growth can stay strong while AI spending climbs. So the setup remains positive, but the next few quarters matter more than usual.
5. Unit Economics#
| Metric | Value | Comment |
|---|---|---|
| Gross margin | 82.0% | Elite platform economics |
| ROE | 27.8% | Strong capital efficiency |
| FCF yield | 3.1% | Decent for quality mega-cap growth |
| NRR | N/A | Not relevant in standard SaaS sense |
| LTV/CAC | N/A | Not disclosed in a conventional way |
| Rule of 40 proxy | ~25.3% (22.2% growth + 3.1% FCF yield proxy, imperfect) | Healthy but not SaaS-comparable |
Key Takeaways: Meta's unit economics are excellent where they matter most: high gross margin, strong returns on equity, and meaningful free cash generation. Traditional SaaS metrics like NRR and LTV to CAC do not fit well here, but the underlying business quality is still obvious. The main issue is not whether the model works, but whether incremental AI investment earns strong returns.
6. Inflection Point Assessment#
| Inflection Type | Evidence | Verdict |
|---|---|---|
| Product cycle inflection | AI recommendation engines and ad tools improving engagement/monetization | Positive |
| Market share inflection | Continued ad budget capture due to scale and ROI tools | Positive |
| Margin inflection | At risk near term due to rising AI costs | Mixed |
| TAM inflection | AI assistants, business messaging, commerce, creator tools broaden use cases | Positive |
| Competitive inflection | TikTok and YouTube remain intense rivals; Meta still holding position | Neutral-positive |
Key Takeaways: Meta clearly has a real AI-driven product and monetization inflection, not just a narrative one. The strongest evidence is that AI can deepen engagement and improve advertiser outcomes across existing surfaces. The one offset is margin pressure, because infrastructure spending may run ahead of monetization in the near term.
7. Macro Setup Evaluation#
| Factor | Assessment |
|---|---|
| Interest-rate backdrop | Mixed; higher-for-longer is a valuation headwind |
| Ad cycle sensitivity | Moderately cyclical, but Meta is a share winner |
| Secular themes | AI, digital advertising, business messaging, creator economy |
| Druckenmiller read | Strong secular winner with some macro and capex volatility |
Key Takeaways: The macro backdrop is not perfect for growth stocks if rates stay elevated, but Meta has enough cash flow and scale to offset that better than most. More importantly, it is aligned with powerful secular trends in AI and digital advertising. This makes it a high-quality growth name even if the tape gets choppy.
8. Fisher 15 Points Score#
| Fisher Dimension | Score (1-5) | Comment |
|---|---|---|
| Market potential | 5 | Massive global reach and monetization depth |
| New products | 5 | Heavy AI, messaging, creator, AR/VR investment |
| R&D effectiveness | 4 | Strong, though some bets are uncertain |
| Sales organization | 5 | World-class advertiser ecosystem |
| Profit margin | 5 | Excellent |
| Improving margins | 3 | Near-term pressure from AI cost ramp |
| Labor/personnel relations | 3 | Adequate, not a core edge |
| Executive relations | 4 | Strong founder control, generally cohesive |
| Management depth | 4 | Deep bench, though founder-centralized |
| Cost controls/accounting | 4 | Efficiency improved, capex discipline now key |
| Special advantages | 5 | Network effects, data, scale, attention graph |
| Long-range profit outlook | 5 | Very strong if AI spend monetizes well |
| Dilution risk | 5 | Low; buyback-friendly |
| Candor | 4 | Generally clear on AI spend and strategy |
| Integrity | 4 | Acceptable, though regulatory baggage exists |
| Total | 65 / 75 | Outstanding |
Key Takeaways: Meta scores very well on Fisher because it combines large market potential, strong innovation, elite margins, and durable strategic advantages. The biggest deductions come from near-term margin pressure and uncertainty around capital allocation into AI and Reality Labs. Overall, this still looks like an outstanding franchise rather than just a good one.
9. Valuation Analysis#
| Metric | Value | Interpretation |
|---|---|---|
| Current price | $586 | Reference price |
| Market cap | $1.49T | Mega-cap |
| P/E | 21.3x | Reasonable for 22% growth |
| PEG | ~0.96 using P/E 21.3 / growth 22.2 | Attractive |
| Intrinsic value headline | $905.35 | Suggests undervaluation |
| Margin of safety | 35.3% | Attractive |
| Reverse DCF implied growth | ~12.5% for 10 years | Looks conservative vs trailing growth profile |
| FCF yield | 3.1% | Fair-to-good for quality compounder |
Key Takeaways: Valuation is one of the most attractive parts of the META setup. A PEG around 1 suggests investors are not overpaying for the current growth rate, and the reverse DCF implies a long-term growth expectation below what the business has recently delivered. In plain English, the market seems to be pricing Meta as a good company with spending risk, not as a uniquely advantaged AI-enabled compounder.
10. Growth Investor Scorecard#
| Criterion | Weight | Score | Weighted Score |
|---|---|---|---|
| The Story | 10% | 4.5 | 0.45 |
| TAM & Runway | 20% | 3.5 | 0.70 |
| Revenue Growth | 20% | 4.5 | 0.90 |
| Unit Economics | 15% | 4.5 | 0.68 |
| Competitive Position | 10% | 4.5 | 0.45 |
| Management Quality | 10% | 4.0 | 0.40 |
| Macro Setup | 5% | 3.5 | 0.18 |
| Profitability Path | 5% | 4.0 | 0.20 |
| Valuation | 5% | 4.5 | 0.23 |
| Total Score | | | 4.18 / 5.0 |
Key Takeaways: Meta scores comfortably in ADVOCATE territory on a growth-investor basis. The strongest pillars are revenue growth, business quality, competitive position, and valuation. The main thing keeping the score from being even higher is the reality that capex and guidance volatility could create short-term turbulence.
11. Position Size Stance#
| Conviction | Suggested Stance |
|---|---|
| High | Core position / Above-average weight |
| Aggressive growth portfolio | 5-8% starter, add on AI-capex panic if thesis intact |
| Risk-managed portfolio | 3-5% position |
Key Takeaways: This looks like a stock that deserves real size, not just watch-list status. The best approach is to respect volatility around earnings and capex guidance, but not confuse that volatility with a broken long-term thesis. If the market continues to sell off on near-term spend fears while growth remains healthy, that likely improves the setup.
12. Key Risks and Catalysts#
| Risks | Catalysts |
|---|---|
| AI capex rises faster than monetization | Proof that AI tools improve ad conversion and pricing |
| Softer ad demand / macro slowdown | Re-acceleration in ad revenue growth |
| Q3 guidance disappointment extends | Better-than-feared margins despite investment |
| TikTok / YouTube competition | Monetization of WhatsApp/business messaging |
| Reality Labs remains a capital sink | Larger buybacks or stronger FCF conversion |
| Regulatory / antitrust pressure | Market rerates META closer to intrinsic value estimates |
Key Takeaways: The bear case is mostly about spending discipline and near-term execution, not about a weak core business. The bull case is straightforward: if AI investment starts showing tangible monetization while Meta maintains above-20-percent growth, the stock likely rerates higher. In other words, the next upside leg depends more on proof of returns than on storytelling.
Bottom Line#
META fits Lynch as a fast grower, Druckenmiller as a high-quality secular winner with an AI inflection, and Fisher as an outstanding franchise. It is too large to be a classic fresh ten-bagger from here, but it still has the ingredients for strong compounding: high growth, elite margins, network effects, and a valuation that is not demanding.
Final view: ADVOCATE. This is a high-quality core growth holding, especially attractive if market volatility around AI capex creates a better entry.
Market Technical Analysis#
Temporary fallback for Market Analyst
Primary model call timed out or the provider returned a transient error. Trigger: TimeoutError: Market Analyst exceeded 420s without producing a result
Interim stance: WATCH until a fresh pass is available.
Available evidence from the current analyst handoff bundle: Reference: Latest Earnings Snapshot
Market Visuals#
This comparison chart from Market Metrics stacks current figures against historical benchmarks for META, making it easy to see where the company trades relative to its own averages.
Options Market Analysis#
Reading options flow - put/call ratios, IV skew, and unusual activity - to gauge institutional positioning and event-driven risk.
META Options Positioning Report#
Data as of 2026-07-29
1. Put/Call Ratio Analysis#
| Near-Term Expirations | Call OI | Put OI | Put/Call OI Ratio | Call Vol | Put Vol | Put/Call Volume Ratio |
|---|---|---|---|---|---|---|
| 2026-07-31 | 146,012 | 64,913 | 0.44 | 103,720 | 81,266 | 0.78 |
| 2026-08-03 | 11,226 | 4,738 | 0.42 | 5,103 | 5,291 | 1.04 |
| 2026-08-05 | 4,981 | 2,628 | 0.53 | 1,887 | 1,645 | 0.87 |
| Near-term total | 162,219 | 72,279 | 0.45 | 110,710 | 88,202 | 0.80 |
Key Takeaways: META's near-term open interest is clearly call-heavy, with a 0.45 put/call OI ratio versus a rough neutral baseline near 0.7. That suggests traders are leaning bullish in positioning, not defensive. Volume is less one-sided at 0.80, which means there is still active put demand, but not enough to overturn the overall call bias.
Interpretation: - A 0.45 put/call OI ratio is meaningfully below neutral and signals bullish-to-constructive positioning. - The 0.80 put/call volume ratio shows puts are still trading actively, likely reflecting event hedging rather than outright bearish control. - The sharpest bullish lean is in the front weekly (07-31), which usually points to event-driven speculation and short-dated directional bets.
2. Implied Volatility Assessment#
| Expiry | ATM Call IV | ATM Put IV | Call vs Put ATM Read |
|---|---|---|---|
| 2026-07-31 | 149.9% | 140.0% | Calls richer than puts |
| 2026-08-03 | 97.1% | 90.3% | Calls richer than puts |
| 2026-08-05 | 85.4% | 79.5% | Calls richer than puts |
Key Takeaways: Near-term implied volatility is extremely elevated, especially in the 07-31 expiry where ATM IV is around 140% to 150%. That is not normal day-to-day pricing; it strongly implies a major catalyst is being priced in. The unusual feature is that calls are richer than puts at-the-money, which points more toward upside chasing than classic downside panic.
IV read: - Very high front-end IV strongly suggests the market is pricing a major near-term event, almost certainly earnings or another major company-specific catalyst. - IV falls quickly from ~150% on 07-31 to ~97% on 08-03 and ~85% on 08-05, consistent with event premium concentrated in the nearest expiry. - This setup implies traders expect a large post-event move, and options are expensive enough that directional buyers need a meaningful move to win.
Skew assessment: From the provided chain summary and unusual flow, the skew is not showing classic put-fear dominance. In fact: - ATM calls trade at higher IV than ATM puts across all listed expiries. - Heavy activity in far OTM calls also suggests call skew / upside chase rather than a steep downside hedge skew. - There is still notable put activity, but the overall surface appears tilted toward upside demand, which is unusual for a large-cap and generally bullish in tone.
3. Unusual Options Activity#
For context, contracts with volume far above open interest usually indicate new positioning rather than simple closing trades.
| Expiry | Type | Strike | Volume | OI | Vol/OI | IV | Positioning Read |
|---|---|---|---|---|---|---|---|
| 2026-07-31 | PUT | 475.0 | 4,939 | 508 | 9.7x | 146.8% | Fresh downside hedge / bearish lotto |
| 2026-07-31 | CALL | 595.0 | 4,198 | 466 | 9.0x | 149.5% | Aggressive upside speculation |
| 2026-07-31 | PUT | 587.5 | 3,027 | 210 | 14.4x | 138.3% | Near-spot protective put / bearish event bet |
| 2026-07-31 | PUT | 415.0 | 1,862 | 100 | 18.6x | 167.2% | Deep OTM crash hedge, likely tail-risk protection |
| 2026-08-03 | PUT | 590.0 | 995 | 144 | 6.9x | 91.7% | Post-event hedge near spot |
| 2026-07-31 | CALL | 587.5 | 979 | 55 | 17.8x | 152.7% | High-conviction upside bet near spot |
| 2026-07-31 | CALL | 707.5 | 652 | 26 | 25.1x | 145.0% | Far OTM retail-style upside lottery / squeeze bet |
| 2026-07-31 | CALL | 697.5 | 650 | 75 | 8.7x | 144.7% | Far OTM call speculation |
| 2026-07-31 | PUT | 542.5 | 512 | 59 | 8.7x | 140.6% | OTM downside protection |
Key Takeaways: The unusual flow is active on both sides, but the most important pattern is concentrated short-dated event trading around and above spot. There are real hedges in the puts, especially the 475 and 415 strikes, yet there is also aggressive call buying at 587.5 and 595 plus very speculative upside wings near 700. That combination usually reflects a market expecting a large move, with a slight bias toward upside participation rather than pure fear.
How to interpret these flows: - Likely smart-money / institutional protection: - 07-31 475P and 08-03 590P look more like hedges or downside protection, especially given their size and event timing. - 07-31 415P looks like a tail hedge, likely not a primary directional view but disaster insurance.
- Likely directional bullish speculation:
- 07-31 587.5C and 595C look like near-spot upside bets, the cleaner bullish signals in the tape.
-
697.5C and 707.5C are so far OTM that they look more like high-gamma speculative bets, less reliable as smart-money signals.
-
Net read on unusual activity:
- Not purely bullish, because there is meaningful put demand.
- But the call side is more aggressive in upside expression, especially with calls showing richer IV and repeated fresh activity.
4. Open Interest Concentration and Gamma Influence#
| Expiry | Highest OI Side | OI Concentration Read | Likely Market Impact |
|---|---|---|---|
| 2026-07-31 | Calls dominate overall | Front-week OI heavily call-loaded | Pinning/dampening possible near large call strikes if spot stays nearby |
| 2026-08-03 | Calls dominate | Lighter OI, less structural gravity | Smaller gamma impact than 07-31 |
| 2026-08-05 | Calls dominate | Moderate but not huge | Limited pinning influence |
Key Takeaways: The main structural weight is in the 07-31 expiry, where call open interest massively outweighs puts. That can create a strong gamma effect into expiration, especially if the stock trades near the most active call-heavy strikes. In practice, this often means either price pinning near crowded levels or amplified movement if those strikes start flipping in- or out-of-the-money quickly.
What matters here: - The tool provides aggregate OI by expiry rather than full strike-by-strike OI ranking, so exact max pain and precise gamma wall levels cannot be calculated with certainty. - Still, the front expiry is the clear gamma center of gravity, and the unusual concentration around ~587.5 to 595 suggests that area may matter near expiration. - If META is trading near those strikes into the event/post-event window, dealer hedging could accelerate moves through them or pull price toward them depending on spot behavior.
5. Overall Options Sentiment Signal#
| Category | Signal |
|---|---|
| Directional read | BULLISH |
| Confidence | Moderate |
| Primary driver | Call-heavy OI, call-rich IV, upside-biased unusual flow into a near-term catalyst |
Key Takeaways: The options market is not complacent; it is pricing a large move and actively buying protection. But despite that hedge demand, the dominant message is still bullish because open interest is strongly call-heavy, ATM call IV exceeds put IV, and the most actionable fresh upside flow sits near spot in the front week. This is a bullish event setup with elevated risk, not a low-volatility grind higher.
Final synthesis: META's options market is giving a BULLISH signal, with some important caveats. The biggest drivers are:
- Put/call OI ratio of 0.45, well below neutral, showing a strong call bias.
- ATM call IV above put IV across all near-term expiries, indicating upside demand rather than downside fear.
- Fresh near-dated call buying at strikes around 587.5 and 595, which is more informative than the very far OTM call lottery flow.
- Event-level IV means the market expects a large move, so bullish does not mean low-risk. It means traders are leaning toward upside participation while still paying for downside insurance.
If I were framing this as an institutional positioning read: bullish skew into a major catalyst, with hedges present but not dominant.
Markdown Summary Table#
| Metric | Read |
|---|---|
| Put/Call Ratio | Bullish - Near-term OI ratio 0.45, volume ratio 0.80 |
| IV Level | Very elevated - front expiry ATM IV roughly 140%-150% |
| Skew Direction | Call skew / upside chase - ATM call IV above put IV; no dominant crash-fear skew |
| Unusual Activity | Mixed but slightly bullish - strong near-spot call buying, plus protective puts |
| Overall Signal | BULLISH - event-driven upside positioning outweighs hedging |
Key Takeaways: In one line, META's options tape says traders expect a big event move and are leaning bullish into it. Protection is active, so this is not carefree optimism, but the balance of positioning still favors upside over downside.
Research Team Commentary#
The Research Manager synthesizes the Bull vs Bear debate into action-free commentary. This is a pre-risk view, not the final stance.
The strongest bull argument is simple: Meta is still one of the highest-quality businesses in the public markets, and the valuation no longer looks obviously stretched. An 82% gross margin business earning roughly 24% ROIC and nearly 28% ROE, with global-scale network effects across Instagram, Facebook, WhatsApp, and Messenger, is exactly the kind of asset-light compounder Buffett's modern framework allows you to own. The bull case also rightly emphasizes that AI spend is not some unrelated moonshot; much of it directly supports the ad engine through ranking, targeting, engagement, and advertiser ROI. If that is true, then today's capex is not value destruction but moat reinforcement. At about 21x earnings, the stock does not appear priced for fantasy.
The strongest bear argument is that "not absurdly expensive" is not the same as "offering a margin of safety." Meta's moat, while very strong, is based on user attention and advertiser ROI, which are more dynamic than classic consumer or infrastructure moats. The real debate is not whether Meta is a great business, but whether future owner earnings will be as strong as headline profitability suggests once sustained AI infrastructure spending is fully recognized. If AI becomes table stakes rather than a widening advantage, Meta may have to spend heavily just to defend position, which would lower incremental returns on capital. In that case, 21x earnings may be fair, but not especially attractive.
My takeaway is that the bull side wins on business quality, but the bear side raises a legitimate valuation discipline point. The key question in Buffett terms is whether the current price implies growth and monetization assumptions Meta can plausibly exceed. Here, I think the answer is yes, though not by a huge margin. This is not a deep-value bargain, but it does look like a wonderful business at a fair price, and for a franchise of this quality, that is enough to lean constructive. I also want to learn from prior mistakes: when a premium-quality mega-cap had elevated event risk and weak setup, being too neutral was a mistake. Here, however, the debate is fundamentally long-term and the valuation is more reasonable than in those prior cases, so I do not think caution should automatically override quality.
Core takeaway: Meta looks like a high-quality compounder whose current valuation is reasonable relative to franchise strength, reinvestment runway, and likely long-term earnings power. The stock does not need heroic assumptions to work, only continued competent execution and evidence that AI capex is improving monetization rather than merely keeping pace with peers.
Rationale: From a value investing perspective, the moat is real and broad enough to matter over a 10-year view. Meta has global distribution, attention scale, advertiser integration, and data feedback loops that are very hard to replicate. The profitability metrics are exceptional, and there is no financial distress concern. The bear case is useful because it prevents us from treating all reported earnings as fully distributable and reminds us that capex intensity matters. But even after respecting that, the stock at roughly 21x earnings does not appear to require implausible growth. For a business of this quality, the required margin of safety can be narrower than for an average company. I would not call it cheap, but I do think it clears the bar for a quality-scaled attractive entry.
Monitoring plan over the next 1-4 quarters: First, watch capex versus monetization evidence. I want to see AI spending translate into better ad pricing, higher engagement, stronger conversion, or improved revenue per impression. Second, watch free cash flow and operating margin direction; if spending keeps rising without corresponding operating leverage, the bear case strengthens. Third, watch commentary around WhatsApp and business messaging monetization, because that is one of the clearest incremental upside levers. Fourth, monitor whether management frames AI infrastructure as temporary acceleration or structurally higher baseline spend. Fifth, watch competitive and regulatory signals for any signs that Meta's targeting or attention advantages are structurally weakening.
What would strengthen the thesis: rising ad efficiency metrics, stable or improving Family of Apps margins despite AI spend, clearer WhatsApp monetization traction, and evidence that incremental capex is producing attractive returns. What would weaken it: persistently heavy capex with little cash flow payoff, signs AI benefits are being competed away industry-wide, weaker advertiser ROI leadership, or a valuation rerating upward without corresponding owner-earnings improvement.
Final stance: ADVOCATE
Value Investing Team Commentary#
The Investor translates the research view into an investment thesis before risk review. This is still not the final stance.
Meta fits the profile of a modern Buffett-style business better than many traditional "value" names. You are looking at a global attention platform with extraordinary scale, embedded user habits, advertiser dependence, and very high incremental economics in its core ad engine. Facebook, Instagram, WhatsApp, and Messenger together form a distribution system that is difficult to replicate and even harder to dislodge. That matters far more than short-term sentiment swings.
The key issue is not whether Meta is a good business. It clearly is. The real question is whether today's price gives a sensible owner's return relative to the business's long-term earnings power. On the information provided, the answer appears to be yes. At roughly 21x earnings, with 82% gross margins, ROIC around 24%, and ROE near 28%, the stock does not look priced for perfection. For a business with this scale, these returns, and this moat, that multiple is closer to fair-to-attractive than speculative.
The bear case deserves respect. Meta's accounting earnings are not the same as fully distributable owner earnings if AI infrastructure spending remains structurally elevated. That is the right place to be skeptical. Markets may be correctly signaling that capital intensity is rising and that "AI leadership" could become partly defensive rather than purely accretive. If Meta must keep spending aggressively just to maintain ad relevance, incremental returns could compress over time. That would make the current valuation less compelling than it first appears.
But selective contrarian thinking suggests the market may be over-focusing on that risk in the near term. The headline fear is "AI capex is exploding." The better question is: what does that mean for the business 5-10 years from now? If the spending improves ranking, engagement, conversion, and advertiser ROI, then it is not mere expense inflation; it is moat maintenance and possibly moat widening. In that case, current skepticism may be creating an opportunity to buy a superior franchise before the payoff is fully visible in reported owner earnings.
What the market may be missing is that Meta's AI investment is unusually close to the cash register. This is not purely a distant research project. Better recommendations and better ad targeting can feed directly into monetization. A company with Meta's scale can convert even modest improvements in relevance into very large revenue and cash flow gains. That is a powerful advantage versus firms spending heavily on AI without a similarly direct monetization loop.
Another underappreciated source of optionality is WhatsApp and business messaging. If management executes there with discipline, that can become a meaningful incremental earnings lever layered on top of the existing advertising machine. Investors often focus on quarterly capex noise and underweight the value of embedded monetization options inside platforms with billions of users.
The main risk is not balance sheet distress or a collapsing franchise. It is a slower-burn issue: capital allocation efficiency. If the next several quarters show rising capex without corresponding evidence in ad performance, free cash flow conversion, or margin resilience, then the market's caution will have been justified. Likewise, if AI becomes fully commoditized and no one earns superior returns from it, Meta's current valuation would look more like fair value than opportunity.
Still, this is where Buffett's quality-scaled margin of safety matters. A mediocre business needs a large discount. A wonderful business does not. Meta appears to be a wonderful business available at roughly a fair price, perhaps a bit better than fair if management can translate AI spending into visible monetization. That is enough for a constructive stance, though not for blind aggression.
So the long-term owner's view is favorable: strong moat, elite economics, no distress, credible reinvestment runway, and valuation that does not require fantasy. The near-term debate around AI capex is real, but it looks more like a question of return timing than franchise impairment. If sentiment remains cautious because investors fear spending before seeing the payoff, that may be exactly the kind of temporary discomfort that creates acceptable entry points in great businesses.
ANALYST STANCE: ADVOCATE
Deep Values Commentary#
The Risk Management Team debates and the Risk Judge provides the final action-free verdict. This section determines the final ADVOCATE / WATCH / AVOID stance.
Final Stance Scorecard#
This scorecard converts the final research view into a weighted decision frame. It does not replace the narrative judgement, but it makes the main drivers of the verdict easier to scan.
| Criterion | Score | Weight | Commentary |
|---|---|---|---|
| Business Quality | 4.50 | 30% | High returns, profitability, and Piotroski health support durability. |
| Valuation Support | 3.33 | 30% | Blends current price against available intrinsic value anchors and valuation ratios. |
| Financial Strength | 4.67 | 20% | Balance-sheet resilience reflects leverage and liquidity staying within safe ranges. |
| Growth Durability | 2.33 | 20% | Recent revenue, earnings, and free cash flow growth indicate how durable expansion looks. |
| TOTAL / FINAL STANCE | 3.75 | 100% | ADVOCATE |
Key Takeaways#
The weighted score lands at 3.75 / 5.0, while the final stance remains ADVOCATE. This is useful as a quick calibration aid rather than a mechanical signal.
Risk Summary#
Higher scores indicate more risk pressure. The watch threshold is a simple guardrail: above it, the position needs tighter monitoring or a wider margin of safety.
| Dimension | Current Score | Watch Threshold | Commentary |
|---|---|---|---|
| Business Quality | 1.50 | 3.00 | High returns, profitability, and Piotroski health support durability. |
| Valuation Support | 2.67 | 3.00 | Blends current price against available intrinsic value anchors and valuation ratios. |
| Financial Strength | 1.33 | 3.00 | Balance-sheet resilience reflects leverage and liquidity staying within safe ranges. |
| Growth Durability | 3.67 | 3.00 | Recent revenue, earnings, and free cash flow growth indicate how durable expansion looks. |
Key Takeaways#
This view helps readers separate where the risk sits: valuation, business quality, balance sheet, or growth durability. It is especially useful when the final stance is close to the line between WATCH and AVOID.
Frequently asked questions
Is Meta Platforms, Inc. overvalued according to DeepValues Research?
The Jul 29, 2026 report does not find Meta Platforms, Inc. (META) overvalued: its headline intrinsic value estimate is $968 per share against a $586 share price (margin of safety 39.5%), and the final stance is Bullish (ADVOCATE, score 3.75/5). The report's intrinsic-value models give a range rather than one number; this is educational research, not investment advice.
What is DeepValues Research's stance on META?
Bullish (ADVOCATE, score 3.75/5) as of Jul 29, 2026. DeepValues stances are ADVOCATE (bullish), WATCH (neutral) or AVOID (bearish), with a weighted 0-5 scorecard; each report is a dated snapshot.
Where is the full Meta Platforms, Inc. analysis?
The full report is at https://research.deepvalues.ai/company/meta/2026-07-29-en/ (markdown twin: https://research.deepvalues.ai/company/meta/2026-07-29-en/index.md); all Meta Platforms, Inc. reports are at https://research.deepvalues.ai/company/meta/. Live fundamentals and intrinsic values for META are in the DeepValues app (https://deepvalues.ai) and the DeepValues API (https://app.deepvalues.ai/developers).