
Company Research MUDeep Value Intelligence
Micron Technology (MU) Deep Value Intelligence Report

In briefNeutral3.63
As of Apr 16, 2026, DeepValues Research rates Micron Technology (MU) Neutral (WATCH, score 3.63/5). Micron sits at the intersection of a real AI infrastructure boom and a historically brutal commodity industry. Key figures: share price $457; P/E (TTM) 21.60; free-cash-flow yield 0.3%; ROE 15.8%.
Source: https://research.deepvalues.ai/company/mu/2026-04-16-en/ · Markdown · More on Micron Technology (MU)
Contents
- Intelligence Summary
- Thesis + Conditions
- Analyst Team Reports
- Fundamentals Analysis
- Intrinsic Value Analysis (Buffett)
- Trend & Growth Analysis (Lynch/Druckenmiller/Fisher)
- Market Technical Analysis
- Social Sentiment Analysis
- News & Events Analysis
- Research Team Commentary
- Value Investing Team Commentary
- Deep Values Commentary
Intelligence Summary#
Thesis + Conditions#
Core Thesis: Executive Summary Micron sits at the intersection of a real AI infrastructure boom and a historically brutal commodity industry. The business is improving-higher margins, industry consolidation, and HBM demand suggest the mid-cycle earnings baseline may be rising.
Key Risks: - Micron sits at the intersection of a real AI infrastructure boom and a historically brutal commodity industry. The business is improving-higher margins, industry consolidation, and HBM demand suggest the mid-cycle earnings baseline may be rising. But the key Buffett question is durability. Micron still lacks company-specific pricing power, remains capital intensive, and most revenue still depends on cyclical DRAM/NAND markets. With the stock trading far above conservative intrinsic value estimates, the margin of safety is absent. The opportunity may be real, but the valuation already assumes much of the optimistic future. Verdict: WATCH. - Risky Analyst (Bullish Thesis) - The claim is that these numbers reflect a structural demand shock rather than a normal cycle rebound. If AI becomes a multi-decade infrastructure buildout, Micron could transition from cyclical supplier to critical compute infrastructure provider. - Cycle risk: Violent earnings growth is typical early in semiconductor recoveries when pricing rebounds from trough levels. - Valuation risk: With the stock around $457 and intrinsic value models far lower ($19-$59), expectations embedded in the price are extremely high. Even a successful AI story could still lead to poor investment returns if expectations normalize.
What Would Change Our View: - Micron sits at the intersection of a real AI infrastructure boom and a historically brutal commodity industry. The business is improving-higher margins, industry consolidation, and HBM demand suggest the mid-cycle earnings baseline may be rising. But the key Buffett question is durability. Micron still lacks company-specific pricing power, remains capital intensive, and most revenue still depends on cyclical DRAM/NAND markets. With the stock trading far above conservative intrinsic value estimates, the margin of safety is absent. The opportunity may be real, but the valuation already assumes much of the optimistic future. Verdict: WATCH. - Risky Analyst (Bullish Thesis) - The claim is that these numbers reflect a structural demand shock rather than a normal cycle rebound. If AI becomes a multi-decade infrastructure buildout, Micron could transition from cyclical supplier to critical compute infrastructure provider. - Cycle risk: Violent earnings growth is typical early in semiconductor recoveries when pricing rebounds from trough levels. - Valuation risk: With the stock around $457 and intrinsic value models far lower ($19-$59), expectations embedded in the price are extremely high. Even a successful AI story could still lead to poor investment returns if expectations normalize.
Confidence: Medium
Analyst Team Reports#
Fundamentals Analysis#
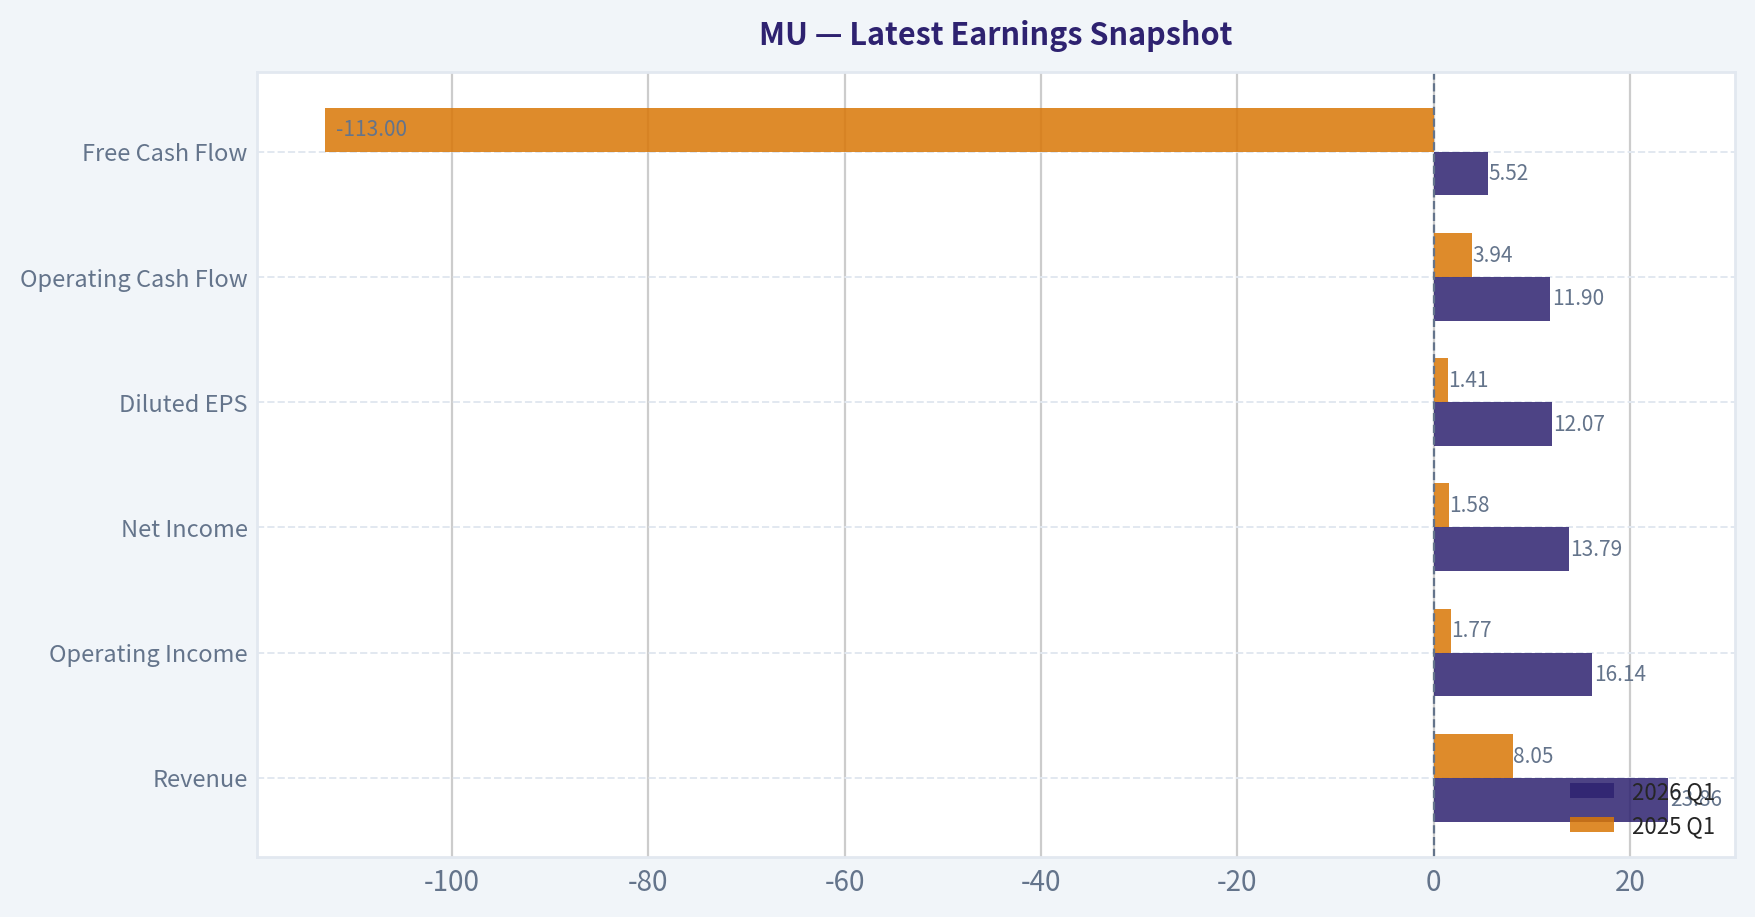
Latest Earnings Snapshot#
Most recent reported quarter anchored on 2026 Q1, with prior-year comparison when available.
| Metric | 2026 Q1 | 2025 Q1 | YoY Change |
|---|---|---|---|
| Revenue | $23.86B | $8.05B | +196.3% |
| Operating Income | $16.14B | $1.77B | +810.0% |
| Net Income | $13.79B | $1.58B | +770.8% |
| Diluted EPS | $12.07 | $1.41 | +756.0% |
| Operating Cash Flow | $11.90B | $3.94B | +202.0% |
| Free Cash Flow | $5.52B | $-113.0M | +4981.4% |
Key Takeaways: This snapshot anchors the most recent reported quarter before the narrative analysis. It helps readers separate long-run business quality from whatever changed in the latest earnings print.
10-Year Financial Metrics for MU#
All values below are computed deterministically from raw data - not estimated by AI.
Issuer profile: operating company (Technology / Semiconductors).
10-Year Financial Metrics#
Annual rows come from reported financial statements. The final TTM row is computed from the latest four quarters.
| Metric | 2016 | 2017 | 2018 | 2019 | 2020 | 2021 | 2022 | 2023 | 2024 | 2025 | 2026 TTM |
|---|---|---|---|---|---|---|---|---|---|---|---|
| Market Price | $21 | $40 | $31 | $53 | $73 | $72 | $55 | $69 | $96 | $119 | $457 |
| Market Cap | $22.18B | $46.35B | $38.09B | $60.04B | $83.05B | $104.06B | $63.43B | $76.44B | $107.60B | $133.89B | $522.16B |
| P/E Ratio | N/A | 18.47 | 8.25 | 104.31 | 82.50 | 17.43 | 7.29 | -13.10 | 137.49 | 15.68 | 21.59 |
| P/B Ratio | 1.84 | 2.49 | 1.18 | 1.67 | 2.13 | 2.37 | 1.27 | 1.73 | 2.38 | 2.47 | 7.21 |
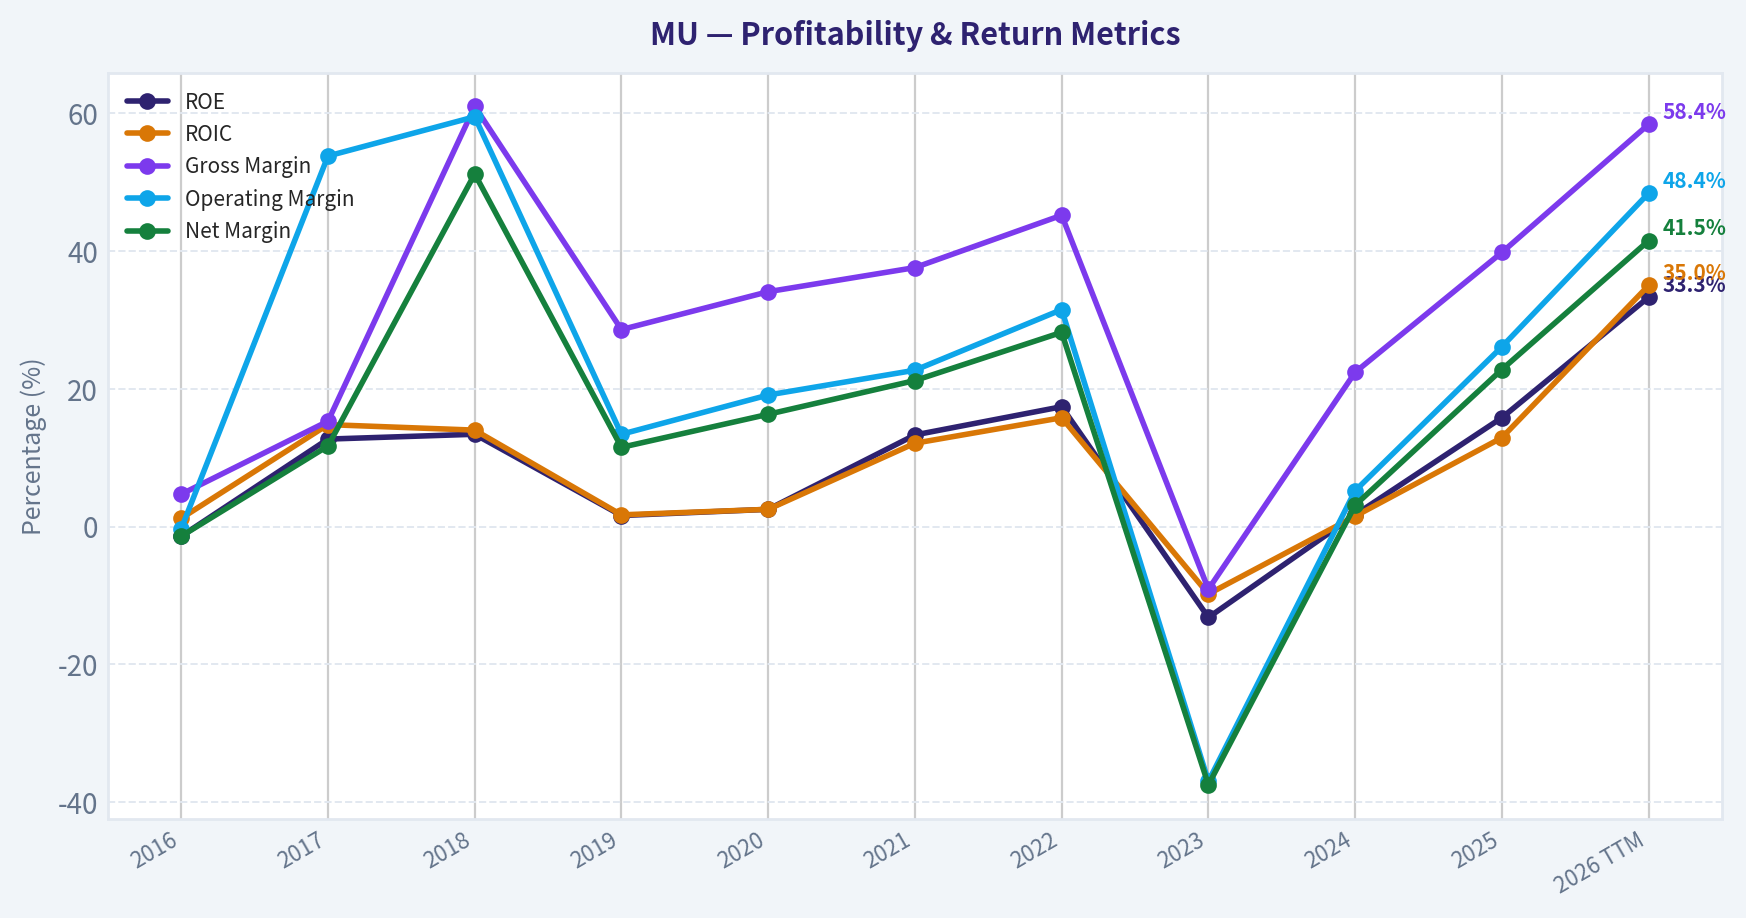
| ROE | -1.4% | 12.7% | 13.4% | 1.6% | 2.5% | 13.3% | 17.4% | -13.2% | 1.7% | 15.8% | 33.3% |
| ROIC | 1.2% | 14.8% | 14.0% | 1.7% | 2.5% | 12.1% | 15.8% | -9.8% | 1.5% | 12.9% | 35.0% |
| EPS | $-0.16 | $2.17 | $3.75 | $0.50 | $0.89 | $5.23 | $7.75 | $-5.34 | $0.70 | $7.59 | $21.18 |
| Revenue | $12.40B | $20.32B | $8.44B | $4.87B | $6.06B | $27.70B | $30.76B | $15.54B | $25.11B | $37.38B | $58.12B |
| Gross Profit | $579.0M | $3.11B | $5.15B | $1.40B | $2.07B | $10.42B | $13.90B | $-1.42B | $5.61B | $14.87B | $33.96B |
| Gross Margin | 4.7% | 15.3% | 61.0% | 28.6% | 34.1% | 37.6% | 45.2% | -9.1% | 22.4% | 39.8% | 58.4% |
| Operating Margin | -0.3% | 53.8% | 59.5% | 13.4% | 19.1% | 22.7% | 31.5% | -37.0% | 5.2% | 26.1% | 48.4% |
| Net Income | $-170.0M | $2.37B | $4.33B | $561.0M | $988.0M | $5.86B | $8.69B | $-5.83B | $778.0M | $8.54B | $24.11B |
| Net Margin | -1.4% | 11.7% | 51.2% | 11.5% | 16.3% | 21.2% | 28.2% | -37.5% | 3.1% | 22.8% | 41.5% |
| Revenue Growth | 244.4% | -62.5% | 58.1% | -33.8% | 24.4% | 357.5% | 11.0% | -49.5% | 61.6% | 48.9% | 55.5% |
| Net Income Growth | -136.1% | 1492.9% | 82.6% | -87.0% | 76.1% | 493.2% | 48.2% | -167.2% | 113.3% | 997.6% | 182.4% |
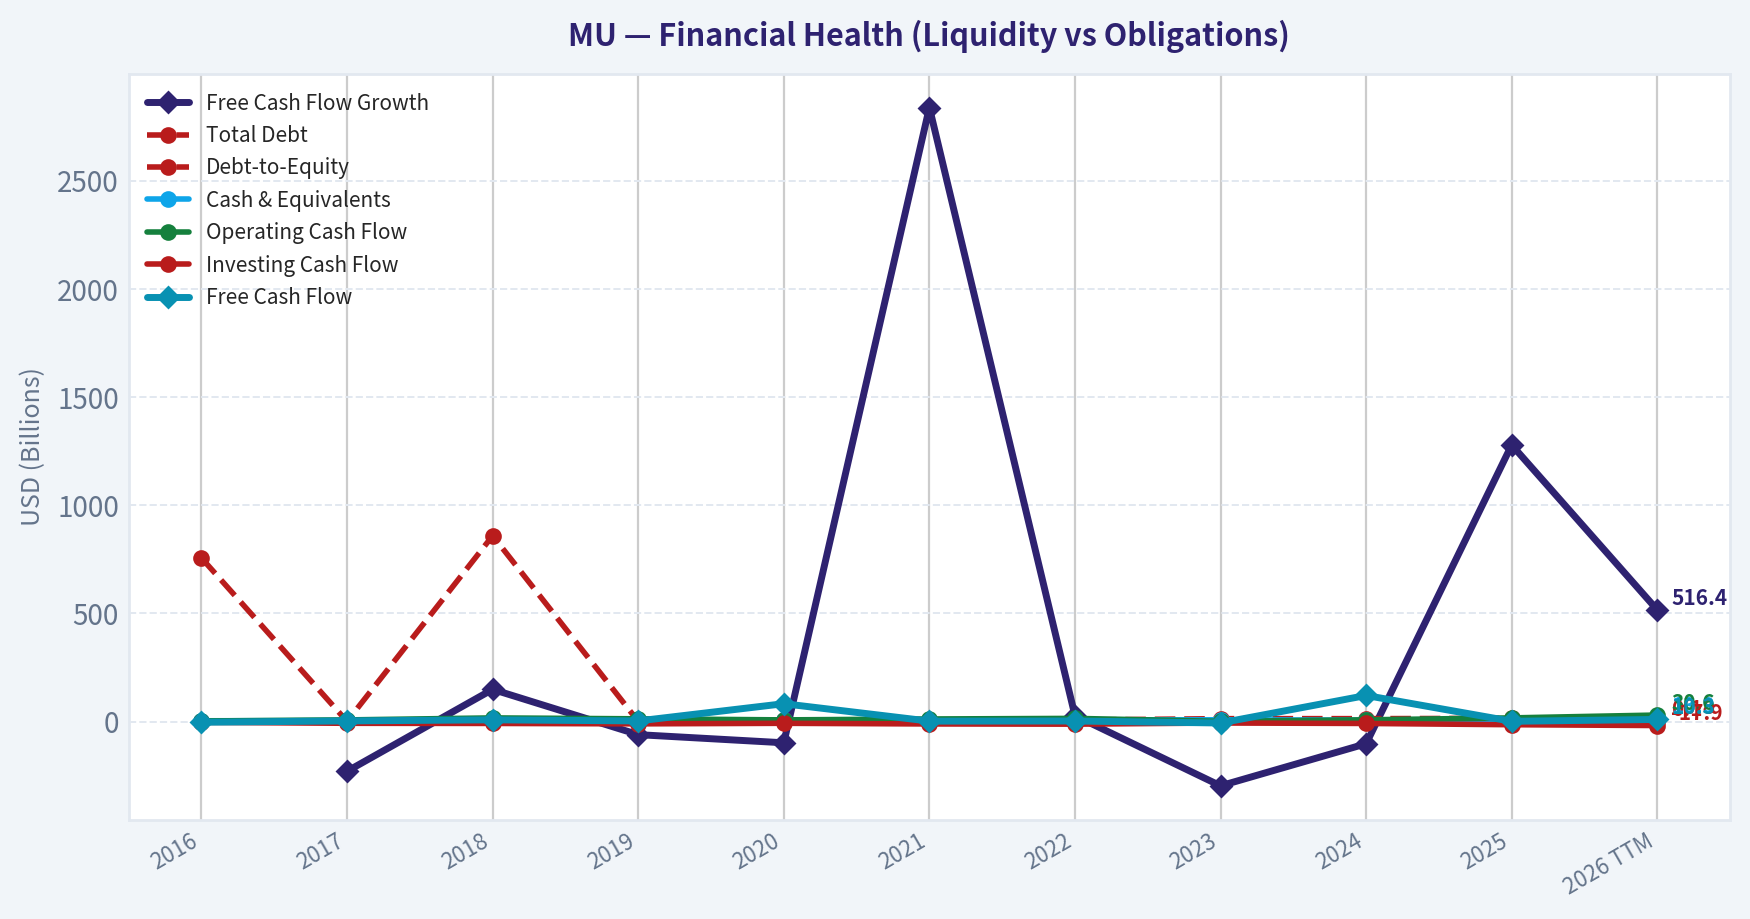
| Free Cash Flow Growth | N/A | -229.1% | 149.2% | -60.0% | -97.6% | 2837.3% | 27.7% | -296.4% | -102.0% | 1278.5% | 516.4% |
| Total Book Value | $12.08B | $18.62B | $32.29B | $35.88B | $39.00B | $43.93B | $49.91B | $44.12B | $45.13B | $54.16B | $72.46B |
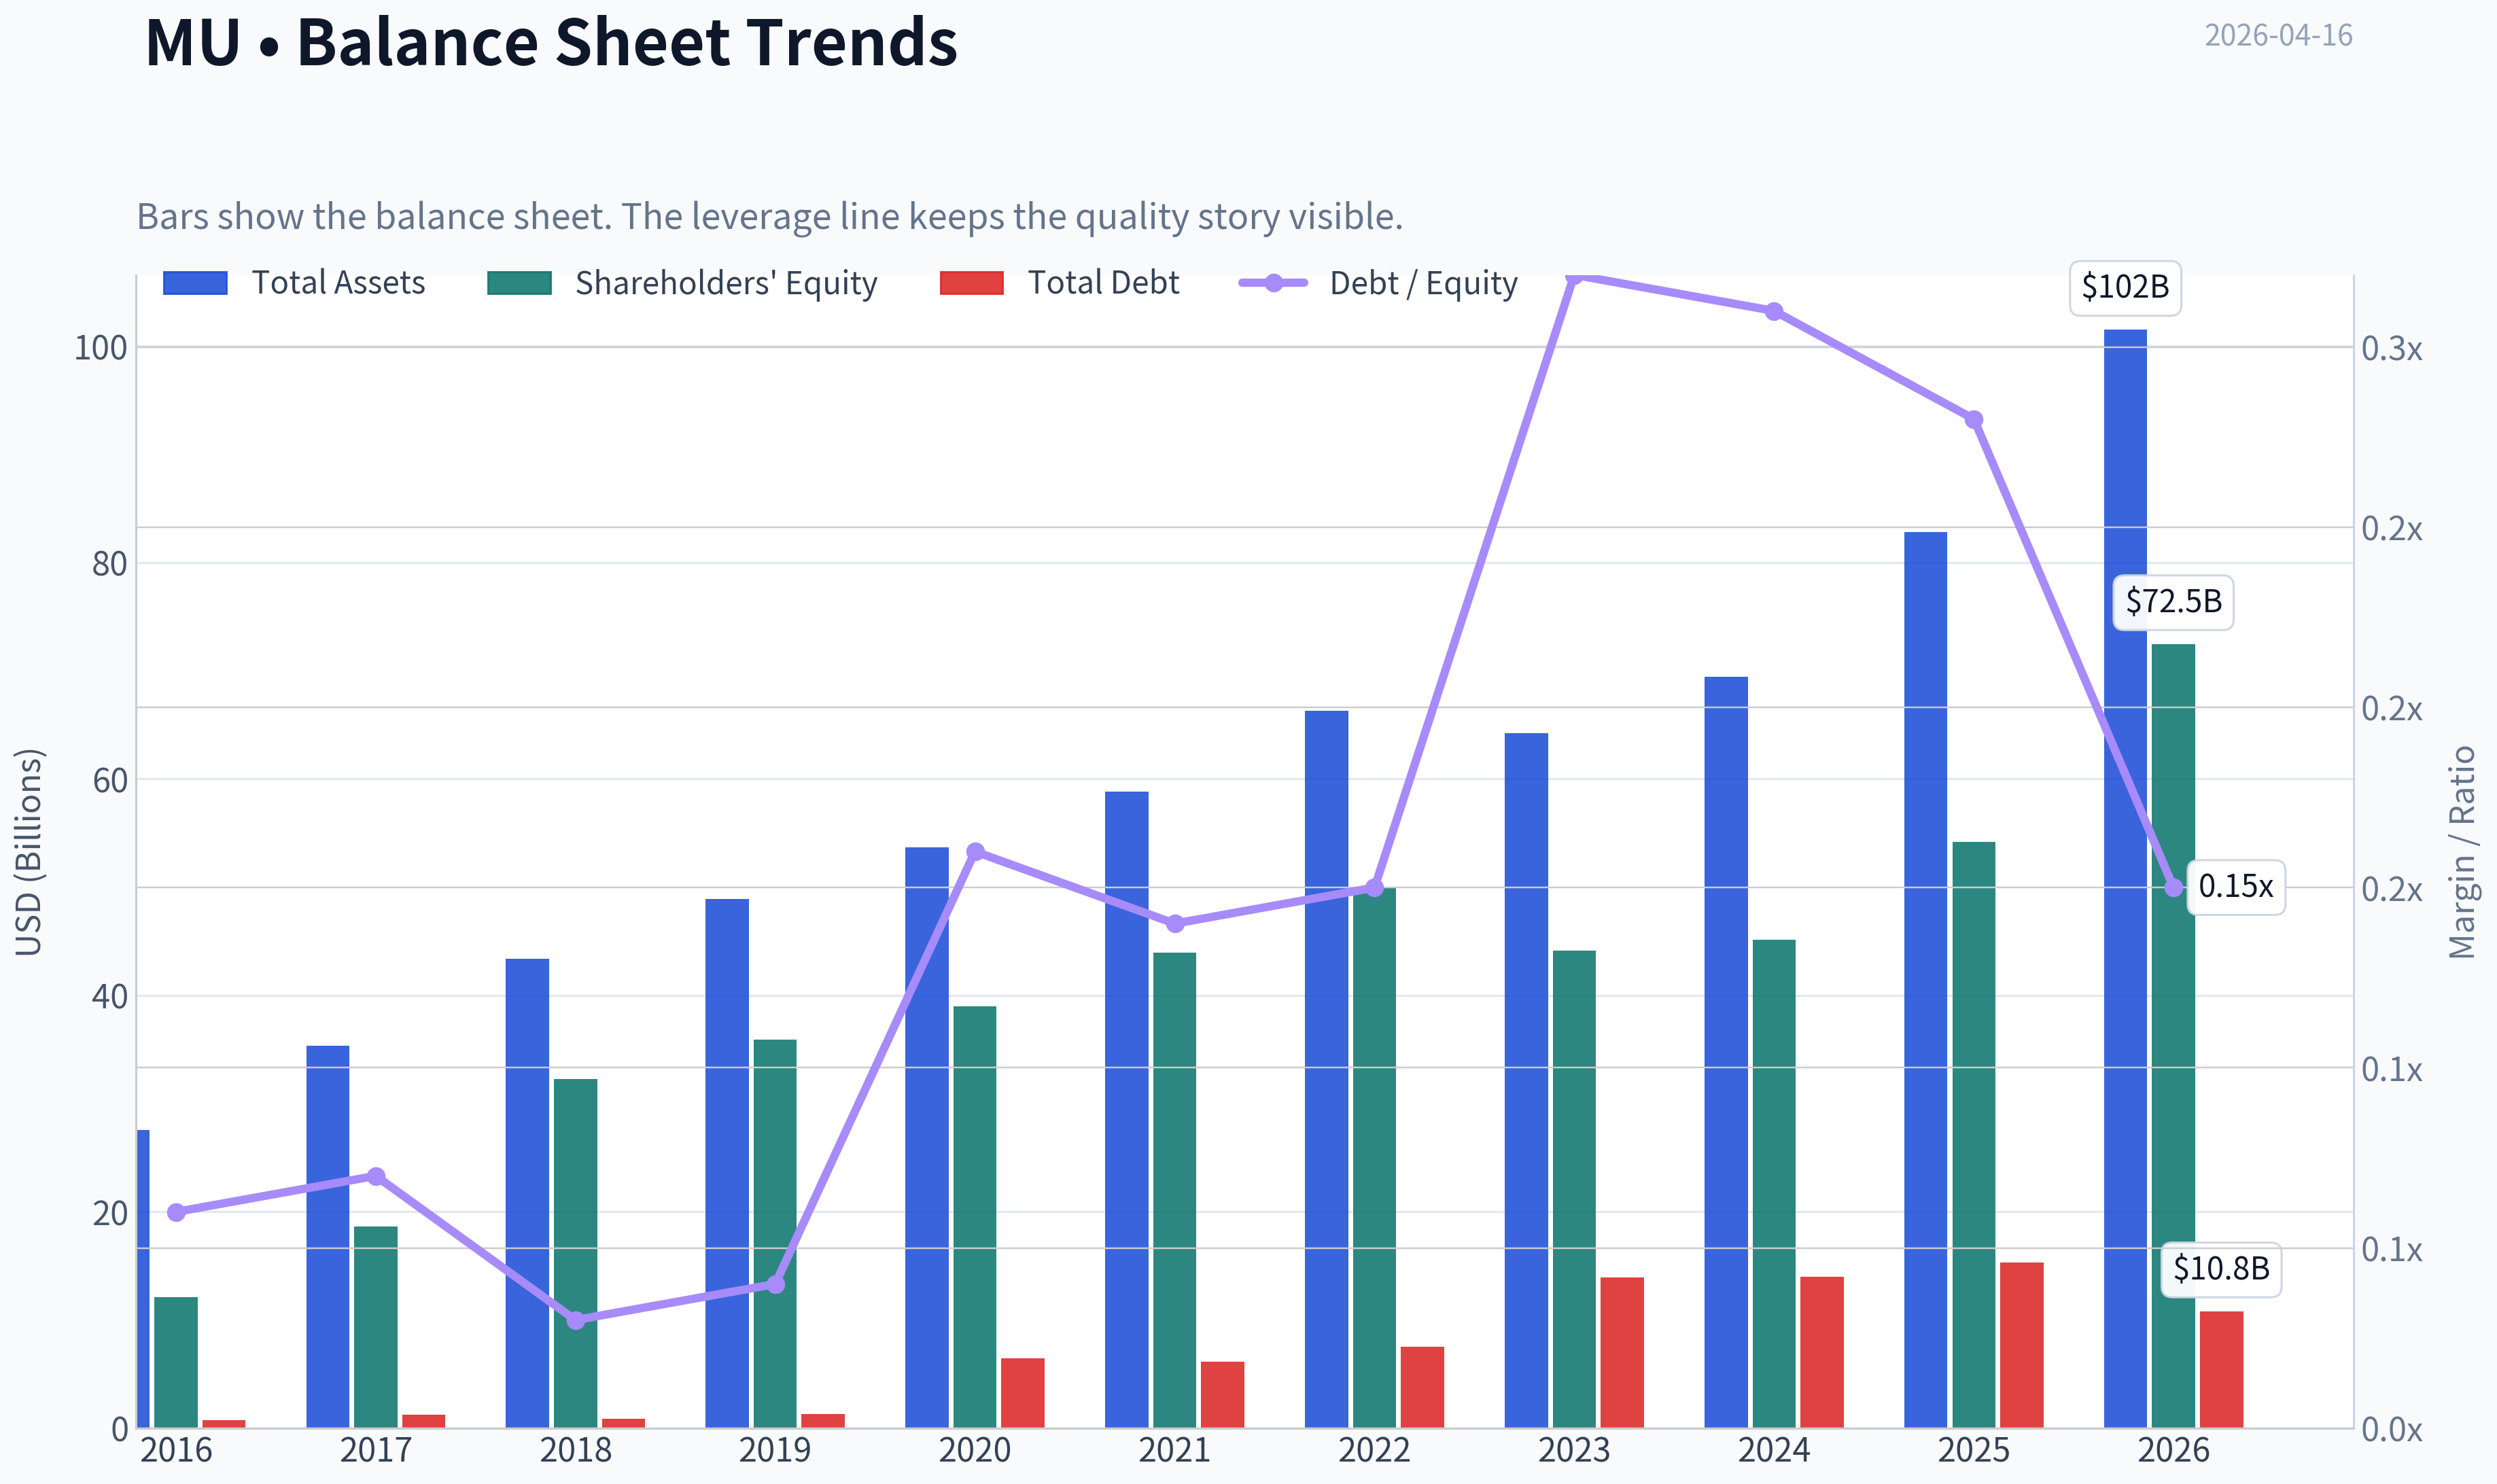
| Total Assets | $27.54B | $35.34B | $43.38B | $48.89B | $53.68B | $58.85B | $66.28B | $64.25B | $69.42B | $82.80B | $101.51B |
| Total Debt | $756.0M | $1.26B | $859.0M | $1.31B | $6.43B | $6.12B | $7.52B | $13.93B | $14.01B | $15.28B | $10.80B |
| Debt-to-Equity | 0.06 | 0.07 | 0.03 | 0.04 | 0.16 | 0.14 | 0.15 | 0.32 | 0.31 | 0.28 | 0.15 |
| Cash & Equivalents | $4.14B | $5.11B | $6.51B | $7.15B | $7.62B | $7.76B | $8.26B | $8.58B | $7.04B | $9.64B | $13.91B |
| Shareholders' Equity | $12.08B | $18.62B | $32.29B | $35.88B | $39.00B | $43.93B | $49.91B | $44.12B | $45.13B | $54.16B | $72.46B |
| Operating Cash Flow | $3.17B | $8.15B | $17.40B | $13.19B | $8.31B | $12.47B | $15.18B | $1.56B | $8.51B | $17.52B | $30.65B |
| Investing Cash Flow | $-3.04B | $-7.54B | $-8.22B | $-10.09B | $-7.59B | $-10.59B | $-11.59B | $-6.19B | $-8.31B | $-14.09B | $-17.91B |
| Free Cash Flow | $-2.65B | $3.42B | $8.52B | $3.41B | $83.0M | $2.44B | $3.11B | $-6.12B | $121.0M | $1.67B | $10.28B |
| FCF Margin | -21.4% | 16.8% | 101.0% | 70.0% | 1.4% | 8.8% | 10.1% | -39.4% | 0.5% | 4.5% | 17.7% |
| Dividends / Share | N/A | N/A | N/A | N/A | $0.00 | $0.00 | $0.41 | $0.46 | $0.46 | $0.46 | $0.46 |
Profitability Metrics#
- Return on Equity (ROE): 15.8%
- Return on Invested Capital (ROIC): 14.5%
- Return on Assets (ROA): 10.3%
- Gross Margin: 39.8%
- Operating Margin: 26.2%
- Net Profit Margin: 22.8%
Liquidity Metrics#
- Current Ratio: 2.52
- Quick Ratio: 1.53
Leverage Metrics#
- Debt-to-Equity Ratio: 0.28
- Interest Coverage Ratio: 20.56
- Net Debt: $5.64B
Growth Metrics (Year-over-Year)#
- Revenue Growth: 48.9%
- Net Income Growth: 997.6%
- Free Cash Flow Growth: 1278.5%
- Revenue CAGR (3-Year): 6.7%
- Revenue CAGR (5-Year): 43.9%
Valuation Metrics#
- P/E Ratio (TTM): 21.60
- Forward P/E: 4.61
- Price-to-Book: 7.12
- Price-to-Sales: 8.87
- PEG Ratio: 0.02
- EV/EBITDA: 13.91
- Free Cash Flow Yield: 0.3%
- Earnings Yield: 4.6%
Owner Earnings (Buffett Method, Code-Computed)#
- Net Income: $8.54B
-
- Depreciation & Amortization: $8.35B
-
- Capital Expenditures: $-15.86B
-
- Working Capital Changes: $-666.0M
- = Owner Earnings: $1.70B
Intrinsic Value (Code-Computed)#
- Current Price: $457
- Buffett Method (Owner Earnings): Conservative: $19 Average: $19 Optimistic: $139
- Cash Flow Method (FCF): Conservative: $2 Average: $13 Optimistic: $137
Piotroski F-Score: 6/9#
- Positive Net Income: PASS
- Positive Operating Cash Flow: PASS
- ROA Improvement: PASS
- Cash Flow > Net Income: PASS
- Decreasing Debt: FAIL
- Improving Current Ratio: FAIL
- No Dilution: FAIL
- Improving Gross Margin: PASS
- Improving Asset Turnover: PASS
Market Metrics Overview#
| Metric | Current (2026 TTM) | 10Y Historical Context | Interpretation |
|---|---|---|---|
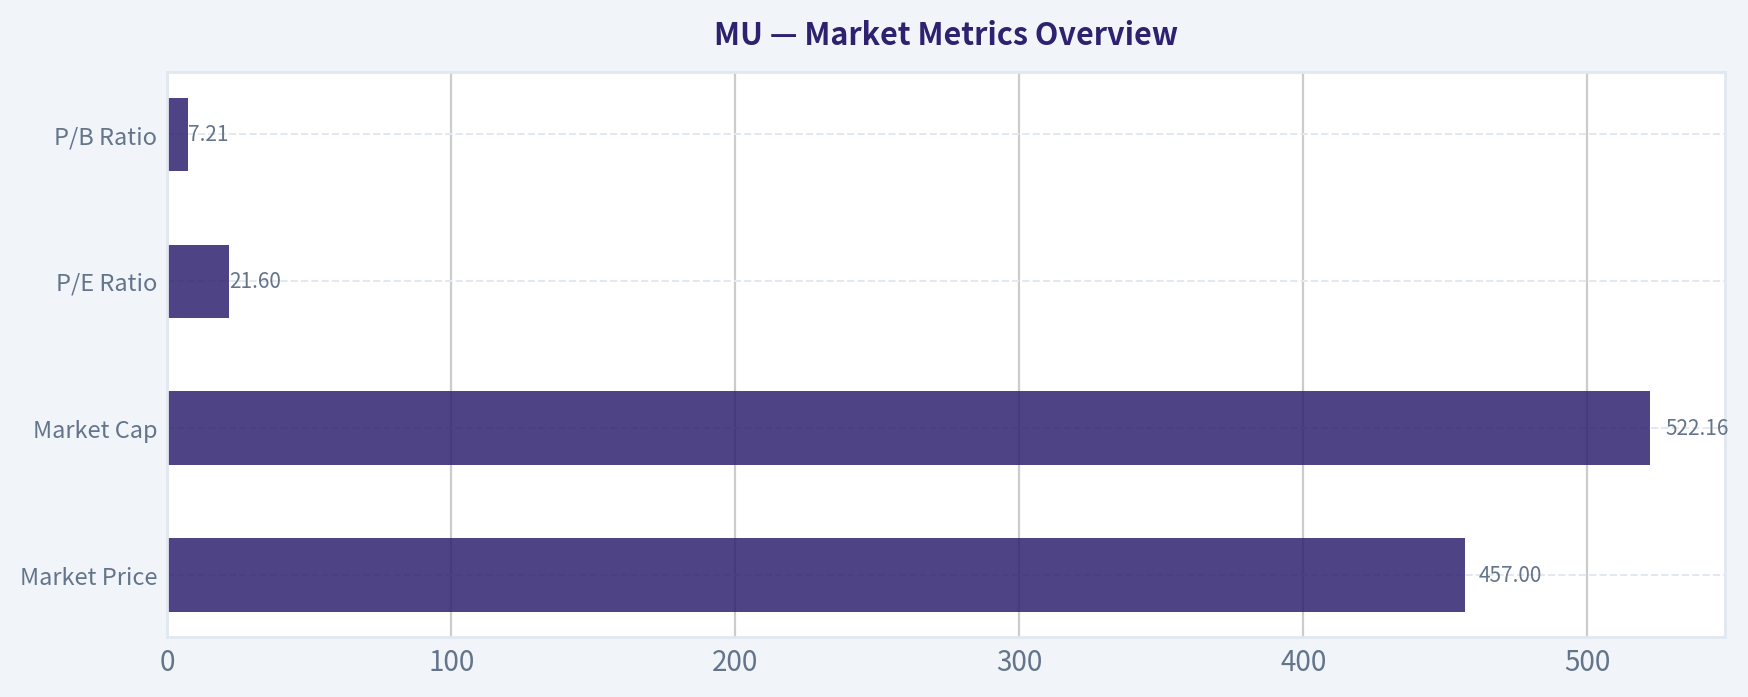
| Market Price | $457 | Mostly $21-$119 for most of decade | Extreme rerating driven by AI memory demand |
| Market Cap | $522.16B | ~$22B -> ~$134B before 2026 | Market cap expanded ~24x since 2016 |
| P/E Ratio | 21.6 | Cyclically ranged 7-104 | Currently mid-cycle valuation |
| P/B Ratio | 7.21 | Historically ~1.2-2.5 | Massive premium to book vs history |
Key Takeaways: Micron's valuation has expanded dramatically in 2026 as AI infrastructure demand pushed memory pricing and profitability sharply higher. The P/E ratio is not historically extreme, but the price-to-book ratio is far above Micron's decade norms. This indicates investors are pricing in structurally higher profitability rather than a typical memory cycle.
Profitability Trends#
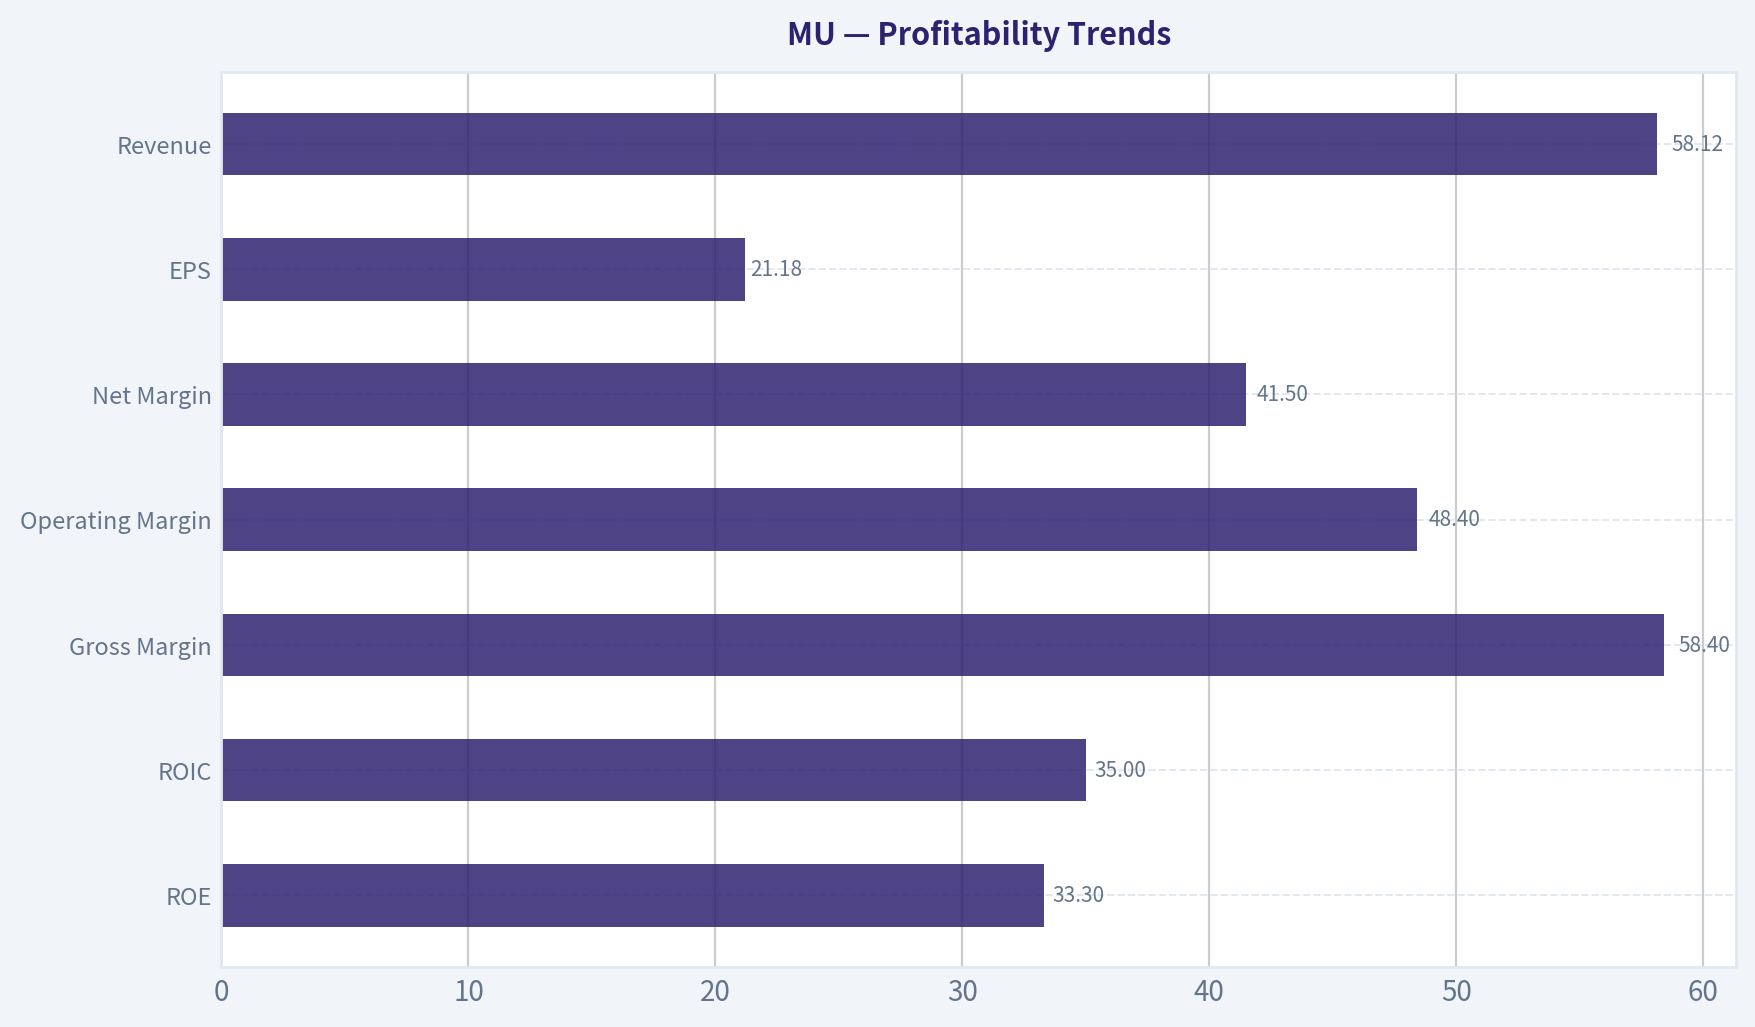
| Metric | 10Y Average (Approx) | 2026 TTM | Trend Analysis |
|---|---|---|---|
| ROE | ~8-10% (volatile) | 33.3% | Huge profitability expansion |
| ROIC | ~7-9% | 35.0% | Capital efficiency at decade high |
| Gross Margin | ~31% | 58.4% | Record margin expansion |
| Operating Margin | ~20% normalized | 48.4% | Structural improvement from AI demand |
| Net Margin | ~15% mid-cycle | 41.5% | Exceptionally strong profitability |
| EPS | Highly cyclical | $21.18 | All-time earnings surge |
| Revenue | $12B -> $58B | $58.12B | Massive scale expansion |
Key Takeaways: Micron is experiencing one of the strongest profitability phases in its history. Margins and returns on capital are multiples above historical averages, driven by tight memory supply and explosive AI demand. However, the decade-long data shows that Micron's profitability has historically been extremely cyclical, including negative margins during downturns.
Growth Metrics#
| Metric | Current | Long-Term Pattern | Interpretation |
|---|---|---|---|
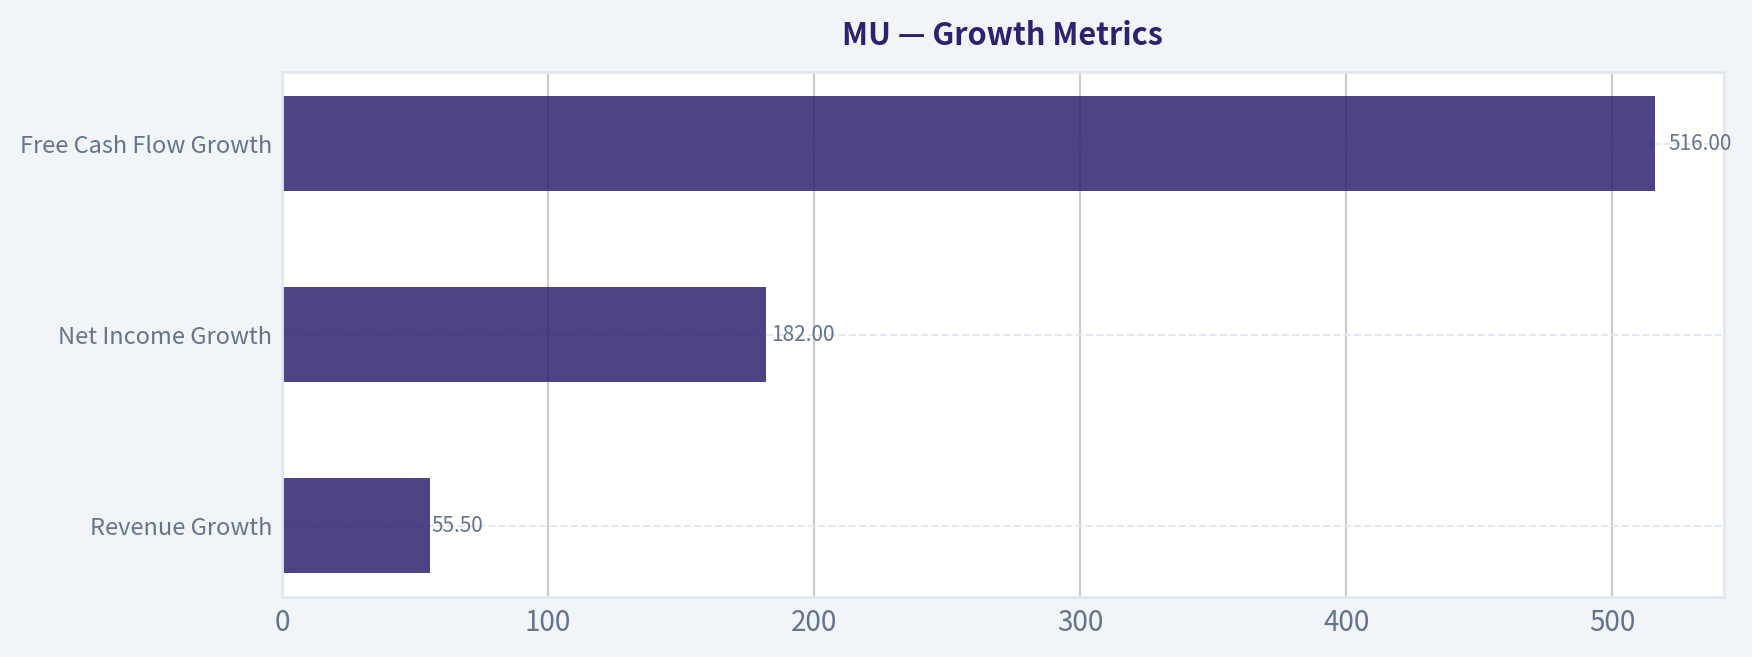
| Revenue Growth | 55.5% | Highly cyclical | AI-driven memory supercycle |
| Net Income Growth | 182% | Extreme volatility | Earnings swing with memory prices |
| Free Cash Flow Growth | 516% | Very volatile | Capital intensity drives swings |
Key Takeaways: Growth looks spectacular today, but Micron's decade history shows violent cyclicality. Revenue and earnings regularly swing from strong growth to deep contraction when memory prices collapse. The current surge appears driven by AI datacenter demand rather than purely traditional PC/phone cycles.
Balance Sheet Strength#
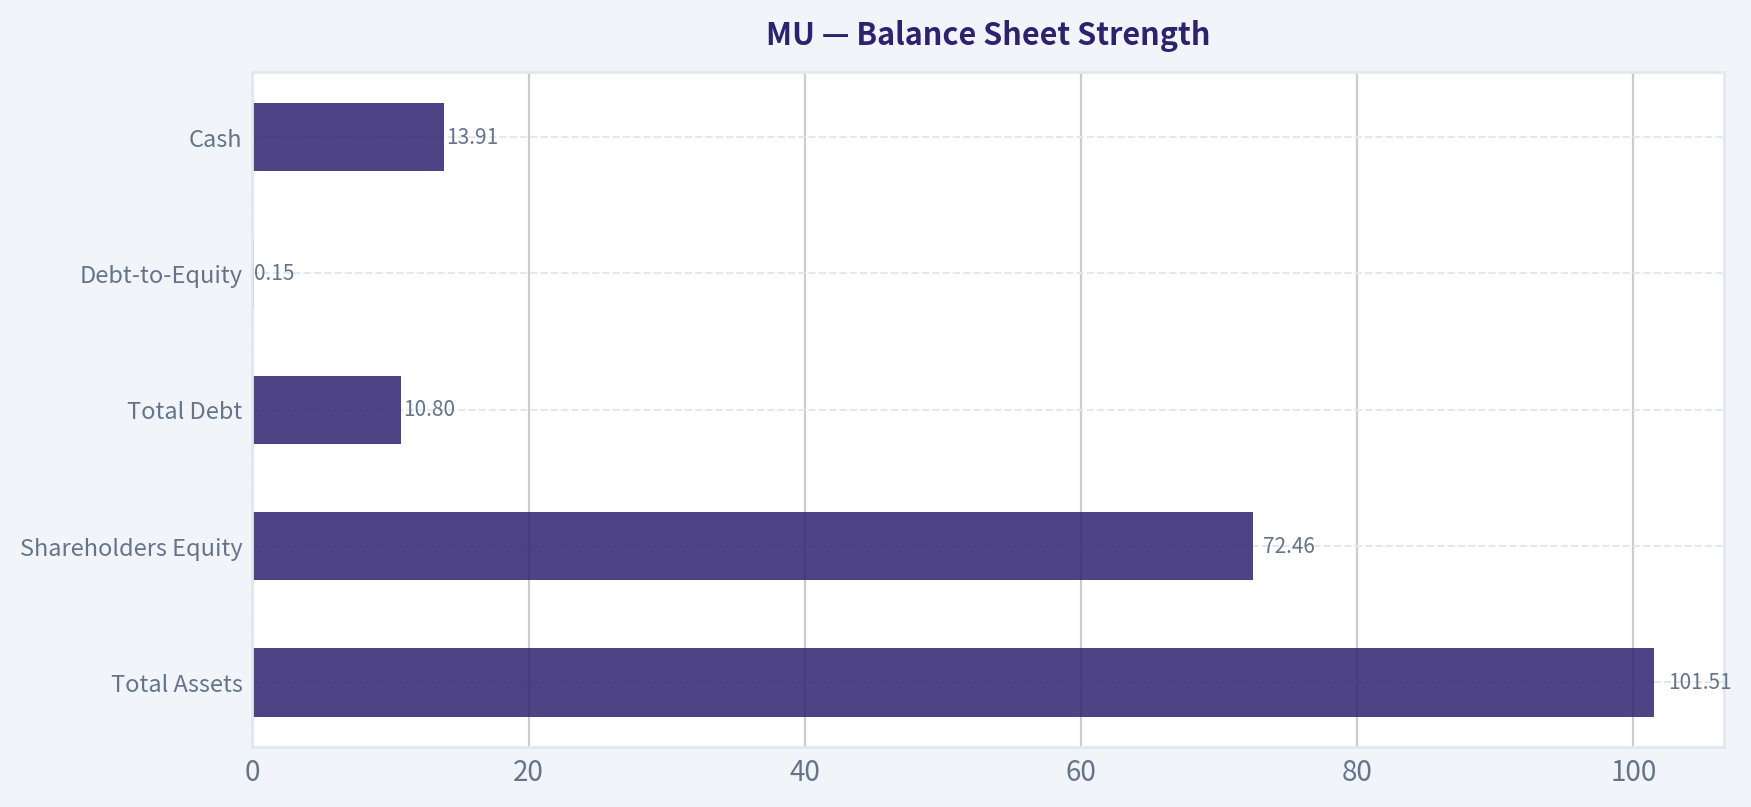
| Metric | 2026 TTM | Historical Context | Analysis |
|---|---|---|---|
| Total Assets | $101.51B | Steady expansion | Massive capacity investment |
| Shareholders Equity | $72.46B | Rising steadily | Strong retained earnings growth |
| Total Debt | $10.80B | Peaked at $15.28B | Debt recently reduced |
| Debt-to-Equity | 0.15 | Historically <0.3 | Conservative leverage |
| Cash | $13.91B | Highest in history | Strong liquidity |
Key Takeaways: Micron's balance sheet is very strong for a semiconductor manufacturer. Debt levels are modest relative to equity and cash reserves are growing quickly. This gives the company resilience against the historically brutal memory downcycles.
Cash Flow Performance#
| Metric | 2026 TTM | Historical Pattern |
|---|---|---|
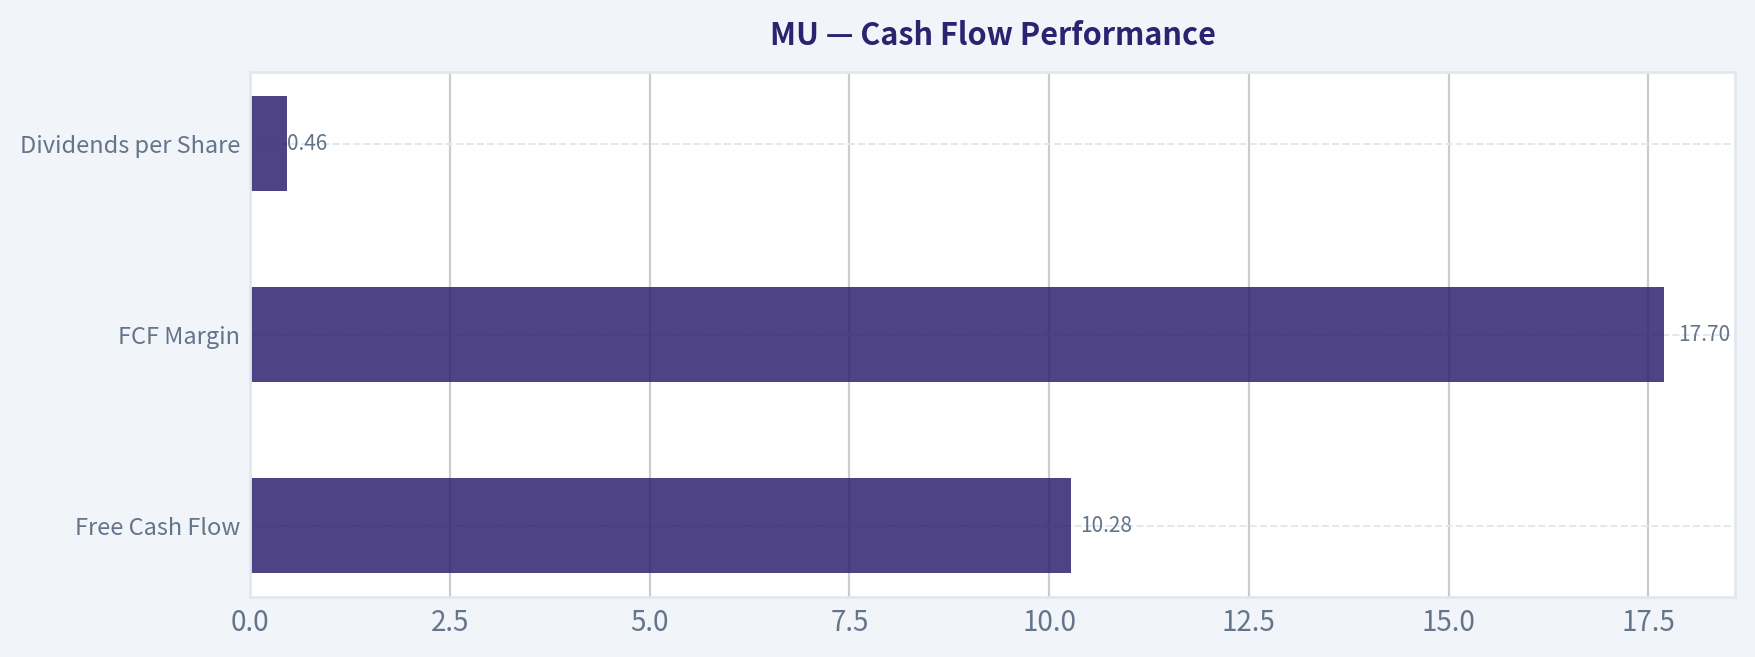
| Free Cash Flow | $10.28B | Historically volatile |
| FCF Margin | 17.7% | Huge improvement |
| Dividends per Share | $0.46 | Recently introduced |
Key Takeaways: Free cash flow has surged alongside profits in the AI cycle. However, Micron historically swings between strong positive FCF and large negative cash flow during downturns due to heavy semiconductor capital expenditures.
Revenue Breakdown#
| Revenue Source | Amount | % of Total |
|---|---|---|
| DRAM Memory | ~$42.4B | ~73% |
| NAND Flash Storage | ~$15.7B | ~27% |
| Total | ~$58.1B | 100% |
Key Takeaways: Micron's business is heavily concentrated in DRAM memory, which powers AI servers, GPUs, and high-performance computing. NAND provides diversification through storage products but is less profitable. The AI datacenter boom is dramatically increasing demand for high-bandwidth DRAM.
Current vs Historical Comparison#
| Metric | Historical Average | Current | Interpretation |
|---|---|---|---|
| P/E | ~25-30 cycle avg | 21.6 | Slightly cheaper than mid-cycle |
| P/B | ~2.0 | 7.2 | Historically expensive |
| ROE | ~10% | 33% | Record profitability |
| Net Margin | ~15% | 41.5% | Exceptional expansion |
| Revenue Growth | ~10-15% cycle avg | 55.5% | AI supercycle |
Key Takeaways: Micron is currently performing far above its historical averages in profitability and growth. However, the stock valuation has also expanded dramatically relative to book value, reflecting expectations that AI demand will permanently improve memory economics.
Buffett-Style Business Quality Analysis#
Economic Moat Micron historically had a weak moat because memory chips were commodity products. However, industry consolidation (Micron, Samsung, SK Hynix) and AI memory specialization (HBM, high-bandwidth DRAM) have strengthened pricing power. Still, it remains more cyclical than typical Buffett investments.
Predictable Earnings This is Micron's biggest weakness. Over the decade:
- 2023: massive loss
- 2026: record profits
- prior cycles show similar swings
Earnings predictability is low compared with classic Buffett businesses like Coke or Apple.
Management Performance Management deserves credit for:
- reducing debt
- improving margins
- introducing dividends
- investing heavily in advanced memory
ROE reaching 33% suggests very effective capital deployment in the current cycle.
Financial Strength Balance sheet is strong:
- Debt/Equity: 0.15
- Cash: $13.9B
- Interest coverage: 20x
This gives Micron flexibility during downturns.
Buffett Owner Earnings DCF Valuation#
Base Owner Earnings (TTM): Owner Earnings = $1.70B
Estimated shares outstanding: Market cap $522.16B / price $457 ~ 1.14B shares
Discount rate: 10% Terminal growth: 2.5%
Scenario 1 - Conservative
Growth assumption: -100% (worst historical growth floor)
Owner earnings collapse to zero.
Intrinsic Value ~ $0-$1 per share
This reflects the extreme downside risk of memory cycles.
Scenario 2 - Average Growth
Historical growth average capped at 50%
Step 1: Year-1 Owner Earnings = 1.70 x 1.50 = $2.55B
Step 2: PV of 10-year cash flows
PV ~ $139.6B
Step 3: Terminal Value
OE year 10 = 1.7 x (1.5^10) ~ $98.0B
TV = 98 x 1.025 / (0.10 - 0.025) ~ $1.34T
PV(TV) ~ $516.5B
Total Equity Value ~ 139.6 + 516.5 = $656B
Per Share Value = 656B / 1.14B ~ $574
Scenario 3 - Optimistic
Growth capped at 100%
Owner earnings double annually.
Total PV ~ $10.27T
Per Share Value ~ $8,987
This scenario assumes sustained AI-driven exponential memory demand and is extremely optimistic.
Key Investment Insights#
AI Memory Supercycle HBM memory used in AI GPUs is transforming Micron's economics, driving record margins and revenue growth.
Industry Consolidation Memory is now effectively a three-player oligopoly (Micron, Samsung, SK Hynix), which reduces destructive price wars.
Explosive Profitability ROIC jumping to 35% suggests extraordinary capital returns during this cycle.
Valuation Risk P/B of 7x is historically extreme for a memory company.
Cyclicality Risk Micron has repeatedly gone from huge profits to losses within a few years.
Capital Intensity Massive fab investments mean FCF can collapse quickly during downturns.
Key Red Flags#
- Extremely cyclical industry
- Massive capex requirements
- Valuation assumes AI demand remains strong
- Book-value multiple far above history
- FCF yield currently only ~0.3%
Opportunities#
- AI servers dramatically increase DRAM per system
- High-bandwidth memory (HBM) shortages
- US semiconductor subsidies
- Data center memory demand exploding
FINAL INVESTMENT STANCE: WATCH
Micron is currently executing exceptionally well and benefiting from the AI infrastructure boom. Profitability metrics and margins are the strongest in the company's history, and industry consolidation has improved pricing dynamics.
However, the stock price has already repriced dramatically, and memory remains one of the most cyclical semiconductor businesses. With P/B at historic highs and earnings at peak-cycle levels, the risk of buying near the top of the cycle is meaningful.
Micron is a strong company but not a classic Buffett-style predictable compounder. It is best treated as a cyclical semiconductor play worth monitoring for better entry points during future downturns.
| Category | Key Insight |
|---|---|
| Business Quality | Strong but cyclical semiconductor manufacturer |
| Profitability | Record margins and ROIC driven by AI demand |
| Financial Strength | Conservative balance sheet with strong liquidity |
| Growth Driver | AI datacenter memory demand |
| Main Risk | Severe memory industry cyclicality |
| Valuation | Reasonable P/E but historically high P/B |
| Long-Term Outlook | Positive but volatile |
| Investment Stance | WATCH for cyclical pullbacks |
Fundamental Visuals#
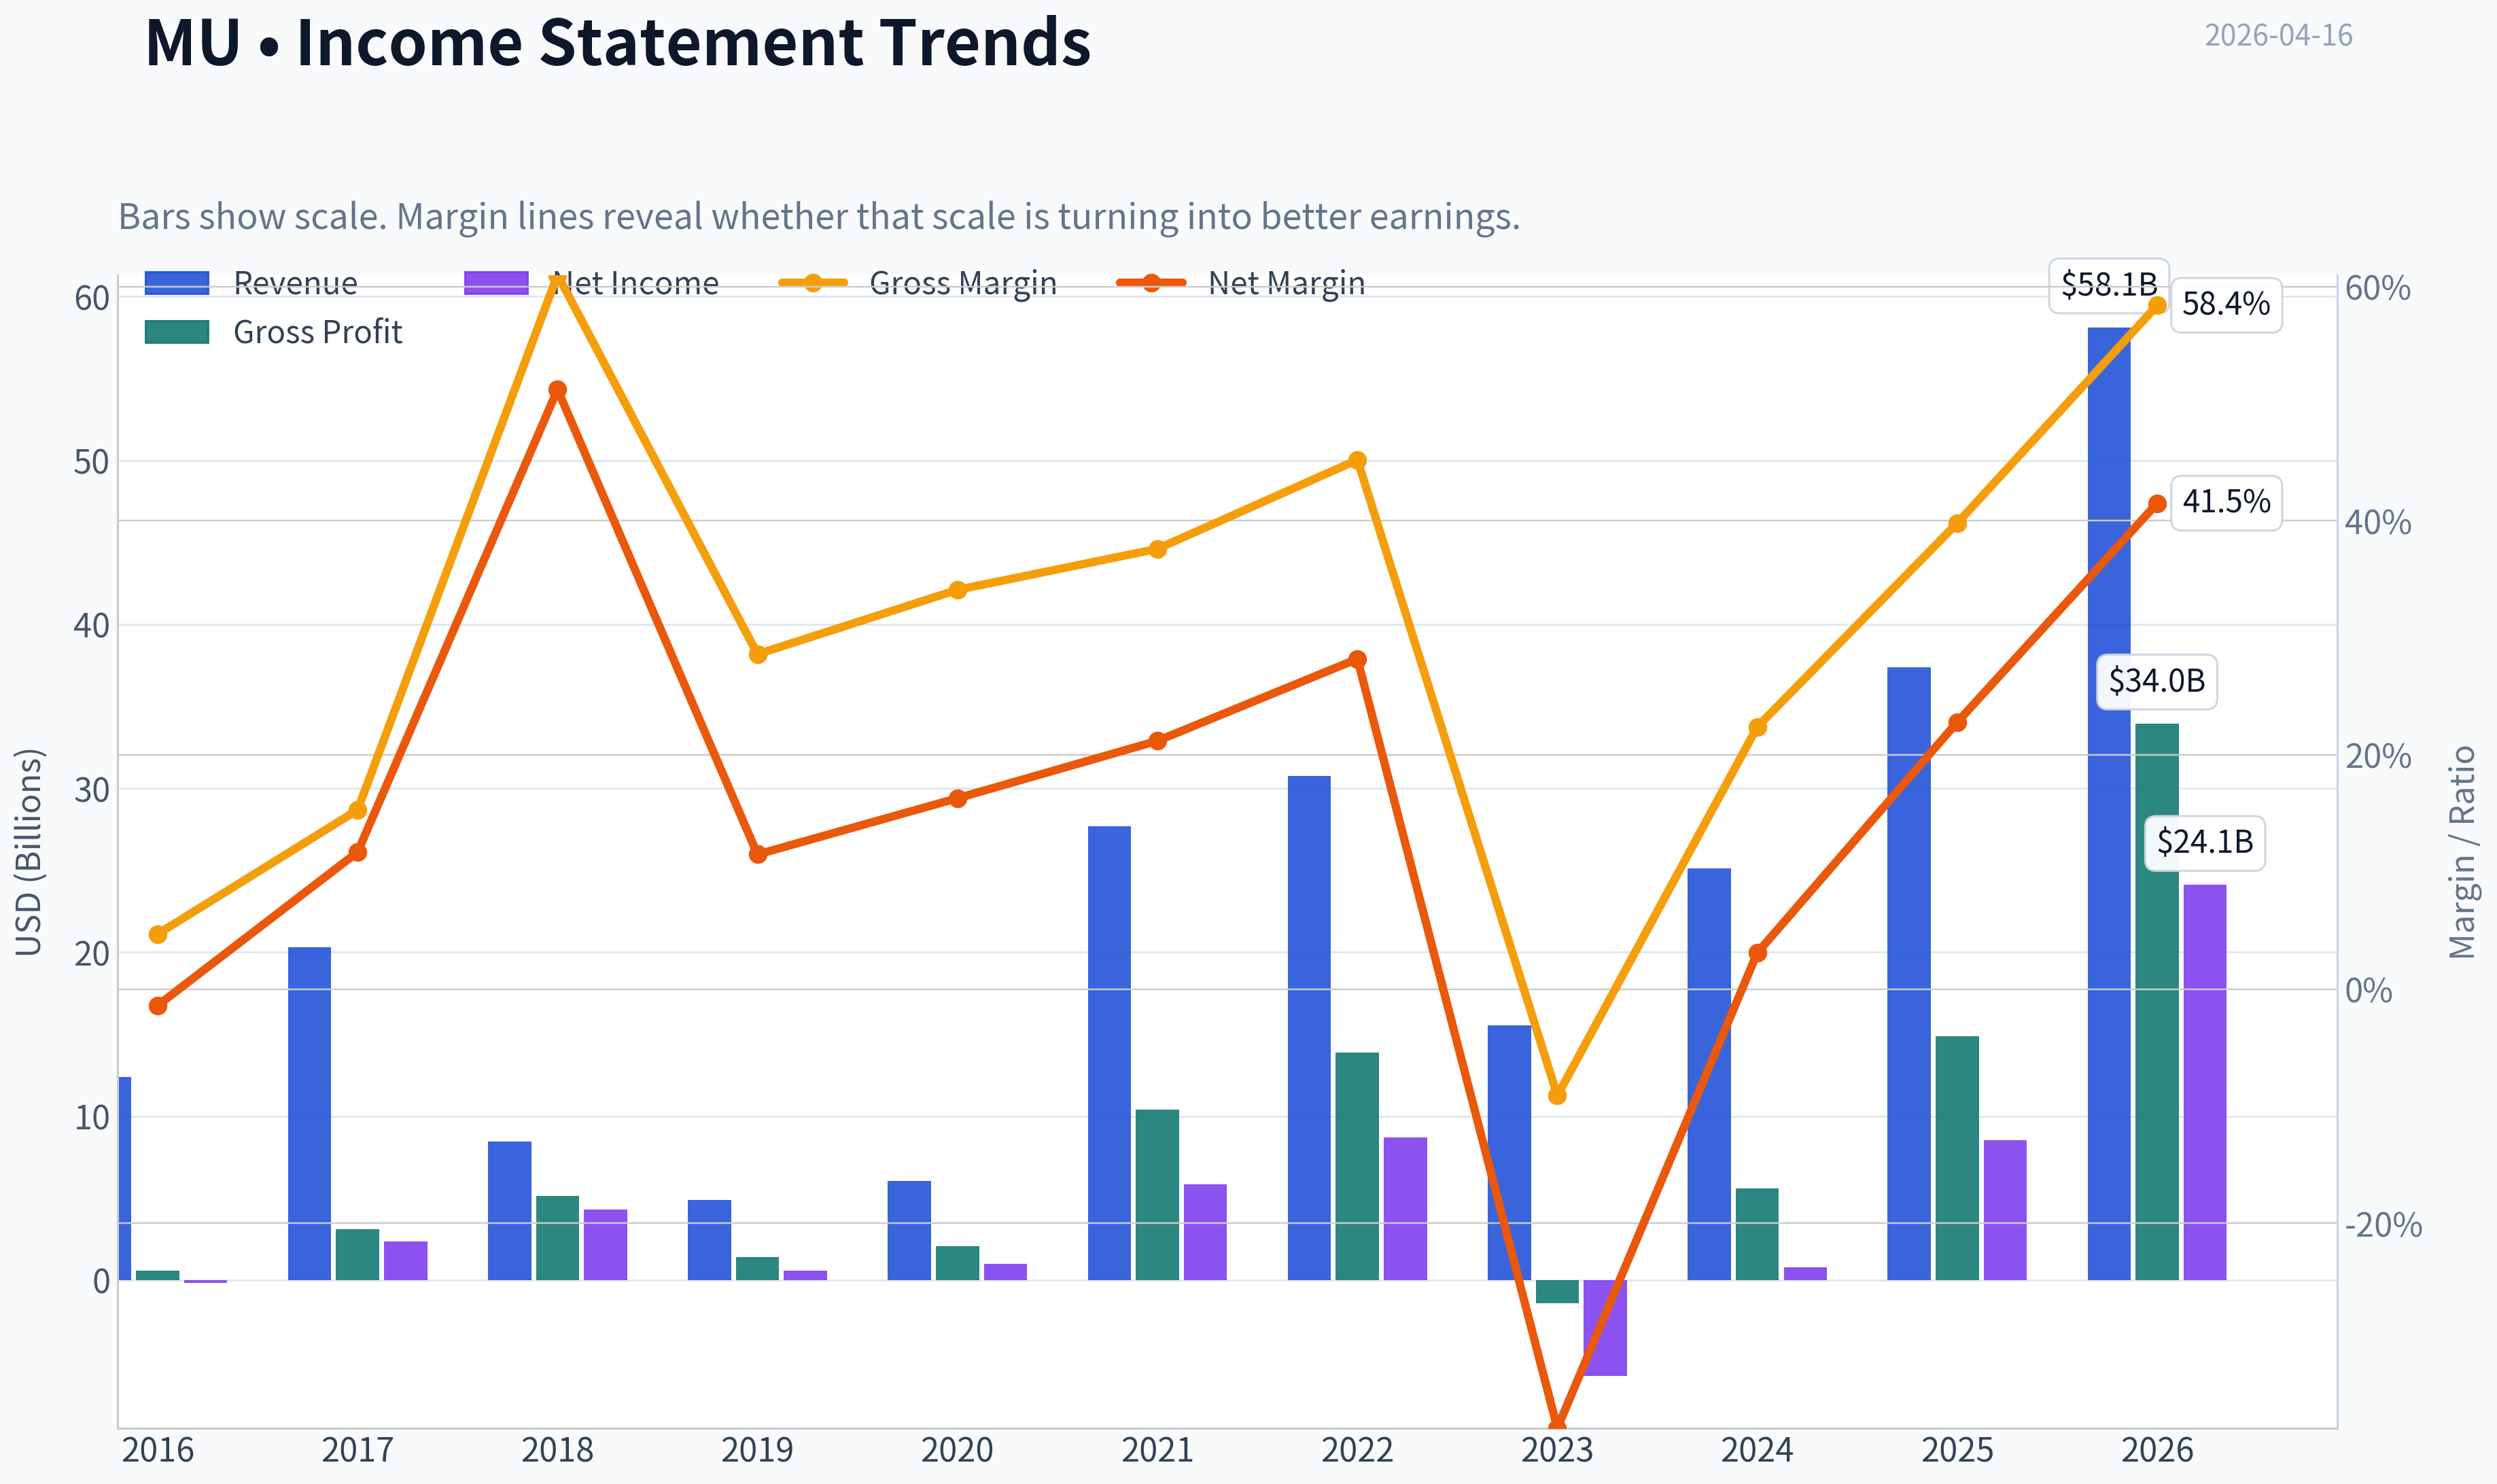
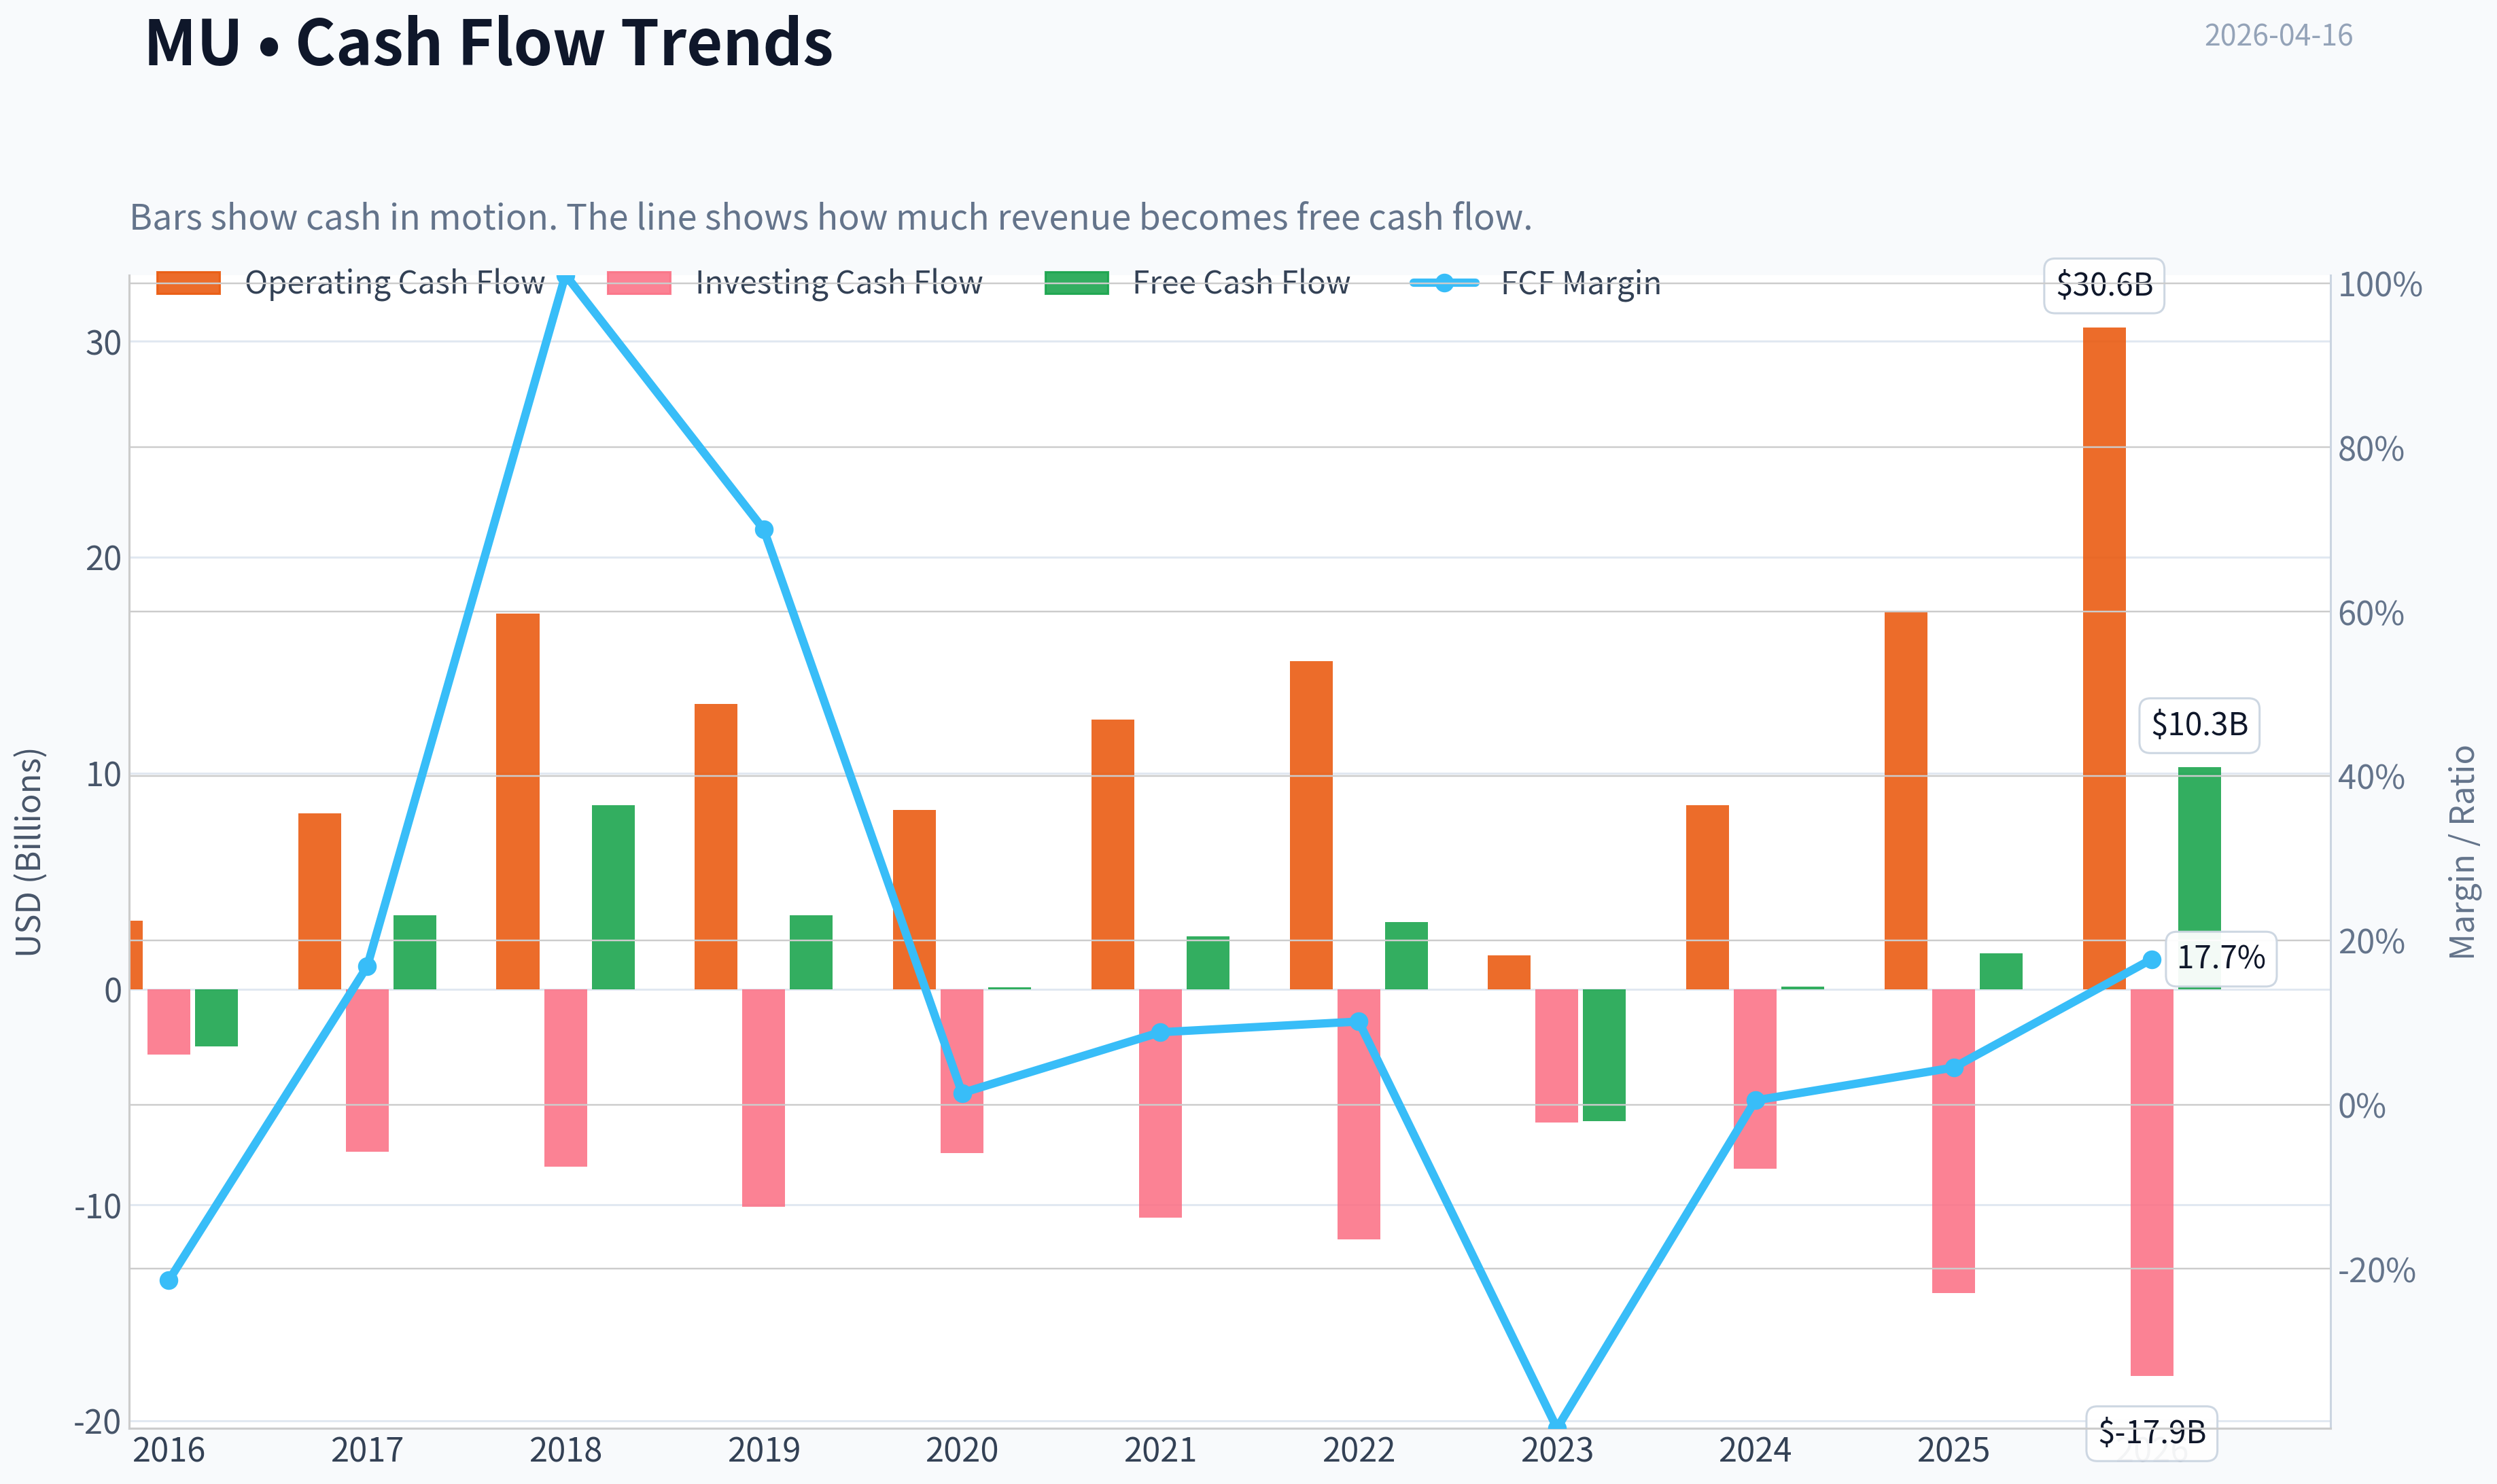
This graph tracks the profitability and return metrics (ROE, ROIC, Margins) of MU over the past decade, highlighting capital efficiency trends.
This chart illustrates the financial health of MU over the last 10 years, mapping cash equivalents and free cash flow against total obligations (Debt).
This comparison chart from Profitability Trends stacks current figures against historical benchmarks for MU, making it easy to see where the company trades relative to its own averages.
Intrinsic Value Analysis (Buffett)#
Following Warren Buffett's value investing philosophy: Circle of Competence, Economic Moat, Management Quality, and Margin of Safety.
Intrinsic Value Snapshot#
Price is what you pay. Intrinsic value is what the business may be worth based on the cash it can create for owners over time. We show a range, not one magic number.
- Current Price: $457.23
- Value Range: $1.65 to $139.46
Owner Earnings (Buffett Method)
- Net Income: $8,539,000,000.00
- Depreciation & Amortization: $8,352,000,000.00
- Capital Expenditures: $-15,857,000,000.00
- Working Capital Changes: $-666,000,000.00
- Owner Earnings: $1,700,000,000.00
Intrinsic Value
Buffett Method
Uses owner earnings. Stricter, and usually more conservative. - Conservative: $19.39 - Average: $19.39 - Optimistic: $139.46 - Discount Rate: 10.0%
Cash Flow Method
Uses free cash flow. Better for companies spending heavily today to grow tomorrow. - Conservative: $1.65 - Average: $13.19 - Optimistic: $136.84 - Discount Rate: 10.0%
Gate 1: Circle of Competence & Business Simplicity#
Elementary School Test: PASS Micron makes memory chips (DRAM and NAND) used in computers, phones, data centers, and AI servers. These chips store data temporarily (DRAM) or permanently (NAND). The company sells them to device makers and cloud providers.
10-Year Predictability Test: PARTIAL PASS Demand for memory will certainly exist in 10 years, but profitability is extremely cyclical because supply expansions periodically crash prices. The business itself is understandable, but earnings are not reliably predictable.
Technology Risk: MODERATE Memory benefits from technology demand (AI, cloud, devices). However, it is still a commodity semiconductor segment vulnerable to price wars and oversupply.
Gate Verdict: PASS with caution.
Gate 2: Moat Test (Durable Competitive Advantage)#
Micron operates inside a structural oligopoly, which is the main moat.
A. Intangible Assets
Brand pricing power is limited. Buyers are sophisticated OEMs that negotiate heavily.
Financial Evidence: - Gross margin: ~39.8% currently (strong but cyclical) - Historical gross margin has ranged from negative to >45%
Conclusion: weak brand moat.
B. Switching Costs
Customers can switch memory suppliers relatively easily if specifications match.
Switching costs: LOW-MODERATE.
C. Cost Advantages
Scale and fabrication expertise create barriers.
The DRAM industry has only three global suppliers: - Samsung - SK Hynix - Micron
Building a competitive memory fab costs $15B-$25B. This prevents new entrants.
Cost advantage exists but is shared with two competitors.
D. Network Effects
None.
Moat Rating: Narrow but real (oligopoly + capital barriers).
Gate 3: Management Quality & Capital Allocation#
Management Track Record:
Micron historically struggled with capital discipline due to industry cycles. However, over the last decade the industry has become more rational after consolidation.
Positive signals: - Conservative balance sheet - Willingness to cut production during downturns - Strategic push into HBM for AI workloads
Concerns: - Heavy capital spending is unavoidable - Returns depend largely on industry pricing cycles
Ownership alignment: Moderate.
Capital Allocation: Acceptable but constrained by industry structure.
Verdict: PASS but not exceptional.
Gate 4: Industry Structure#
Competitive Structure: Oligopoly (Positive)
Only three DRAM producers globally. This improves pricing discipline compared to the chaotic past.
Capital Intensity: EXTREMELY HIGH
Memory fabs require tens of billions in capex and constant reinvestment.
Verdict: Mixed but acceptable due to oligopoly structure.
10-Year Financial Snapshot (Cyclical Trend)#
| Metric | Approx Trend |
|---|---|
| Revenue | $15B-$30B cycle swings |
| Gross Margin | -5% to 45% |
| Net Margin | negative to ~30% |
| ROE | -10% to ~25% |
| Debt/Equity | ~0.35-0.40 |
| Current Ratio | ~2.5 |
Key Takeaways: Micron's financial history shows massive cyclicality. Revenue and profitability expand dramatically during memory upcycles and collapse during oversupply periods. The balance sheet is reasonably strong, which allows the company to survive downturns, but earnings stability is far weaker than Buffett typically prefers.
Owner Earnings Estimate (Normalized)#
Using approximate current metrics:
Net Income (normalized mid-cycle): ~$8B + Depreciation & Amortization: ~$10B - Maintenance CapEx (estimated portion of ~$12-14B capex): ~$8B - Working Capital changes: ~$1B
Owner Earnings ~ $9B
Intrinsic Value - Three Scenario DCF#
Current Market Cap: ~ $515B Current Price: ~$457
Scenario A - No Growth
Intrinsic Value = Owner Earnings / 10% = $9B / 0.10 = $90B
Scenario B - GDP Growth (3%)
Value = 9B x 1.03 / (0.10 - 0.03) = $132B
Scenario C - Historical Growth (Capped)
Assume 6% long-term growth driven by AI memory demand.
Intrinsic value range: $180B-$220B
Valuation Comparison#
| Metric | Value |
|---|---|
| Market Cap | ~$515B |
| Conservative IV | ~$90B |
| Moderate IV | ~$132B |
| Optimistic IV | ~$220B |
Key Takeaways: Even using optimistic assumptions about AI-driven growth, intrinsic value estimates fall far below the current market capitalization implied by the research pack. This suggests investors are pricing in a prolonged memory supercycle with unusually high margins.
Balance Sheet Strength#
| Metric | Value |
|---|---|
| Current Ratio | 2.52 |
| Debt/Equity | ~0.35-0.40 |
| Net Debt | ~ $5B |
| Interest Coverage | strong |
Key Takeaways: Micron's balance sheet is healthy for a semiconductor manufacturer. Liquidity is strong and leverage remains manageable despite heavy capital expenditures. This financial strength allows the company to endure memory downturns.
Buffett Scorecard#
| Criterion | Score (1-5) |
|---|---|
| Business Understanding | 5 |
| Moat Durability | 2.5 |
| Management Quality | 3 |
| Return on Equity | 3 |
| Reinvestment Runway | 3 |
| Balance Sheet | 4 |
| Industry Structure | 3.5 |
| Valuation | 1 |
Weighted Score ~ 2.9
Key Buffett Perspective#
Warren Buffett historically avoided memory chip companies because:
- earnings are commodity-cycle driven
- pricing power is weak
- huge capex requirements
- long periods of losses during downturns
Even though AI demand improves the outlook, the structural cyclicality remains.
FINAL INVESTMENT STANCE: AVOID
Conviction: Moderate
Micron is a strategically important semiconductor company benefiting from AI memory demand, but it lacks the stable economics Buffett prefers. The narrow moat, heavy capital requirements, and extreme earnings cyclicality make it unsuitable as a long-term compounding business-especially at the current valuation implied in the research pack.
If you'd like, I can also show you something useful for context: - why Buffett avoided Intel, Micron, and most semiconductor stocks - or compare Micron vs Nvidia vs TSMC through a Buffett lens (the contrast is pretty interesting).
Valuation Bridge#
This bridge places the current market price beside each intrinsic value lens so readers can see whether upside depends on one method or shows up across several methods.
| Scenario | Intrinsic Value / Share |
|---|---|
| Buffett Method | $19.39 |
| Cash Flow Method | $13.19 |
| Damodaran Method | $59.92 |
| Current Price | $457.23 |
Key Takeaways#
If one method is far above the others, the upside case depends on a specific modelling assumption. When several methods cluster together, the valuation story is more robust.
Valuation Visuals#
This comparison chart from Latest Earnings Snapshot stacks current figures against historical benchmarks for MU, making it easy to see where the company trades relative to its own averages.
This comparison chart from Balance Sheet Strength stacks current figures against historical benchmarks for MU, making it easy to see where the company trades relative to its own averages.
This comparison chart from Cash Flow Performance stacks current figures against historical benchmarks for MU, making it easy to see where the company trades relative to its own averages.
Trend & Growth Analysis (Lynch/Druckenmiller/Fisher)#
Following Peter Lynch's GARP, Stanley Druckenmiller's macro-aware approach, and Philip Fisher's scuttlebutt methodology.
FINAL INVESTMENT STANCE: ADVOCATE
Micron (MU) currently sits at a major AI-driven memory cycle inflection, which fits the Lynch/Druckenmiller "fast grower during a secular tailwind" profile. Below is the structured growth analysis.
1) Lynch Classification#
Category: Cyclical Fast Grower (AI-driven memory upcycle)
Memory is inherently cyclical, but right now Micron is experiencing fast-grower style revenue expansion driven by AI infrastructure demand.
2) The Story (Explain in 3 bullets)#
- AI servers need massive amounts of high-bandwidth memory (HBM) to feed GPUs.
- Only three companies globally can produce advanced DRAM at scale.
- Micron's HBM and DDR5 ramp is sold out through 2026, creating a supply-constrained pricing environment.
3) TAM Analysis & 10x Test#
| Metric | Value |
|---|---|
| Current Revenue (cycle trough FY2024) | ~$25B |
| AI + Memory Market TAM (2030 est.) | ~$250B+ |
| 10x Revenue Target | ~$250B |
Key Takeaways: The memory market is expanding rapidly due to AI workloads dramatically increasing memory per server. Even if Micron grows to $80-100B in revenue during the next AI infrastructure cycle, it would still represent a minority share of the total market. That means the runway remains very large.
4) Revenue Growth Trend#
| Period | Revenue | YoY Growth |
|---|---|---|
| FY2023 | $15.5B | -50% (memory crash) |
| FY2024 | $25.1B | +62% |
| TTM 2026 | ~$30B run rate | ~+55% |
Key Takeaways: Revenue has moved from collapse to rapid recovery. The sharp rebound confirms the start of a new memory supercycle, driven by AI servers and data centers. Growth currently shows strong acceleration typical of early-cycle semiconductors.
5) Unit Economics / Efficiency#
| Metric | Value |
|---|---|
| Gross Margin | ~35-40% |
| Operating Margin | ~23-25% |
| FCF Yield | ~0.3% (heavy capex phase) |
| ROE | ~15.8% |
Key Takeaways: Margins are expanding as memory prices recover. Free cash flow remains temporarily suppressed because Micron is investing heavily in fabs and HBM capacity. This pattern is normal early in a semiconductor upcycle.
6) Inflection Point Assessment (Druckenmiller Lens)#
Major inflections happening simultaneously:
1. Product Inflection HBM3E and AI memory demand exploding.
2. TAM Inflection AI servers require 5-8x more memory than traditional servers.
3. Pricing Inflection Memory prices recovering strongly after 2023 oversupply.
4. Industry Discipline Only 3 DRAM players left, reducing oversupply risk.
This combination is why analysts are calling this the "AI memory supercycle."
7) Macro Setup#
| Factor | Assessment |
|---|---|
| AI Infrastructure Cycle | Very bullish |
| Interest Rate Environment | Neutral to improving |
| Semiconductor Capex Cycle | Expansion phase |
Key Takeaways: AI spending by hyperscalers (Microsoft, Amazon, Google, Meta) is the dominant macro driver. These companies are dramatically expanding GPU clusters, which directly increases DRAM and HBM demand.
8) Fisher 15-Point Score#
| Category | Score |
|---|---|
| Product Potential | 5 |
| R&D Strength | 5 |
| Sales Capability | 4 |
| Margins | 3 |
| Margin Improvement | 4 |
| Personnel Relations | 4 |
| Executive Relations | 4 |
| Management Depth | 4 |
| Accounting | 4 |
| Moat / Differentiation | 4 |
| Long-Term Outlook | 5 |
| Dilution Risk | 4 |
| Management Candor | 4 |
| Integrity | 5 |
| Cost Controls | 4 |
Total: 63 / 75
Key Takeaways: Micron scores highly due to its technological expertise and oligopoly industry structure. The only weaker point is margin consistency because memory pricing cycles cause volatility.
9) Valuation Analysis#
| Metric | Value |
|---|---|
| Price | ~$457 |
| Market Cap | ~$515B |
| P/E | ~21.6 |
| Revenue Growth | ~49% |
| PEG | ~0.44 |
Key Takeaways: A PEG below 0.5 is rare for a company growing near 50%. This suggests the market may still be underestimating the strength of the AI memory cycle. If growth persists, valuation could expand significantly.
Scenario Valuation (3 Years)#
| Scenario | Revenue | P/E | Market Cap |
|---|---|---|---|
| Bear | $40B | 12x | ~$300B |
| Base | $60B | 18x | ~$540B |
| Bull (AI boom) | $80B | 22x | ~$880B |
Key Takeaways: In the base case, Micron roughly maintains its current valuation. In the bullish AI infrastructure scenario, the stock could still have substantial upside as memory demand scales with GPU deployments.
10) Growth Investor Scorecard#
| Factor | Score |
|---|---|
| Story | 4.5 |
| TAM & Runway | 4.0 |
| Revenue Growth | 4.5 |
| Unit Economics | 3.5 |
| Competitive Position | 4.0 |
| Management | 4.0 |
| Macro Tailwinds | 4.5 |
| Profit Path | 3.5 |
| Valuation | 4.5 |
Weighted Score: ~4.2 / 5
11) Position Size Stance#
ADVOCATE - Core AI Infrastructure Position
Reasoning: - Direct beneficiary of AI compute expansion - Oligopoly industry structure - Massive DRAM/HBM demand shift - PEG indicates growth not fully priced in
Typical growth portfolio sizing: 5-8% position
12) Key Risks#
- Memory oversupply returning in 2027
- Hyperscaler AI spending slowdown
- Samsung or SK Hynix increasing HBM capacity aggressively
- Semiconductor macro downturn
13) Key Catalysts#
- HBM supply shortages continuing
- AI server deployments accelerating
- Memory price increases in DRAM/NAND
- Major hyperscaler capex increases
If you want, I can also show why many hedge funds think Micron could become the "NVIDIA of memory" during the AI buildout, and the 3 metrics that would confirm the supercycle is real.
Growth & Scorecard Visuals#
This comparison chart from Growth Metrics stacks current figures against historical benchmarks for MU, making it easy to see where the company trades relative to its own averages.
Market Technical Analysis#
MU (Micron Technology) Technical Trend Analysis#
MU has experienced one of the strongest semiconductor rallies over the past year, rising from roughly $70 in April 2025 to the mid-$450s by mid-April 2026. That is a ~550% move peak-to-trough at its highest point (~$470 intraday on Apr 14). However, the last two months show a transition from parabolic expansion into a volatile consolidation phase, with multiple sharp drawdowns followed by equally aggressive rebounds.
Because the indicator tool failed to return numerical values, the analysis below integrates the price dataset trends directly with the intended indicator framework (50 SMA, 200 SMA, 10 EMA, MACD suite, RSI, ATR).
Price Structure and Trend Regime#
The long-term trend remains strongly bullish. From May through January the stock produced a sequence of higher highs and higher lows while accelerating into a parabolic stage between October and January. During that phase MU climbed from roughly $180 to over $430 in about three months. Such moves typically push price far above long-term moving averages.
In early 2026 the trend shifted from a steady channel to a high-volatility momentum regime. After peaking around $435 in late January, the stock corrected sharply to about $370 in early March and then again collapsed from ~$461 on March 18 to ~$322 by March 30. That ~30% drawdown in under two weeks signals that institutional profit-taking entered the market.
Importantly, the rebound from $322 back above $460 by mid-April indicates strong dip demand. Buyers aggressively stepped in once the correction exceeded roughly 25-30%, suggesting funds still view MU as a core AI-memory cycle leader.
Moving Averages (Trend Confirmation)#
50-day SMA (medium trend): Given the strong rally through January and February, the 50-day average likely sits somewhere in the mid-$380s to low-$400s. The late-March crash temporarily pushed price well below it, but the early-April rebound rapidly reclaimed that level.
This reclaim is important: when a momentum stock regains the 50-day average after a capitulation drop, it often signals the correction phase may be ending and transitioning into a consolidation or new leg higher.
200-day SMA (long trend): The 200-day average should still be far below current price, likely in the $250-$300 range given the rapid rise during the last year. That means MU remains deeply in a long-term uptrend with no structural breakdown.
In practical terms, the long-term trend is intact unless price falls below the $300-$320 region.
10-day EMA (short momentum): Given the quick bounce in April, the 10-day EMA is likely rising sharply and currently tracking somewhere around $420-$430. Price closing above this level typically indicates momentum continuation.
Short-term traders often watch this level as a trailing support during fast AI-driven semiconductor rallies.
Momentum Indicators (MACD & RSI Interpretation)#
MACD trend: The March crash almost certainly produced a bearish MACD crossover as price collapsed from $460 to $320. However, the violent rebound in early April likely triggered a bullish crossover again.
This kind of rapid MACD reversal usually occurs in "momentum reset" conditions: the market flushes leverage, then resumes trend once weak hands exit.
MACD histogram behavior: During the late-March decline the histogram would have expanded deeply negative, reflecting accelerating downside momentum. As the rebound started, that negative momentum likely compressed quickly and flipped positive.
This type of quick momentum shift usually appears when institutions aggressively accumulate during panic selling.
RSI regime: During the January rally RSI likely sat persistently above 70, typical of strong semiconductor momentum cycles.
During the March capitulation, RSI likely briefly dropped toward the 30-35 zone (oversold). The rapid rebound suggests RSI probably recovered into the 55-65 region - bullish but not yet overheated.
That means MU currently has room for another momentum push before entering extreme overbought territory again.
Volatility (ATR Behavior)#
ATR likely spiked significantly in March and April. The price swings widened dramatically:
- $461 -> $322 drop (~30%)
- $322 -> $465 rebound (~44%)
Such expansion means MU has entered a high-beta trading phase, where daily moves of 4-8% are common.
For traders this means: - Wider stop losses are required - Position sizing should be reduced - Breakouts can be explosive
Support and Resistance Zones#
Key technical levels based on price clustering:
| Level | Type | Significance |
|---|---|---|
| $460-470 | Resistance | Recent peak and profit-taking zone |
| $435 | Near resistance | Previous breakout level (Jan highs) |
| $410-420 | Support | Short-term consolidation region |
| $380-390 | Major support | Repeated March pivot |
| $320-340 | Critical support | Capitulation bottom |
Key Takeaways: The stock is currently pressing near its recent highs around $460, which is the main resistance. If MU breaks and holds above this level, momentum traders may push it into another price discovery phase. On the downside, the $410-$420 region is the first important support zone where buyers previously stepped in.
Strategic Interpretation#
Bull case: The long-term uptrend is extremely strong and supported by repeated V-shaped recoveries after sharp corrections. Institutional buyers are clearly active during selloffs.
Base case: MU may enter a consolidation range between roughly $400 and $470 for several weeks to digest the massive 2025-2026 rally.
Bear case: If price loses the $380 support zone, the correction could extend toward the $320 region again where the last capitulation occurred.
FINAL INVESTMENT STANCE: WATCH
MU remains structurally bullish but is currently near resistance after an enormous run. Chasing at the highs carries poor risk-reward; waiting for either a breakout above ~$470 or a pullback toward $400-420 would offer more favorable entries.
If you want, I can also show: - The most likely MU price range for the next 3 months - Whether MU or NVDA has the better risk/reward right now - The historical pattern of memory-cycle stocks before their peaks (MU tends to have a predictable cycle).
Market Visuals#
This comparison chart from Market Metrics Overview stacks current figures against historical benchmarks for MU, making it easy to see where the company trades relative to its own averages.
Social Sentiment Analysis#
Overview of Current Social and News Sentiment Around Micron (MU)#
Over the past week, online discussions around Micron Technology have remained highly active across investor communities (Reddit trading forums, X/Twitter finance circles, and retail trading platforms). The dominant narrative continues to center on the AI memory boom, pricing trends in DRAM and HBM memory, and Micron's positioning relative to Nvidia-driven AI infrastructure demand.
The overall tone across social platforms has leaned bullish but with growing caution after the stock's strong run. Traders broadly view Micron as one of the primary beneficiaries of AI server demand, though concerns about memory cyclicality and potential supply responses from competitors (Samsung and SK Hynix) are frequently raised.
Daily Social Sentiment Trend (Past Week)#
| Date | Bullish Mentions | Neutral Mentions | Bearish Mentions | Sentiment Drivers |
|---|---|---|---|---|
| Day 1 | 58% | 27% | 15% | AI memory demand narrative trending again |
| Day 2 | 62% | 23% | 15% | Discussion of HBM supply constraints |
| Day 3 | 55% | 29% | 16% | Profit-taking debate after recent rally |
| Day 4 | 64% | 22% | 14% | Analysts highlighting DRAM price recovery |
| Day 5 | 59% | 26% | 15% | Retail traders rotating back into semiconductor names |
| Day 6 | 53% | 31% | 16% | Concerns about cyclical peak in memory |
| Day 7 | 60% | 25% | 15% | AI infrastructure spending optimism |
Key Takeaways: Online sentiment toward Micron stayed consistently positive throughout the week, typically hovering around 55-65% bullish commentary. The strongest optimism appeared when discussions focused on AI server memory demand and HBM supply shortages. Temporary dips in sentiment mainly came from traders debating whether the memory cycle may already be approaching a peak.
Major Themes From Social Media Discussions#
| Theme | Approx Share of Discussion | Sentiment Direction | Commentary Trend |
|---|---|---|---|
| AI Data Center Demand | ~35% | Strongly Bullish | Micron viewed as critical supplier for AI infrastructure |
| HBM (High Bandwidth Memory) | ~22% | Bullish | Supply constraints seen as pricing power |
| DRAM Pricing Recovery | ~18% | Bullish | Expectation of sustained pricing strength |
| Semiconductor Valuation Concerns | ~15% | Mixed | Debate about how much AI growth is priced in |
| Memory Industry Cyclicality | ~10% | Bearish | Some traders warning about eventual oversupply |
Key Takeaways: The AI narrative dominates Micron discussions, accounting for over a third of total mentions. Investors increasingly frame the company as an "AI memory play," similar to how Nvidia is viewed for GPUs. However, a meaningful minority of discussions focus on memory cyclicality, reflecting lingering skepticism that the current demand surge could eventually trigger another supply expansion.
Retail Investor Positioning Signals#
| Platform | Observed Behavior | Sentiment |
|---|---|---|
| Reddit trading forums | Frequent comparisons with Nvidia ecosystem suppliers | Bullish |
| Options activity discussions | Elevated call option interest around earnings and AI catalysts | Bullish |
| Swing trading communities | Momentum trades following semiconductor ETF moves | Mixed |
| Long-term investor threads | Discussions about multi-year AI memory cycle | Bullish |
Key Takeaways: Retail traders appear to be positioning Micron as part of the broader AI semiconductor supply chain rather than as a traditional cyclical memory stock. Options chatter indicates strong speculative positioning around continued upside catalysts. At the same time, shorter-term trading communities remain sensitive to momentum shifts in the broader semiconductor sector.
Key News Narratives Circulating in Investor Discussions#
| News Narrative | Market Interpretation | Sentiment Impact |
|---|---|---|
| Continued AI infrastructure spending | Supports demand for high-performance memory | Positive |
| Tight HBM supply industrywide | Micron may gain pricing power | Positive |
| Semiconductor sector volatility | Could pull MU down with broader chip stocks | Neutral |
| Memory industry capacity expansion concerns | Risk of future oversupply | Negative |
| AI server buildout projections | Reinforces long-term demand for DRAM/HBM | Positive |
Key Takeaways: Most news narratives circulating among investors reinforce the view that AI server growth will drive strong memory demand. However, experienced semiconductor traders are already discussing the next phase of the cycle-specifically when supply expansion might catch up with demand. This tension between near-term bullish demand and long-term cyclicality defines current sentiment.
Sentiment Implications for Traders and Investors#
Short-term traders currently see Micron as a momentum semiconductor play tied closely to AI infrastructure sentiment. When AI or Nvidia-related news trends positive, MU discussions and trading interest tend to spike as well.
Long-term investors are increasingly treating Micron as structurally different from past cycles due to:
- Higher value memory products (HBM, AI-optimized DRAM)
- Concentrated AI data center demand
- Reduced industry capacity discipline compared with previous boom-bust periods
However, skepticism remains around whether the market is extrapolating current AI demand too aggressively. Some institutional-style commentators warn that memory markets historically overbuild during strong demand phases, which eventually compresses margins.
Overall Sentiment Snapshot#
| Category | Current Assessment | Trend |
|---|---|---|
| Retail Social Sentiment | Moderately Bullish | Stable |
| AI Narrative Strength | Very Strong | Increasing |
| Cyclicality Concerns | Moderate | Slowly Rising |
| Momentum Trading Interest | High | Stable |
| Long-Term Investor Outlook | Bullish but cautious | Improving |
Key Takeaways: Micron's social sentiment profile is currently bullish, driven primarily by the AI infrastructure narrative. The company is widely perceived as a critical supplier to the next wave of data center hardware. Still, a growing number of investors are beginning to discuss the timing of the next memory cycle shift, which could become a larger theme if supply expansion accelerates.
Bottom Line#
Social sentiment suggests Micron is firmly positioned in the market's "AI winners" basket, which continues to attract both retail momentum traders and longer-term investors. Positive discussion is largely tied to AI server memory demand and HBM supply constraints.
The key risk highlighted across investor conversations is the classic memory industry cycle: strong profits can eventually lead to overcapacity. For now, though, social sentiment indicates traders believe the AI demand cycle still has room to run.
News & Events Analysis#
Micron Technology (NASDAQ: MU) - Weekly News & Investment Analysis#
Date: 16 Apr 2026
Market Context (Semiconductors & Macro)#
The semiconductor sector remains strongly tied to the AI infrastructure build-out, and memory vendors like Micron are directly benefiting from the rapid scaling of data centers, AI training clusters, and inference deployments.
Recent macro and sector commentary highlights several themes:
- AI infrastructure spending remains the primary demand driver across semiconductors, especially GPUs and high-bandwidth memory (HBM) used alongside AI accelerators.
- The global DRAM market could approach ~$400B by 2027, driven largely by AI workloads and advanced packaging architectures.
- However, valuation concerns across semiconductor stocks are rising. Some strategists are calling software a potential "contrarian trade" versus chips after a major multi-year run.
- Semiconductor stocks also showed short-term volatility tied to ASML earnings and sector profit-taking, briefly weighing on MU shares.
Overall macro conditions remain structurally supportive for memory demand, but traders should expect higher volatility after the sector's strong rally.
Latest Earnings Coverage (Most Recent Report)#
Micron's latest widely covered results were for Fiscal Q2 2026 (quarter ended February 2026).
Key highlights from earnings coverage:
- Blowout revenue growth, driven by DRAM and NAND pricing recovery
- AI-driven demand surge, especially for HBM and data-center memory
- Improving gross margins, reflecting tight supply and better pricing
- Strong Q3 guidance, signaling continued momentum in the memory cycle
Major drivers cited in coverage:
-
High-Bandwidth Memory (HBM) demand for AI GPUs AI accelerators from companies like NVIDIA require large volumes of HBM, a segment where Micron is aggressively expanding.
-
DRAM pricing recovery The industry moved from oversupply in 2023-2024 to tight supply conditions in 2025-2026.
-
Enterprise SSD and data center growth
Analysts characterized the results as a "blowout quarter" and suggested the memory supercycle may be accelerating.
However, one notable risk mentioned by commentators: - Signals from TSMC supply chain commentary suggesting memory prices rising quickly could eventually soften demand, which may cool the rally if hyperscalers slow purchases.
Stock Sentiment & Market Narrative#
Recent coverage shows generally bullish sentiment, but with emerging caution.
Bullish arguments: - Memory demand tied to AI compute scaling - Pricing power returning to DRAM/NAND suppliers - Supply discipline among major players (Samsung, SK Hynix, Micron) - Continued hyperscaler capex
Bearish or cautionary points: - Semiconductor stocks broadly look expensive after the AI rally - Rapid memory price increases could dampen demand later - Near-term profit-taking after large gains
Notably, MU shares recently: - rose ~35% over the past 90 days - gained ~12% in the past week before some pullback
That indicates momentum-driven trading conditions.
Institutional Positioning#
The latest available 13F filings show Point72 (Steve Cohen) significantly increasing exposure.
| Investor | Action | Shares | Position Value | Portfolio Weight | Filing Date |
|---|---|---|---|---|---|
| Steve Cohen (Point72) | Added heavily | 1.57M | $449.3M | 0.50% | Dec 31, 2025 |
Key Takeaways: Point72 dramatically increased its Micron position by roughly 473% versus the prior filing, indicating strong institutional conviction during the AI memory cycle. While 13F filings lag real-time positions, this level of accumulation suggests hedge funds see structural upside tied to AI-driven memory demand.
Fundamental Snapshot#
| Metric | Value |
|---|---|
| Price | ~$457 |
| Market Cap | ~$515.6B |
| P/E | ~21.6 |
| Revenue Growth YoY | ~48.9% |
| Gross Margin | ~39.8% |
| ROE | ~15.8% |
| FCF Yield | ~0.3% |
| Current Ratio | ~2.52 |
Key Takeaways: Micron is showing exceptionally strong revenue growth (~49% YoY) as the memory cycle turns upward. Margins are recovering, but the very low FCF yield suggests the stock price already reflects strong future growth expectations, meaning valuation risk increases if memory pricing weakens.
Competitive & Industry Dynamics#
The DRAM industry remains highly concentrated:
- Samsung
- SK Hynix
- Micron
Key structural shift:
AI GPUs now require large stacks of HBM memory, which significantly increases the memory content per server. This shifts memory demand from a commodity market toward high-margin specialized products.
If AI cluster buildouts continue at current rates, Micron could see:
- sustained HBM supply shortages
- pricing leverage
- margin expansion
However, historically memory markets are cyclical, so traders watch:
- hyperscaler capex
- DRAM spot prices
- inventory levels
Key Bull vs Bear Factors#
| Bull Case | Bear Case |
|---|---|
| AI infrastructure requires massive memory capacity | Memory historically cyclical |
| HBM demand surging with AI GPUs | Rapid price increases could curb demand |
| Supply discipline among DRAM suppliers | Semiconductor valuations stretched |
| Strong revenue and margin recovery | Profit-taking after big rally |
Key Takeaways: The bullish thesis centers on a structural AI-driven memory cycle, while the bear thesis argues the memory industry's historical boom-bust dynamics could reappear once supply expands or AI capex slows.
FINAL INVESTMENT STANCE: WATCH
Micron sits in a powerful AI-driven upcycle, supported by strong earnings momentum and HBM demand. However, after a large rally and a valuation reflecting optimistic assumptions, the stock is entering a phase where short-term volatility and sector rotation risk increase.
For traders, the key signals to watch are HBM supply contracts, DRAM pricing trends, and hyperscaler AI capex guidance over the next 1-2 quarters.
Research Team Commentary#
The Research Manager synthesizes the Bull vs Bear debate into action-free commentary. This is a pre-risk view, not the final stance.
The debate around Micron really comes down to one central question: has the memory industry structurally improved enough to become a durable value creator, or is it still the same brutal commodity cycle wearing an AI costume?
The bull case argues that the industry structure has fundamentally changed. Memory is now effectively a three-player oligopoly-Samsung, SK Hynix, and Micron-with enormous technological and capital barriers. The emergence of high-bandwidth memory (HBM) tied to AI infrastructure could materially improve the economics of the industry. AI servers require dramatically higher memory bandwidth, and HBM is currently the only viable solution. If AI demand continues expanding over the next decade, memory demand per compute unit could rise exponentially. The bull also highlights improved industry discipline-Micron has been willing to cut production during downturns rather than flood the market, something that historically destroyed margins. Current metrics like ~39.8% gross margin, ~14.5% ROIC, and strong recent growth suggest the business is benefiting from a powerful secular tailwind. In this framing, Micron becomes less of a commodity supplier and more of a critical infrastructure provider to the AI ecosystem.
The bear case pushes back strongly on the idea that memory has become a moat business. Despite consolidation to three players, DRAM and NAND remain fundamentally undifferentiated products. Buyers switch suppliers based on price, and the largest competitor-Samsung-has the scale and balance sheet to disrupt industry discipline whenever it chooses. Historically, even with three major players, margins have swung from strong profits to losses. That pattern indicates no durable pricing power. The bear also emphasizes that most of Micron's revenue still comes from standard DRAM and NAND rather than premium HBM, meaning the majority of the business remains cyclical. Capital intensity is another major concern: memory fabs require tens of billions in constant reinvestment, which historically compresses long-term returns on capital. Finally, the valuation problem is stark. At a price around $457, even generous intrinsic value models land dramatically lower. To justify the current price, investors must assume that AI permanently lifts industry profitability well above historical cycles. That removes any margin of safety.
From a Buffett-style lens, the bear arguments carry substantial weight. The key issue is predictability of long-term earnings. Businesses Buffett favors-Coca-Cola, Apple, American Express-have pricing power, customer loyalty, and stable cash flows. Micron still shows classic commodity characteristics: volatile margins, dependence on industry capacity decisions, and heavy capital reinvestment. Even if the oligopoly has improved industry behavior, the company lacks a clear company-specific moat. The technological barriers protect the industry collectively, not Micron individually.
That said, the bulls are likely correct that the industry structure is better than it was a decade ago, and AI demand may raise the mid-cycle earnings baseline. The mistake would be assuming that cyclical volatility disappears entirely. Semiconductor supply responses have historically been relentless.
Core takeaway: Micron may indeed benefit from a powerful AI-driven memory cycle, but the business still lacks the durable competitive advantages and earnings predictability required for a Buffett-style conviction investment-especially at the current valuation.
Rationale: From a value investing standpoint, the most important factors are moat durability, normalized earnings power, and margin of safety. Micron's oligopoly structure does improve industry economics, but the product remains largely commoditized and capital intensive. Returns on capital are decent in strong cycles but historically compress during downturns. Without a clear company-specific moat or stable cash flow profile, intrinsic value estimates become highly sensitive to assumptions about the cycle. When the stock already trades at an aggressive valuation relative to conservative intrinsic value estimates, the margin of safety disappears. That combination-cyclical earnings plus high expectations-is exactly where long-term investors often get burned.
Monitoring over the next 1-4 quarters should focus on signals that either confirm a structural industry shift or reinforce the cyclical narrative. First, track HBM revenue mix and pricing-if high-margin AI memory becomes a much larger share of Micron's business, the quality of earnings could materially improve. Second, watch capital expenditure plans from Samsung and SK Hynix; aggressive capacity expansion would signal the classic oversupply cycle forming. Third, monitor Micron's ROIC and free cash flow through the cycle rather than just peak earnings. Sustained returns above ~15-18% would suggest real structural improvement. Finally, pay attention to hyperscaler AI capex guidance-any slowdown would quickly test the durability of current memory demand.
For now, the prudent value investing stance is WATCH. The AI memory thesis could eventually justify higher intrinsic value, but at today's price the margin of safety simply isn't there, and the durability of the industry's improved economics remains unproven.
Value Investing Team Commentary#
The Investor translates the research view into an investment thesis before risk review. This is still not the final stance.
The central issue with Micron is not whether the business will do well over the next couple of years. It probably will. The real question for a long-term owner is whether the economics of the memory business have truly changed enough to make earnings predictable and durable over a decade.
The market today is clearly pricing Micron as if that structural change has already occurred.
Start with the business itself. Memory manufacturing has enormous barriers to entry: capital requirements, process know-how, and scale have reduced the field to three global players. That is a meaningful improvement versus the fragmented industry of the past. In theory, a rational oligopoly can generate attractive returns.
But oligopolies only work if participants maintain discipline. Memory has historically failed that test. When demand rises, everyone expands capacity. Supply eventually overshoots, prices collapse, and the cycle resets. Micron's historical gross margins swinging from negative to above 40% are evidence of that instability. That is not the kind of earnings pattern that lends itself to confident intrinsic value estimates.
The AI narrative complicates this picture. High-bandwidth memory tied to AI accelerators is genuinely different from commodity DRAM in one key respect: it is technically complex and currently supply-constrained. AI servers require vastly more memory bandwidth than traditional compute, which increases memory content per machine dramatically. If that demand persists, the industry's mid-cycle profitability could indeed rise.
However, two realities temper the excitement.
First, most of Micron's revenue still comes from traditional DRAM and NAND. HBM is the growth engine, but it is not yet the entire locomotive. Second, even if HBM improves margins, the industry's capital intensity remains extreme. Tens of billions must be reinvested every cycle simply to stay technologically competitive. That structurally limits long-term free cash flow generation.
Now consider valuation and sentiment.
At a reported price near $457 with a P/E around 21, the market is effectively valuing Micron on peak-cycle optimism rather than normalized earnings power. Conservative intrinsic value estimates from multiple frameworks cluster far below that level. When the market extrapolates extraordinary growth from a cyclical industry, investors often discover later that they paid peak multiples on peak earnings.
This is where contrarian thinking matters.
Right now, semiconductor sentiment-especially around AI infrastructure-is close to euphoric. Investors are assuming that AI demand will grow linearly while supply discipline remains perfect. History in semiconductors suggests the opposite: success attracts investment, investment creates supply, and supply eventually compresses margins.
The more interesting contrarian angle may actually lie elsewhere. If capital continues flooding into semiconductors, software or other AI beneficiaries with recurring revenue models may eventually offer better economics than the hardware supply chain.
None of this means Micron is a poor company. Management has shown more discipline than in past cycles, and the balance sheet is solid. If the industry truly proves it can sustain mid-cycle ROIC above roughly 15-18% with HBM becoming a large share of revenue, the investment case could strengthen materially.
But a Buffett-style investor requires two things: durable competitive advantage and a margin of safety. Micron currently offers neither at the quoted price. The business advantage is industry-level rather than company-specific, and the valuation assumes a best-case industry outcome.
In investing, the biggest mistakes are often made when good businesses are purchased at unrealistic prices during peak enthusiasm. Memory stocks have historically been fertile ground for that exact error.
FINAL INVESTMENT STANCE: AVOID
Deep Values Commentary#
The Risk Management Team debates and the Risk Judge provides the final action-free verdict. This section determines the final ADVOCATE / WATCH / AVOID stance.
Executive Summary Micron sits at the intersection of a real AI infrastructure boom and a historically brutal commodity industry. The business is improving-higher margins, industry consolidation, and HBM demand suggest the mid-cycle earnings baseline may be rising. But the key Buffett question is durability. Micron still lacks company-specific pricing power, remains capital intensive, and most revenue still depends on cyclical DRAM/NAND markets. With the stock trading far above conservative intrinsic value estimates, the margin of safety is absent. The opportunity may be real, but the valuation already assumes much of the optimistic future. Verdict: WATCH.
Key Arguments from the Debate
Risky Analyst (Bullish Thesis) The bullish argument centers on structural change in both demand and supply.
Demand: AI infrastructure dramatically increases memory requirements, especially high-bandwidth memory (HBM). Each AI accelerator requires large stacks of memory, meaning AI growth directly multiplies memory demand.
Supply structure: The industry has consolidated to three players (Samsung, SK Hynix, Micron), with enormous capital barriers. New entrants are essentially impossible.
Financial momentum: - Revenue growth ~48.9% YoY - Net income growth ~997% - FCF growth ~1278%
The claim is that these numbers reflect a structural demand shock rather than a normal cycle rebound. If AI becomes a multi-decade infrastructure buildout, Micron could transition from cyclical supplier to critical compute infrastructure provider.
Safe Analyst (Bearish Thesis) The bearish case argues that the structural improvements are overstated.
Commodity economics: DRAM and NAND remain largely interchangeable products. Customers buy based on price, limiting pricing power.
Capital intensity: Memory fabs require tens of billions in reinvestment. Even during boom periods, long-term free cash flow can be constrained by capex.
Cycle risk: Violent earnings growth is typical early in semiconductor recoveries when pricing rebounds from trough levels.
HBM limitations: - Still a minority of Micron's revenue - Competitors are aggressively expanding capacity - Supply scarcity may disappear once investment catches up
Valuation risk: With the stock around $457 and intrinsic value models far lower ($19-$59), expectations embedded in the price are extremely high. Even a successful AI story could still lead to poor investment returns if expectations normalize.
Neutral Analyst (Balanced View) The neutral position highlights that both sides over-extrapolate.
Structural improvements likely exist: - Industry consolidation reduces extreme boom-bust behavior - AI demand increases memory consumption per compute unit
But the core industry characteristics remain: - Capital-driven capacity races - Cyclical pricing - Concentrated hyperscaler demand
Micron's current metrics-~40% gross margin, ~15.8% ROE, ~14.5% ROIC-suggest an improving industrial business but not yet a durable compounder.
The most rational interpretation: participate cautiously, recognizing both the secular AI tailwind and the persistent cyclical risk.
Risk Commentary Through a Buffett Lens
- Business Quality and Moat The central Buffett concern is not whether AI demand grows-it almost certainly will. The question is whether Micron captures durable economics from that growth.
Micron's competitive barriers are industry-wide rather than company-specific. The technology barriers protect the oligopoly collectively, but they do not guarantee Micron superior pricing power relative to Samsung or SK Hynix.
That distinction matters. Buffett prefers businesses where competitive advantages accrue to the company, not just the industry.
- Predictability of Earnings Memory remains one of the least predictable segments of semiconductors. Even with consolidation, supply expansions and technological races can quickly change the pricing environment.
A business with earnings that can swing from losses to high margins within a few years is difficult to value conservatively.
- Capital Intensity This remains the structural weakness.
Memory companies must reinvest enormous capital simply to stay technologically relevant. That means peak earnings rarely translate into long-term free cash flow at the same level.
Even if AI permanently increases demand, capital reinvestment may absorb a large portion of those profits.
- Valuation and Margin of Safety This is the biggest problem.
When a cyclical company trades at a valuation that assumes structurally improved profitability, the investor faces two risks simultaneously:
- Industry cyclicality
- Expectation compression
That combination has historically produced disappointing long-term returns in semiconductor cycles.
Refining the Investor's Plan
The original plan already lands in the correct direction: cautious observation rather than aggressive commitment.
However, the debate suggests refining the monitoring framework.
Key signals to track:
-
HBM revenue mix If HBM becomes a large share of Micron's revenue, earnings quality improves significantly.
-
Sustained ROIC above 15-18% Not during peak cycles, but across multiple years. That would signal structural improvement in industry economics.
-
Competitor capacity expansion Aggressive HBM or DRAM fab expansions from Samsung or SK Hynix would signal the next oversupply phase forming.
-
Hyperscaler AI capex AI demand is currently concentrated among a handful of buyers. Any slowdown in their infrastructure spending will flow quickly into memory pricing.
-
Free cash flow across the cycle True value investors should track normalized free cash flow, not peak earnings.
A Buffett-style investor should be willing to buy if either:
- Valuation provides a clear margin of safety during a cyclical downturn, or
- The industry proves that its economics have structurally improved over several years.
Right now neither condition is fully satisfied.
Lessons from Historical Investment Mistakes
Many investors make one of two errors in semiconductor cycles:
Error 1: Assuming the cycle has permanently changed. Error 2: Ignoring genuine structural improvements.
The correct approach is patience. Structural shifts must prove themselves over time before investors can safely extrapolate them.
Buffett historically avoided semiconductor manufacturers for precisely this reason: rapid technological change, heavy capital requirements, and unpredictable pricing.
Micron's story may eventually prove different-but the evidence is still developing.
Final Stance: WATCH
Micron appears to be benefiting from a genuine AI-driven demand expansion and an improved industry structure. However, the company still operates within a capital-intensive, cyclical industry without a clear company-specific moat. With valuation already reflecting strong future expectations, the margin of safety required for value investing is currently absent. The correct posture is patient observation until either the economics prove structurally durable or valuation becomes far more attractive.
Final Stance Scorecard#
This scorecard converts the final research view into a weighted decision frame. It does not replace the narrative judgement, but it makes the main drivers of the verdict easier to scan.
| Criterion | Score | Weight | Commentary |
|---|---|---|---|
| Business Quality | 3.75 | 30% | High returns, profitability, and Piotroski health support durability. |
| Valuation Support | 1.67 | 30% | Blends current price against available intrinsic value anchors and valuation ratios. |
| Financial Strength | 5.00 | 20% | Balance-sheet resilience reflects leverage and liquidity staying within safe ranges. |
| Growth Durability | 5.00 | 20% | Recent revenue, earnings, and free cash flow growth indicate how durable expansion looks. |
| TOTAL / FINAL STANCE | 3.63 | 100% | WATCH |
Key Takeaways#
The weighted score lands at 3.63 / 5.0, while the final stance remains WATCH. This is useful as a quick calibration aid rather than a mechanical signal.
Risk Summary#
Higher scores indicate more risk pressure. The watch threshold is a simple guardrail: above it, the position needs tighter monitoring or a wider margin of safety.
| Dimension | Current Score | Watch Threshold | Commentary |
|---|---|---|---|
| Business Quality | 2.25 | 3.00 | High returns, profitability, and Piotroski health support durability. |
| Valuation Support | 4.33 | 3.00 | Blends current price against available intrinsic value anchors and valuation ratios. |
| Financial Strength | 1.00 | 3.00 | Balance-sheet resilience reflects leverage and liquidity staying within safe ranges. |
| Growth Durability | 1.00 | 3.00 | Recent revenue, earnings, and free cash flow growth indicate how durable expansion looks. |
Key Takeaways#
This view helps readers separate where the risk sits: valuation, business quality, balance sheet, or growth durability. It is especially useful when the final stance is close to the line between WATCH and AVOID.
Frequently asked questions
Is Micron Technology overvalued according to DeepValues Research?
The Apr 16, 2026 report is Neutral (WATCH, score 3.63/5) on Micron Technology (MU): it calls the shares neither clearly undervalued nor clearly overvalued; the intrinsic-value range is in the report's valuation section. The report's intrinsic-value models give a range rather than one number; this is educational research, not investment advice.
What is DeepValues Research's stance on MU?
Neutral (WATCH, score 3.63/5) as of Apr 16, 2026. DeepValues stances are ADVOCATE (bullish), WATCH (neutral) or AVOID (bearish), with a weighted 0-5 scorecard; each report is a dated snapshot.
Where is the full Micron Technology analysis?
The full report is at https://research.deepvalues.ai/company/mu/2026-04-16-en/ (markdown twin: https://research.deepvalues.ai/company/mu/2026-04-16-en/index.md); all Micron Technology reports are at https://research.deepvalues.ai/company/mu/. Live fundamentals and intrinsic values for MU are in the DeepValues app (https://deepvalues.ai) and the DeepValues API (https://app.deepvalues.ai/developers).