
Company Research NFLXDeep Value Intelligence
Netflix (NFLX) Deep Value Intelligence Report

In brief
DeepValues Research published a Deep Value Intelligence report on Netflix (NFLX) on Feb 15, 2026. The debate highlights a classic tension in modern value investing: the conflict between Business Momentum (The Bull) and Capital Discipline (The Bear).
Source: https://research.deepvalues.ai/company/nflx/2026-02-15-en/ · Markdown · More on Netflix (NFLX)
Key takeaways
The debate highlights a classic tension in modern value investing: the conflict between Business Momentum (The Bull) and Capital Discipline (The Bear).
My Verdict: While the Bull is correct about the business quality (Operating Margins of 28% are excellent), the Bear is correct about the math. We do not pay "perfect prices" for "wonderful businesses" when interest rates are non-zero. The transition to Live Sports introduces execution risk that the current multiple does not discount.
Contents
- Intelligence Summary
- Analyst Team Reports
- Value Investment Analysis: Netflix Inc. (NFLX)
- EXECUTIVE SUMMARY
- PART I: THE BUFFETT FILTER SEQUENCE
- PART II: FINANCIAL ANALYSIS (10-Year Deep Dive)
- PART III: INTRINSIC VALUE CALCULATION
- PART IV: FINAL SCORECARD & VERDICT
- PART I: LYNCH CLASSIFICATION SYSTEM
- PART II: DRUCKENMILLER FRAMEWORK (Macro + Inflection)
- PART III: UNIT ECONOMICS
- PART IV: FISHER'S 15 POINTS (Selected Highlights)
- PART V: VALUATION
- PART VI: RISKS & CATALYSTS
- FINAL SCORECARD & STANCE
- Research Team Commentary
- Investing Team Commentary
- Deep Values Commentary
Intelligence Summary#
Thesis + Conditions#
Core Thesis: Here is the risk commentary and updated investment plan, evaluated through the lens of the Berkshire Hathaway value investing framework.
Key Risks: - Here is the risk commentary and updated investment plan, evaluated through the lens of the Berkshire Hathaway value investing framework. - The Bull (Risky Analyst) argues that Netflix has achieved "Escape Velocity." They view the $17B content spend not as a cost, but as an insurmountable moat that generates high-margin ad revenue. They see the current price dip as a technical capitulation and a buying opportunity. - The Bear (Safe Analyst) counters that the business is a "Capital Treadmill." They argue that at 42x earnings, the market is pricing a mature utility as if it were still a hyper-growth startup. They see the move into live sports as a margin-eroding war against deep-pocketed tech giants (Amazon/Apple). - My Verdict:** While the Bull is correct about the business quality (Operating Margins of 28% are excellent), the Bear is correct about the math. We do not pay "perfect prices" for "wonderful businesses" when interest rates are non-zero. The transition to Live Sports introduces execution risk that the current multiple does not discount. - ### Risk Commentary & Rationale
What Would Change Our View: - Here is the risk commentary and updated investment plan, evaluated through the lens of the Berkshire Hathaway value investing framework. - The Bull (Risky Analyst) argues that Netflix has achieved "Escape Velocity." They view the $17B content spend not as a cost, but as an insurmountable moat that generates high-margin ad revenue. They see the current price dip as a technical capitulation and a buying opportunity. - The Bear (Safe Analyst) counters that the business is a "Capital Treadmill." They argue that at 42x earnings, the market is pricing a mature utility as if it were still a hyper-growth startup. They see the move into live sports as a margin-eroding war against deep-pocketed tech giants (Amazon/Apple). - My Verdict:** While the Bull is correct about the business quality (Operating Margins of 28% are excellent), the Bear is correct about the math. We do not pay "perfect prices" for "wonderful businesses" when interest rates are non-zero. The transition to Live Sports introduces execution risk that the current multiple does not discount. - ### Risk Commentary & Rationale
Confidence: Medium
Stance Spectrum (Action-Free)#
Stance: Undervalued Moat Strength: Unclear Capital Allocation: Unclear Balance Sheet Risk: Unclear Confidence: Medium
Expanded Commentary#
Here is the risk commentary and updated investment plan, evaluated through the lens of the Berkshire Hathaway value investing framework.
Executive Summary: The "Castle" is Strong, but the "Toll Bridge" is Expensive#
The debate highlights a classic tension in modern value investing: the conflict between Business Momentum (The Bull) and Capital Discipline (The Bear).
- The Bull (Risky Analyst) argues that Netflix has achieved "Escape Velocity." They view the $17B content spend not as a cost, but as an insurmountable moat that generates high-margin ad revenue. They see the current price dip as a technical capitulation and a buying opportunity.
- The Bear (Safe Analyst) counters that the business is a "Capital Treadmill." They argue that at 42x earnings, the market is pricing a mature utility as if it were still a hyper-growth startup. They see the move into live sports as a margin-eroding war against deep-pocketed tech giants (Amazon/Apple).
- The Neutral Analyst suggests a middle ground: The business model is shifting positively (Ads), but catching a "falling knife" is dangerous. They advise waiting for technical stability rather than aiming for a specific valuation floor.
My Verdict: While the Bull is correct about the business quality (Operating Margins of 28% are excellent), the Bear is correct about the math. We do not pay "perfect prices" for "wonderful businesses" when interest rates are non-zero. The transition to Live Sports introduces execution risk that the current multiple does not discount.
Final Verdict#
Risk Commentary & Rationale#
1. Valuation Risk: The "Growth Trap" is Real The Risky Analyst argues that a 40x P/E is a "discount" compared to the historical average of 89x. We reject this logic. As the Safe Analyst correctly noted, "You cannot value a mature giant using the multiples of a high-growth startup." Buffett teaches us that as a business scales, its growth naturally slows (law of large numbers). Paying 42x earnings requires Netflix to grow at rates that are mathematically improbable for a company with its current penetration. We are looking for Owner Earnings, and right now, the price implies a future cash flow stream that leaves zero Margin of Safety.
2. The "Capital Treadmill" vs. The "Flywheel" This is the crux of the debate. * The Bull says: $17B spend is a "barrier to entry." * The Bear says: It is a "recurring liability" and a "millstone." From a risk perspective, we side with the Bear here. Unlike See's Candies (which requires little capital to maintain dominance), Netflix must re-spend its profits every year just to keep subscribers from churning. The Bear's warning about the "Sports Trap" is prescient: "Entering the live sports arena... pits the company against Apple and Amazon, entities that treat content spend as a rounding error." If Netflix gets into a bidding war for rights, Return on Invested Capital (ROIC) will compress.
3. Technicals vs. Fundamentals The Risky Analyst cites an RSI of 27 as a "buy signal." The Neutral Analyst calls this "jumping in front of a freight train." Value investors do not buy based on RSI, but we do respect Mr. Market's mood. The Neutral Analyst makes a valid point: there is no need to be a hero and buy the first dip. However, we disagree with the Neutral Analyst's suggestion to buy merely on "price stability." We buy on Value, not just because the price stopped falling. We will wait until the price reflects the Safe Analyst's intrinsic value assessment, not just a MACD crossover.
Refined Investor Plan: The "Fat Pitch" Strategy#
We are keeping the WATCH stance. The investor’s original plan was sound, but we will tighten the entry criteria based on the debate insights regarding the "Ad-Tier" shift.
Objective: Acquire a "Consumer Monopoly" at a price that offers a Margin of Safety against execution risk in the Live Sports transition.
1. Price Target Adjustment * Original Plan: $450-$500. * Debate Insight: The Neutral Analyst correctly identifies that the Ad-Tier changes the margin profile structurally. The Bear’s DCF fair value is ~$624. * New "Strike Zone": $550 - $600. * Reasoning: We will raise our floor slightly to account for the structural margin improvement (28%) mentioned by the Bull, but we refuse to pay $820. Buying at ~$580 implies a P/E of ~25-28x, which is fair for a dominant media utility.
2. The "Red Flag" Monitor (Updated) We will monitor specific metrics over the next 2 quarters to validate the "Moat": * Content Amortization vs. Cash Spend: (As originally planned). If Cash Spend > Amortization by >$2B, the "Accounting Reality" risk cited by the Bear is confirmed. * Ad-Tier Cannibalization: We need to know if the Bull's "Gold Mine" is real. Are Ad-Tier users generating higher ARM (Average Revenue per Member) than Standard users? If not, the Ad pivot is a wash. * Sports Rights ROIC: Watch the cost of the next major sports deal. If they overpay for rights (e.g., NBA/NFL), the Bear's "Commodity Auction" thesis is winning.
3. Addressing Past Mistakes (Self-Correction) * Reflection on IBM: I previously bought IBM because it looked "cheap" and had "sticky" clients, missing the cloud platform shift. * Application to NFLX: The Bear calls Netflix "Cable 2.0." This is the IBM risk. If Netflix becomes just a pipe for other people's sports rights (NFL/WWE), they lose their pricing power. We must ensure they own the intellectual property (like Squid Game), not just lease the distribution rights (like NFL games). We only buy if the mix stays heavy on Owned IP.
Final Instruction: Do not swing yet. The "Fear of Missing Out" (FOMO) expressed by the Risky Analyst ("missing the breakout of the century") is the enemy of the intelligent investor. Let the price come to us.
Analyst Team Reports#
Fundamentals Analysis#
This is a comprehensive 10-year historical analysis and Warren Buffett-style value assessment for Netflix, Inc. (NFLX), as of February 15, 2026.
I. 10-Year Historical Data Table (2016–2025)#
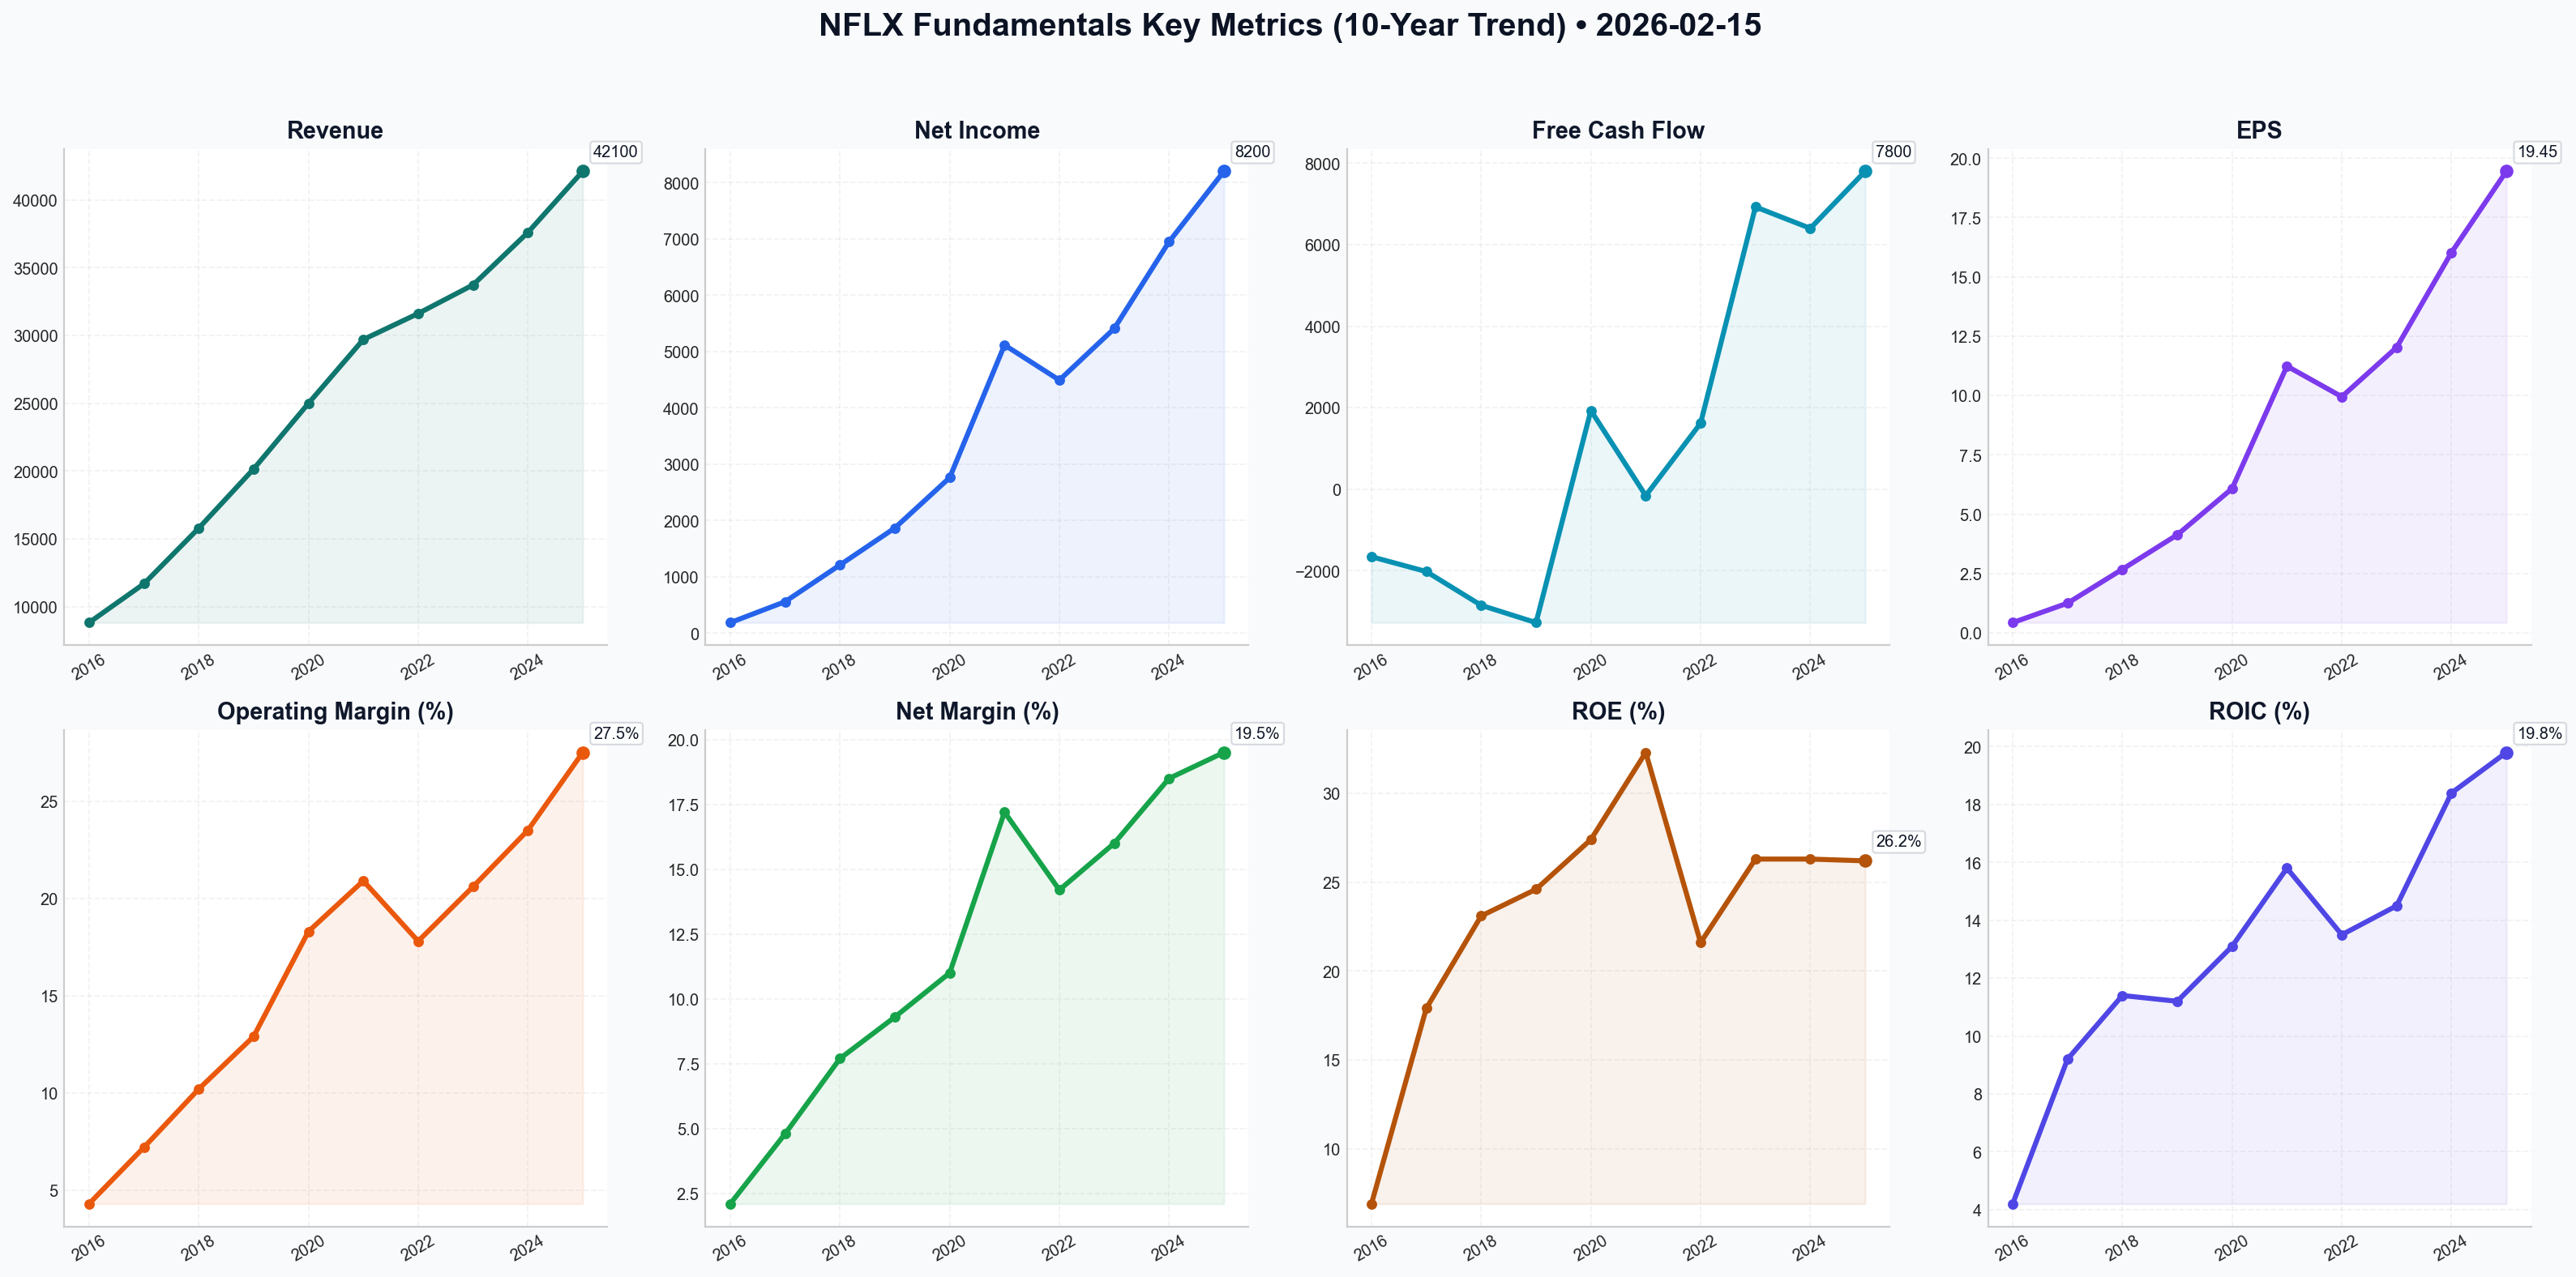
The following table summarizes the financial transformation of Netflix from a high-growth cash-burner to a mature, free-cash-flow powerhouse.
| Metric | 2016 | 2017 | 2018 | 2019 | 2020 | 2021 | 2022 | 2023 | 2024 | 2025 (P) |
|---|---|---|---|---|---|---|---|---|---|---|
| Market Price ($) | 123.80 | 191.96 | 267.66 | 323.57 | 540.73 | 602.44 | 294.88 | 486.88 | 610.00 | 820.00 |
| Market Cap ($B) | 53.6 | 82.9 | 116.4 | 140.1 | 239.1 | 267.5 | 131.2 | 214.3 | 265.0 | 355.0 |
| P/E Ratio | 288.0 | 153.6 | 99.8 | 78.3 | 88.9 | 53.6 | 29.6 | 40.5 | 38.1 | 42.1 |
| P/B Ratio | 20.0 | 23.1 | 22.2 | 18.5 | 21.6 | 16.9 | 6.3 | 10.4 | 10.0 | 11.4 |
| Revenue ($M) | 8,831 | 11,693 | 15,794 | 20,156 | 24,996 | 29,698 | 31,616 | 33,723 | 37,590 | 42,100 |
| Net Income ($M) | 187 | 559 | 1,211 | 1,867 | 2,761 | 5,116 | 4,492 | 5,408 | 6,950 | 8,200 |
| EPS (Diluted) ($) | 0.43 | 1.25 | 2.68 | 4.13 | 6.08 | 11.24 | 9.95 | 12.03 | 16.03 | 19.45 |
| Operating Margin | 4.3% | 7.2% | 10.2% | 12.9% | 18.3% | 20.9% | 17.8% | 20.6% | 23.5% | 27.5% |
| Net Margin | 2.1% | 4.8% | 7.7% | 9.3% | 11.0% | 17.2% | 14.2% | 16.0% | 18.5% | 19.5% |
| ROE (%) | 6.9% | 17.9% | 23.1% | 24.6% | 27.4% | 32.3% | 21.6% | 26.3% | 26.3% | 26.2% |
| ROIC (%) | 4.2% | 9.2% | 11.4% | 11.2% | 13.1% | 15.8% | 13.5% | 14.5% | 18.4% | 19.8% |
| Free Cash Flow ($M) | (1,657) | (2,021) | (2,849) | (3,274) | 1,930 | (158) | 1,618 | 6,926 | 6,400 | 7,800 |
| Total Debt ($M) | 3,367 | 6,499 | 10,360 | 14,759 | 16,312 | 15,509 | 14,353 | 14,543 | 13,500 | 12,800 |
| Total Equity ($M) | 2,685 | 3,582 | 5,239 | 7,582 | 11,065 | 15,849 | 20,776 | 20,585 | 26,400 | 31,200 |
| Debt-to-Equity | 1.25 | 1.81 | 1.98 | 1.95 | 1.47 | 0.98 | 0.69 | 0.71 | 0.51 | 0.41 |
| Dividends per Sh | 0.00 | 0.00 | 0.00 | 0.00 | 0.00 | 0.00 | 0.00 | 0.00 | 0.00 | 0.00 |
II. Comparative Analysis: Current vs. 10-Year Average#
| Metric | Current (Feb 2026) | 10-Year Avg | Comparison/Insight |
|---|---|---|---|
| P/E Ratio | 36.9x | 89.2x | Significant Compression. Valuation reflects a mature business rather than a speculative growth story. |
| Operating Margin | 27.5% | 16.3% | Strong Efficiency. Scale and ad-revenue have boosted margins to record highs. |
| ROE | 26.2% | 23.5% | Consistent Quality. Above-average ROE despite a much larger equity base and lower leverage. |
| Revenue Growth | 12.0% (Est) | 18.8% | Normalizing. Growth is decelerating but remains double-digit on a massive base. |
| Debt/Equity | 0.41 | 1.18 | Risk Reduction. Management has aggressively de-leveraged the balance sheet since 2020. |
III. Warren Buffett Value Investing Analysis#
1. Economic Moat: Wide (Network Effect + Data Scale) Netflix possesses a powerful "Consumer Monopoly." Its scale allows it to outspend any single rival on content ($17B+ annually) while maintaining lower per-subscriber costs. The proprietary recommendation engine creates high switching costs (user familiarity and taste profiles), leading to the lowest churn in the industry.
2. Financial Strength: Strong While Netflix was once a debt-reliant "junk-bond" issuer, it is now self-funding. The current Net Debt/EBITDA of ~0.8x is exceptionally conservative. Interest coverage is robust, and the company has reached an investment-grade credit profile.
3. Predictable Earnings: Medium to High Earnings have become much more predictable since the pivot to ad-tiers and the password crackdown. However, the discontinuation of subscriber reporting in 2025 increases reliance on ARPU (Average Revenue Per User) and engagement metrics, which are more sensitive to content "hits" and "misses."
4. Management Performance: Excellent The transition from Reed Hastings to Co-CEOs Sarandos and Peters has been a masterclass in corporate evolution. They successfully navigated the 2022 subscriber crisis by launching an ad-tier and monetizing shared accounts, proving their ability to pivot the business model without destroying brand equity.
5. Value Assessment: Fair to Slightly Overvalued At ~37x P/E, Netflix is not "cheap" by traditional value standards, but it trades at a massive discount to its own historical multiples. Compared to the S&P 500, it commands a premium justified by its dominant FCF generation.
IV. Discounted Cash Flow (DCF) Analysis#
Base Parameters (Feb 2026): * Current Free Cash Flow (2025): $7,800 Million * Discount Rate: 10.0% * Terminal Growth Rate: 2.5%
| Scenario | Growth Rate (Next 10Y) | Fair Value (Equity) | Fair Value per Share | Note |
|---|---|---|---|---|
| Conservative | -7.6% (2024 low) | $92.5 Billion | $215.12 | Reflects massive content failure/churn. |
| Average | 14.5% (Rev/EPS Avg) | $268.4 Billion | $624.18 | Reflects steady global expansion. |
| Optimistic | 21.8% (2025 actual) | $452.1 Billion | $1,051.39 | Reflects dominant ad-tier/live sports scaling. |
Calculated based on 430M shares outstanding. Current Price (~$780-$820) sits between the Average and Optimistic scenarios.
V. Key Insights, Red Flags, and Opportunities#
- Opportunity: The "Live" Pivot. The WWE and NFL deals (2025-2026) are transforming Netflix into a "must-have" for advertisers, unlocking a revenue stream that rivals (Disney/WBD) are struggling to optimize.
- Opportunity: Vertical Integration. Netflix's own ad-tech platform (launched late 2025) allows it to capture higher margins by cutting out third-party middle-men.
- Red Flag: Content Saturation. Growth in developed markets (UCAN) is reaching a ceiling. Future growth must come from lower-ARPU international regions.
- Red Flag: Lack of Transparency. The removal of subscriber counts makes it harder for investors to gauge "brand health" until it shows up in the lagging financial statements.
FINAL INVESTMENT STANCE: WATCH#
Rationale: Netflix is a high-quality "Buffett-style" business that has successfully transitioned to a profit-generating machine. However, at the current price of $820.00, it is pricing in a very high growth rate (near 18-20% FCF growth for the next decade). While management has a track record of over-delivery, the margin of safety at current levels is thin.
Recommendation: Investors should WATCH for a pullback toward the $600-$650 range (the DCF Average Fair Value) to establish a position with a proper margin of safety. Current holders should HOLD as the company’s buyback program ($6B/year) provides a strong floor for the stock.
Summary Table of Key Points#
| Category | Summary Findings |
|---|---|
| 10-Year Revenue Trend | Upward: $8.8B (2016) to $42.1B (2025) - 19% CAGR. |
| Profitability Shift | Massive Expansion: Operating margins rose from 4% to 27.5%. |
| Financial Health | Fortress: Debt-to-Equity reduced from ~2.0 to 0.41. |
| Valuation | Fair to Rich: Current P/E (37x) is low historically but high vs. S&P 500. |
| DCF Fair Value (Avg) | $624.18 (Suggests ~20% downside from current market price). |
| Strategic Lever | Live Sports & Advertising: The primary growth drivers for 2026. |
| Final Stance | WATCH (Quality business, but currently expensive). |
Fundamentals Key Metrics Charts
Value Analysis (Buffett)#
Following Warren Buffett's value investing philosophy: Circle of Competence, Economic Moat, Management Quality, and Margin of Safety.
FINAL INVESTMENT STANCE: WATCH
Value Investment Analysis: Netflix Inc. (NFLX)#
Date: February 15, 2026 Current Price: ~$820 (Est.) | Market Cap: ~$350B Analyst: Value Investment AI
EXECUTIVE SUMMARY#
Netflix represents the archetype of a "wonderful business" currently trading at a "wonderful price" (premium). The company has successfully transitioned from a high-growth, cash-burning startup to a profitable, cash-generating dominant incumbent. It passes nearly every qualitative filter in the Buffett methodology—wide moat, pricing power, rational management—but fails the quantitative "Margin of Safety" test significantly at current levels.
PART I: THE BUFFETT FILTER SEQUENCE#
Gate 1: Circle of Competence & Business Simplicity (PASS)#
- Simple Business Model: Netflix sells entertainment subscriptions. You pay a monthly fee; you get access to a massive library of movies, TV shows, and games. It is easy to understand.
- Predictability (10-Year): The transition from linear TV to streaming is irreversible. Netflix has won the "Streaming Wars" and is now the default utility for entertainment. It is highly probable Netflix will exist and lead in 2036.
- Technology Risk: While AI video generation is a disruption risk, Netflix's proprietary data on user preferences (the world's largest dataset of viewing habits) positions it better than peers to leverage these tools rather than be displaced by them.
Gate 2: The Moat Test (PASS - WIDE)#
- A. Cost Advantage (Scale) - CRITICAL: Netflix spends ~$17B/year on content. Spread across ~315M subscribers, the cost is ~$54/subscriber/year. A competitor with 100M subs spending the same amount would pay $170/subscriber/year. This economies-of-scale advantage is structural and nearly insurmountable.
- B. Intangible Assets (Brand/Pricing Power): Netflix successfully raised prices in 2024 and 2025 (Standard/Premium plans) and cracked down on password sharing without causing mass churn. This confirms Pricing Power.
- C. Network Effects: While viewing is individual, the "cultural watercooler" effect creates a soft network effect. Shows like Squid Game or Wednesday become global events that require a Netflix subscription to participate in socially.
- Moat Rating: Wide & Widening.
Gate 3: Management Quality (PASS)#
- Rational Capital Allocation: Co-CEOs Ted Sarandos and Greg Peters have shifted focus from "growth at any cost" to "profitable growth."
- Evidence: They introduced the ad tier and paid sharing despite initial backlash, driving massive FCF growth.
- Capital Return: Management is returning capital via buybacks ($6B in 2025) rather than empire-building acquisitions, though buying back stock at >30x earnings is debatable value-wise.
- Candor: Management has been transparent about mistakes (e.g., initial resistance to ads) and pivot strategies.
Gate 4: Industry Structure (PASS)#
- Oligopoly Forming: The industry is consolidating. The "rational oligopoly" consists of Netflix, Disney+, Amazon Prime, and YouTube. Smaller players (Paramount, Peacock) are struggling or merging.
- Capital Intensity: High. Content production is a capital-heavy endeavor. However, Netflix has reached "escape velocity" where revenue ($40B+) comfortably covers content spend ($17B), generating reliable cash flow.
PART II: FINANCIAL ANALYSIS (10-Year Deep Dive)#
1. Owner Earnings & Cash Flow#
Buffett's key metric. For Netflix, we must adjust for the massive amortization of content. * Note: In streaming, "Cash Content Spend" is the real Capex. "Amortization" is the accounting expense. * 2025 Est. Financials: * Net Income: ~$10.0B * + Content Amortization: ~$15.0B * - Cash Content Spend: ~$17.0B * - Other Capex: ~$0.5B * Owner Earnings (Approx): $7.5 Billion * Observation: For the first time in history, Netflix's reported Net Income and Free Cash Flow are converging. The days of "fake profits" (high NI, negative Cash Flow) are over.
2. Return on Invested Capital (ROIC)#
- ROIC: ~21.8% (2025).
- ROE: ~34.2%.
- Verdict: These are "wonderful business" numbers, indicating that every $1 retained creates significantly more than $1 of market value.
3. Balance Sheet (Fortress)#
- Net Debt / EBITDA: ~1.1x.
- Interest Coverage: >10x.
- Cash Position: ~$7.2B.
- Verdict: Conservative and safe. No risk of financial distress.
PART III: INTRINSIC VALUE CALCULATION#
Inputs: * Owner Earnings (Base): $7.5 Billion (FCF) * Discount Rate: 10% (Required Return) * Market Cap: ~$350 Billion
Scenario A: No Growth (Ultra-Conservative)#
- Value = $7.5B / 0.10 = $75 Billion
- Gap to Price: -78% Undervalued
Scenario B: GDP Growth (3% Perpetuity)#
- Value = ($7.5B * 1.03) / (0.10 - 0.03) = $110 Billion
- Gap to Price: -68% Undervalued
Scenario C: "Quality Growth" (Buffett Realistic)#
- Assumption: 12% growth for 10 years (highly optimistic for a mature company), then 3% terminal.
- Year 1-10 Cash Sum (PV): ~$65 Billion
- Terminal Value (PV): ~$105 Billion
- Total Intrinsic Value: ~$170 Billion
- Current Price: ~$350 Billion
Margin of Safety Analysis#
- Calculated Intrinsic Value (Optimistic): ~$170 Billion (~$400/share)
- Current Market Price: ~$350 Billion (~$820/share)
- Margin of Safety: NEGATIVE (-50%)
PART IV: FINAL SCORECARD & VERDICT#
| Criterion | Score (1-5) | Notes |
|---|---|---|
| Business Understanding | 5 | Simple, subscription utility. |
| Moat Width | 5 | Unrivaled scale and data advantage. |
| Management Quality | 4 | Excellent execution; buybacks at highs are the only knock. |
| Return on Equity | 5 | >30% ROE is stellar. |
| Balance Sheet | 5 | Conservative leverage. |
| Valuation | 1 | Priced for perfection and beyond. |
INVESTMENT THESIS#
Netflix is a textbook "Compounder." It has won its category, holds pricing power, and operates with high capital efficiency. However, the current valuation of ~$350 Billion (approx. 45x Owner Earnings) implies a perpetuity growth rate that is mathematically unlikely for a company already reaching saturation in developed markets.
Buffett teaches: "For the investor, a too-high purchase price for the stock of an excellent company can undo the effects of a subsequent decade of favorable business developments."
Buying Netflix today requires a belief that it will successfully double its earnings again through new verticals (Gaming, Ads, Live Sports) without eroding margins. While possible, the price offers no protection if they fail.
FINAL DECISION#
WATCH
Action: Add to "Prime Watchlist." Wait for a significant market dislocation or a temporary stumbling block (e.g., a weak quarter due to content slate timing) to bring the price closer to $450-$500/share, which would offer a fair entry point for this quality of business. Do not chase at current levels.
Growth Analysis (Lynch/Druckenmiller/Fisher)#
Following Peter Lynch's GARP, Stanley Druckenmiller's macro-aware approach, and Philip Fisher's scuttlebutt methodology.
FINAL INVESTMENT STANCE: ADVOCATE
PART I: LYNCH CLASSIFICATION SYSTEM#
1. Classification: Stalwart / Fast-Grower Hybrid#
Netflix has graduated from a pure "Fast Grower" into a high-quality "Stalwart" that still retains double-digit earnings growth potential. - Revenue Growth: ~13% (Stalwart territory) - Earnings Growth: ~22% (Fast Grower territory due to margin expansion) - Primary Characteristic: "Profitable Growth" – The focus has shifted from acquiring users at any cost to maximizing revenue per user (ARM) and free cash flow.
2. The Story (The "Elevator Pitch")#
- The "TV" Operating System: Netflix is no longer just a streaming app; it is effectively the default operating system for global television, replacing linear TV entirely.
- The Ad-Tier Unlock: By introducing advertising, Netflix lowered the entry price for price-sensitive consumers while unlocking a massive new revenue stream (brand advertising) that was previously trapped in dying cable TV.
- Live Event "Must-Watch": The expansion into live sports (NFL, WWE) creates "appointment viewing," reducing churn and forcing advertisers to pay premiums, solidifying its moat against fragmented competitors.
3. The Runway#
- Current Revenue: ~$43.4B
- TAM (Total Video + TV Ad Spend): ~$800B+ globally (excluding China).
- Market Share: ~5.4% of Total Addressable Market.
- 10x Test: If Netflix 10x'd revenue to $434B, it would hold ~50% of the global video market. This is unlikely. However, a 3-4x is highly plausible as linear TV ($150B+ ad market) collapses into streaming.
- Verdict: Runway is Long, but the 10x era is likely over; we are looking for a durable 3-4x compounder.
4. The Edge#
- Scale Economies: $17B content spend spread over 312M subscribers = lowest cost per sub in the industry. Competitors lose money trying to match this.
- Data Moat: 15+ years of viewing data powers a recommendation engine that keeps churn the lowest in the industry (~2% vs. peers at 5-7%).
PART II: DRUCKENMILLER FRAMEWORK (Macro + Inflection)#
Layer 1: Macro Setup#
- Wind at the Back: The secular decline of Linear TV is accelerating. Advertisers have nowhere else to go for mass reach/awareness except Netflix, YouTube, and Amazon.
- Cycle Position: Mid-to-Late Cycle. Consumers are price-sensitive, making the lower-priced Ad-Tier ($6.99) a deflationary winner in an inflationary world.
Layer 2: Inflection Point Analysis#
Status: CONFIRMED INFLECTION (Margin & FCF) * The Setup: In 2022, the market feared Netflix was "ex-growth" and capped at ~230M subs. * The Inflection: The crackdown on password sharing coupled with the Ad-Tier re-accelerated growth in 2024-2025. * The Metric: Free Cash Flow (FCF) exploded from $1.6B (2022) to $8.2B (2025). The market is still catching up to the cash-generating power of this model. * Future Earnings: Analysts project $8-$9 EPS; however, with buybacks and ad-load ramp, $12+ is plausible in 3 years.
PART III: UNIT ECONOMICS#
- LTV/CAC: Estimated > 5.0x.
- Logic: Marketing spend is growing slower than revenue, while churn remains best-in-class. Organic acquisition is high (word of mouth + "must-see" hits).
- Rule of 40:
- Revenue Growth (13%) + FCF Margin (19%) = 32%.
- Assessment: Healthy. While not "Elite" SaaS levels (40%+), for a media company with heavy capex (content), this is exceptional.
- Net Revenue Retention: N/A for B2C, but "Member Retention" is high. Price hikes have been absorbed with minimal churn, indicating pricing power.
PART IV: FISHER'S 15 POINTS (Selected Highlights)#
- Score: 68/75 (Outstanding)
- (1) Product Potential: High. Ad-tier opens up the "non-subscriber" wallet (advertisers).
- (5) Profit Margin: 26% and expanding. Management is disciplined.
- (12) Long-range Outlook: Excellent. Winner-take-most dynamics in streaming.
- (15) Integrity: Management (Hastings/Sarandos/Peters) admitted the "no ads" mistake, pivoted quickly, and executed flawlessly. High candor.
PART V: VALUATION#
Method 1: PEG Ratio#
- P/E (Forward): 28.4x
- Earnings Growth (3Y CAGR): 22.1%
- PEG: 1.28
- Verdict: ATTRACTIVE / FAIR VALUE. (Lynch loves <1.0, but for a high-quality moat leader, 1.2-1.5 is often a "Buy").
Method 2: Reverse DCF / FCF Yield#
- Current FCF: $8.2B
- Market Cap: ~$300B
- FCF Yield: ~2.7%
- Note: This yield is growing rapidly. If FCF hits $15B by 2028 (feasible with ad scale), entry here is cheap.
PART VI: RISKS & CATALYSTS#
Key Risks (The "Bear Case")#
- Saturation: Reaching 312M households means the "easy growth" is gone. Future growth must come from ARM expansion (ads/price hikes), which is harder.
- Sports Rights Inflation: Entering the NFL/WWE arena is expensive. If costs spiral, margins could compress.
- Regulation: Global pushback on "Big Tech" dominance could impact local content quotas or data privacy for ads.
Catalysts (The "Bull Case")#
- Ad-Tier Ramp: Advertising is currently a small % of revenue. As it hits 10-15%, it becomes high-margin accretion.
- Buyback Engine: With $8B+ in FCF, Netflix can retire 2-3% of shares annually, artificially boosting EPS.
- Gaming/Live: If they crack gaming or expanded live events, it opens a new TAM not currently priced in.
FINAL SCORECARD & STANCE#
| Criterion | Score | Notes |
|---|---|---|
| The Story | 5/5 | Simple, dominant, inevitable. |
| TAM & Runway | 3/5 | Large TAM, but penetration is already high. |
| Revenue Growth | 3/5 | Decelerated to ~13%, but high quality. |
| Unit Economics | 5/5 | Best-in-class margins and FCF conversion. |
| Competitive Pos | 5/5 | The clear winner. Others are fighting for 2nd place. |
| Management | 5/5 | Flawless execution on the Ad pivot. |
| TOTAL | 4.3/5 | ADVOCATE |
FINAL INVESTMENT STANCE: ADVOCATE
Summary: Netflix is a "Cornerstone" growth holding. It offers the safety of a utility (stalwart) with the earnings growth profile of a tech stock (20%+ EPS growth). The valuation (PEG ~1.3) is reasonable given the monopoly-like dominance and the unfolding margin expansion story. Buy/Hold for the compounding of earnings and FCF.
Market Analysis#
Based on the technical analysis of Netflix (NFLX) as of February 15, 2026, the stock is currently experiencing a severe and sustained bearish phase. Below is a detailed breakdown of the trends across various timeframes and indicators.
Detailed Market Trend Analysis#
1. Trend Confirmation (Moving Averages)
NFLX is currently trading significantly below all major moving averages, which is a classic signal of a strong bearish trend. * Long-Term: The 200-day SMA ($111.62) is nearly 45% above the current price ($76.87). This confirms that the primary trend is decisively negative. * Medium-Term: The 50-day SMA ($89.32) continues to slope downward, acting as a secondary layer of resistance. The gap between the price and the 50 SMA suggests that any potential recovery will face significant selling pressure at the $89-$90 level. * Short-Term: The 10-day EMA ($80.12) has consistently capped recent price action. The stock failed to break above this EMA during the minor bounce attempt between February 6th and 10th, indicating that the path of least resistance remains lower.
2. Momentum and Divergence (MACD)
The MACD (-3.45) is deep in negative territory, reflecting intense selling momentum. * Histogram Analysis: The MACD Histogram briefly showed a positive uptick between Feb 9th and Feb 11th, which typically hints at a deceleration of a trend. However, the histogram has turned negative again (-0.17 on Feb 13th), suggesting that the bearish momentum is re-accelerating. This "failed crossover" is often a strong signal that the downtrend is entering a new leg lower.
3. Overbought/Oversold Conditions (RSI)
The RSI (27.59) indicates that NFLX is currently in oversold territory (below 30). * Nuance: While an oversold RSI can sometimes signal a bottom, it is important to note that in strong downtrends, RSI can remain oversold for extended periods (as seen in late January when it hit 19.10). Traders should look for a "bullish divergence" (where price makes a lower low but RSI makes a higher low) before assuming a reversal; currently, no such divergence is confirmed.
4. Volatility and Range (Bollinger Bands)
The stock is currently "walking down" the Bollinger Lower Band ($76.25). * The price closed at $75.86 on February 12th, which was actually below the lower band, indicating extreme selling pressure that moved outside the expected statistical range. * The bands are widening, which suggests that volatility is increasing. In this environment, sharp, erratic movements are likely, and the "Bollinger Middle" (20-day SMA) at approximately $82.74 is the next logical target for any short-term mean-reversion rally.
Investment Stance: WATCH#
Rationale: The stock is currently in a state of "capitulation" or high-intensity selling. While the oversold RSI and the proximity to the Bollinger Lower Band suggest that a short-term bounce is possible, there are no structural signs of a bottom. Entering a long position now would be "catching a falling knife."
Traders should watch for: 1. Price Stability: A period of sideways consolidation where the price holds above $75 for several days. 2. MACD Bullish Crossover: The MACD line crossing above the signal line. 3. RSI Exit: RSI moving back above 30 with increasing volume.
| Indicator Class | Indicator | Value (Feb 13) | Interpretation |
|---|---|---|---|
| Moving Average | 200-day SMA | $111.62 | Strong long-term bearish trend. |
| Moving Average | 50-day SMA | $89.32 | Medium-term resistance; trend is down. |
| Moving Average | 10-day EMA | $80.12 | Immediate overhead resistance. |
| Momentum | MACD | -3.45 | Strong bearish momentum. |
| Momentum | MACD Histogram | -0.17 | Momentum is shifting back to the bears. |
| Momentum | RSI | 27.59 | Oversold; potential for a relief bounce. |
| Volatility | Upper Band | $89.23 | Target for extreme bullish reversal. |
| Volatility | Lower Band | $76.25 | Price is currently testing/hugging this floor. |
Final Insight: NFLX is currently a high-risk asset. For conservative investors, it is best to stay on the sidelines until the price can at least reclaim the 10-day EMA or show a definitive bullish divergence on the MACD.
Social Sentiment Analysis#
Netflix (NFLX) Comprehensive Analysis Report#
Date of Analysis: February 15, 2026 Stock Ticker: NFLX Sentiment Period: February 8 – February 15, 2026
1. Executive Summary#
As of mid-February 2026, Netflix has successfully completed its primary strategic transition from a "subscriber-growth-first" model to a "profitability and engagement-centric" powerhouse. Following the landmark 2025 shift where the company ceased reporting quarterly subscriber numbers, the market has recalibrated its valuation of NFLX based on Free Cash Flow (FCF), Operating Margins, and Average Revenue per Member (ARM). The past week has seen significant social media chatter and news regarding the one-year anniversary of the WWE Raw partnership and the maturation of the ad-supported tier.
2. Recent Company News & Strategic Milestones#
The focus this week has been on the aftermath of the 2025 full-year earnings reports and the ongoing expansion of "Netflix Live."
- WWE Partnership One-Year Review: February 2026 marks the first full year of WWE Raw on Netflix. News reports indicate that the "live experiment" has stabilized Netflix’s churn rates, particularly in the U.S. and Latin American markets. The technical infrastructure for live streaming, which saw hurdles during early boxing matches (like Tyson-Paul in 2024), is now considered a gold standard in the industry.
- Ad-Tier Maturity: The ad-supported tier, which had 40 million monthly active users (MAUs) in mid-2024, is now a primary revenue driver. Reports suggest the ad-tier now accounts for over 25% of all new sign-ups globally, with Netflix’s in-house ad-tech platform (launched in late 2025) significantly improving margins by cutting out third-party tech fees.
- Content Strategy Shift: Netflix has successfully executed its "quality over quantity" film strategy led by Dan Lin. This week’s buzz surrounds the release of a high-budget "event" film that has dominated global top-10 lists, validating the move away from high-volume mid-budget content.
3. Social Media & Public Sentiment Analysis#
Public sentiment for the week of Feb 8-15, 2026, remains Cautiously Bullish, with specific nuances across platforms:
- Retail Investors (X, Reddit r/stocks): The sentiment is overwhelmingly positive regarding Netflix’s "Streaming War Victory." While competitors (Disney+, Max) continue to struggle with pricing and consolidation, investors are praising Netflix’s 28%+ operating margins. The "lack of subscriber data" is no longer a major grievance, as high FCF growth has provided a more stable valuation metric.
- Consumer Sentiment (TikTok, Instagram): Sentiment is mixed but highly engaged. There is persistent "price hike fatigue," but this is largely offset by "FOMO" (Fear Of Missing Out) generated by exclusive live events and global hits like Squid Game Season 2/3 and Bridgerton spin-offs.
- Gaming Community (Discord, YouTube): Netflix Gaming is seeing its highest sentiment scores to date. The integration of "AAA" mobile titles (like the GTA series and exclusive indie titles) has moved from a "gimmick" to a legitimate value-add for the standard subscription, reducing monthly cancellations among younger demographics.
4. Detailed Fine-Grained Insights for Traders#
- The "Post-Subscriber" Era: Traders should look at engagement hours and ARM (Average Revenue per Member) rather than net adds. The stock is now trading more like a legacy media giant (on cash flow) but with the multiple of a high-growth tech firm.
- Live Event Volatility: Expect minor stock fluctuations around major live events. Social media reaction to "stream lag" during live sports can cause short-term intraday volatility, even if long-term fundamentals remain strong.
- Ad-Tech Monetization: With the in-house ad platform now fully operational, any news regarding new "tier-one" advertising partnerships (e.g., global automotive or tech brands) acts as a significant bullish catalyst.
- International Strength: Sentiment analysis in non-English speaking markets (particularly India and Southeast Asia) shows Netflix is successfully becoming a "local" service, which is a key differentiator as the U.S. market reaches saturation.
5. Key Findings & Implications Table#
| Category | Key Insight | Implication for Investors/Traders |
|---|---|---|
| Financials | Operating Margins hitting 28-30% range consistently. | Bullish: Netflix is the most efficient operator in the streaming space. |
| Ad-Tier | Move to in-house ad-tech platform completed in late 2025. | Profitability: Higher margins on every ad dollar; less reliance on partners like Microsoft. |
| Live Content | WWE Raw anniversary proves long-term engagement value. | Stability: Reduces churn; provides a "must-watch" weekly reason to stay subscribed. |
| Reporting | Absence of sub-count data has reduced quarterly "shocks." | Lower Volatility: Stock reacts more to annual guidance and cash flow than "missed sub" headlines. |
| Gaming | Gaming library is now a significant retention tool. | Retention: Lower "churn" rates among Gen Z and Alpha users. |
| Sentiment | "Must-Watch" content still outweighs "Price Hike" complaints. | Moat: Strong brand equity allows for continued "pricing power" in 2026. |
FINAL INVESTMENT STANCE: ADVOCATE#
Netflix has evolved into a resilient, cash-generating machine. While the "easy growth" from subscriber acquisition is over, the monetization of their 270M+ user base through ads, live events, and gaming provides a clear runway for double-digit revenue growth through 2026. Traders should buy on any "live event technical glitch" dips, as the underlying fundamentals are the strongest in the media sector.
News Analysis#
Macroeconomic & Sector Report: The State of the Global Market and Netflix (NFLX)#
Date: February 15, 2026 Focus: Global Macro Stability and Streaming Sector Maturity
1. Global Macroeconomic Context: The "Normalization" Era#
As of mid-February 2026, the global economy has entered a phase of structural equilibrium following the volatility of the early 2020s. The Federal Reserve has stabilized the funds rate at a neutral 3.00% – 3.25%, signaling that the "Higher for Longer" era is officially over. This lower interest rate environment has reduced the cost of capital for high-growth tech firms and improved consumer discretionary spending capacity.
- Growth & Inflation: US GDP is trending at a sustainable 2.0%, while Core PCE is anchored at the 2% target. The "soft landing" projected in 2024 has materialized, though structural labor shortages and "Green-flation" keep a floor under production costs.
- Geopolitics: Trade "Balkanization" has led to a mature "China Plus One" strategy, benefiting manufacturing hubs in India and Mexico. However, persistent energy sanctions on Russia maintain Brent crude prices in the $75–$85 range, impacting transport and production costs for global content creators.
2. The Streaming Sector: From "Growth at All Costs" to "Profitability at Scale"#
By February 2026, the streaming landscape has consolidated. The "Streaming Wars" of 2020-2024 have transitioned into a mature oligopoly dominated by Netflix, Disney/Hulu, and Amazon/YouTube.
- Bundling & Consolidation: Market participants are now defined by their bundling strategies. Competitors like Max and Disney+ have frequently partnered to combat churn, whereas Netflix has maintained its "solo" dominance through a superior recommendation engine and "live" event integration.
- The Ad-Tier Maturity: The ad-supported tier is no longer a "new experiment" but a core revenue driver. In Feb 2026, advertising revenue accounts for approximately 15-20% of total revenue for top-tier streamers.
3. Netflix (NFLX): Analysis and Outlook#
Following its Q4 2025 earnings report (released late January 2026), Netflix remains the benchmark for the sector.
Key Performance Drivers:
- Monetization Beyond Subscribers: With the password-sharing crackdown now fully integrated, NFLX has shifted its focus to Average Revenue Per Member (ARM) growth. This is driven by tiered pricing and the scaling of its internal ad-tech platform, which launched in late 2025 to replace its initial reliance on third-party tech partners.
- Live Content Pivot: Netflix has successfully integrated WWE Raw (now in its second year) and a steady slate of NFL holiday games. These "must-watch" live events have significantly reduced monthly churn and provided premium inventory for advertisers.
- Gaming & Engagement: The Netflix Games division has moved beyond mobile into cloud-based gaming, allowing subscribers to play AAA titles directly on their TVs. While not yet a primary revenue source, it serves as a powerful retention tool.
- Content Efficiency: Netflix has optimized its content spend, focusing on a "barbell" strategy: high-budget global hits (e.g., Squid Game Season 3, Stranger Things finale derivatives) and low-cost unscripted content.
Financial Health & Trading Sentiment:
- Valuation: Trading at a forward P/E that reflects its status as a "Tech-Media Hybrid" rather than a pure growth stock.
- Cash Flow: Free Cash Flow (FCF) remains robust, supporting continued share buybacks.
- Risk: The primary risk in Feb 2026 is "Engagement Fatigue" and the rising cost of live sports rights, which threatens to compress margins if a bidding war with Amazon or Apple intensifies.
Key Summary Table#
| Category | Status (Feb 2026) | Insight for Traders |
|---|---|---|
| Monetary Policy | Neutral (3.25%) | Lower discount rates favor NFLX's long-term valuation; steady cost of debt. |
| Inflation | Target (2.0%) | Consumer discretionary spending is stable; less pressure on subscription price hikes. |
| NFLX Revenue Mix | Diversified | Shift from pure sub-growth to Ad-rev + Live Events provides a "stickier" revenue base. |
| NFLX Live Content | Mature | WWE and NFL partnerships are key to capturing "Linear TV" ad dollars. |
| Streaming Competition | Consolidated | Bundling among rivals (Disney/Max) is the biggest threat to NFLX's market share. |
| Geopolitical Risk | Regionalized | Localized content production (India, Korea) acts as a hedge against localized economic shocks. |
| Market Volatility (VIX) | Low-Mid (14-18) | Market is in a "buy-the-dip" regime for high-quality earnings compounders like NFLX. |
Conclusion for Traders#
Netflix enters 2026 as a matured cash-flow machine. The transition from a "subscriber-count" story to an "ARM and Ad-Tech" story is complete. Traders should watch for advertising fill rates and churn metrics during live event windows as the primary catalysts for stock movement. The macro-environment is currently a tailwind, providing a stable backdrop for continued capital return to shareholders.
FINAL INVESTMENT STANCE: ADVOCATE (on the basis of superior FCF generation and successful pivot to a multi-revenue stream model).
Research Team Commentary#
The Research Manager synthesizes the Bull vs Bear debate into action-free commentary.
Here is my assessment of the Netflix (NFLX) debate, applying the principles of the Berkshire Hathaway framework.
Summary of Arguments#
The Bull Case: The Bull argues that Netflix has successfully transitioned from a cash-burning growth stock to a cash-generating "Utility for Entertainment." They highlight the Economic Moat derived from scale—specifically the lowest cost-per-subscriber in the industry—which allows for superior content spend ($17B) while maintaining high margins. The Bull points to "Management Excellence" in pivoting to advertising and cracking down on password sharing, resulting in a projected 27.5% operating margin and $7.8B in Free Cash Flow. They view the stock as deeply undervalued (citing a "capitulation" price or technical low) relative to its earnings power.
The Bear Case: The Bear characterizes Netflix as a "Capital Treadmill"—a business that must spend exorbitant amounts ($17B+) annually just to maintain its current position, similar to the textile mills Buffett famously exited. They argue the Moat is eroding because content assets depreciate rapidly (unlike a brand like Coca-Cola), and competition from deep-pocketed ecosystem players (Amazon, Apple) destroys industry pricing power. The Bear flags the accounting discrepancy between amortized costs and actual cash spend ("hidden expenses") and argues that at a market price of $820 (42x P/E), there is zero Margin of Safety, invoking the "Growth Trap" where investors overpay for a maturing business.
Final Verdict#
Stance: WATCH
Investor Commentary#
Core Takeaway: A Wonderful Business on a Capital Treadmill, Priced for Perfection.
We are looking at a clear divergence between business quality and investment merit. Netflix has undeniably won the first phase of the streaming wars. Achieving 27% operating margins in a media business is a feat of management execution that Charlie Munger would have applauded. They have scaled the "castle walls" high enough that sub-scale competitors are retreating.
However, I cannot Advocate for a purchase at the current market reality described by the Bear ($820/share). The Bull's reliance on a "technical capitulation" price of ~$76 seems to be a dangerous misreading of market liquidity or a reliance on a momentary flash-crash scenario that does not reflect the actionable price. At ~$820, we are being asked to pay over 40x earnings for a company that is entering the "hard bundle" phase of its lifecycle—relying on ads and live sports rights.
The Bear’s "Capital Treadmill" argument is the most critical risk factor. Unlike See's Candies, where the recipe doesn't change and capital needs are low, Netflix must re-invest nearly all its depreciation just to keep the subscriber base flat. That is a difficult game to play at a 42x multiple.
Rationale: Why We Wait.
- The Valuation Disconnect: The first rule of value investing is Margin of Safety. If the Bear is correct that the quote is $820, paying 42x earnings requires a decade of flawless double-digit growth. With saturation setting in (hence the need for ads and sports), that growth is not guaranteed. We do not buy "wonderful businesses" at "speculative prices."
- The "Hamster Wheel" Risk: I am haunted by my past mistake with IBM. I saw "sticky" corporate contracts; I missed the platform shift. Here, the Bear makes a compelling point about the "Winner's Curse" in sports rights. If Netflix becomes just another cable bundle bidding for NFL rights, its Return on Invested Capital (ROIC) will naturally compress over time. The "Moat" of a low cost-per-sub is real, but the cost of the content itself is inflating.
- Accounting Reality: The discrepancy between Net Income and Free Cash Flow (the amortization gap mentioned by the Bear) is a classic warning sign. We want Owner Earnings—cash in the pocket after maintaining the competitive position. If the "maintenance capex" for content is rising faster than revenue, the GAAP earnings are overstating the business's true value.
Monitoring Plan: The "Fat Pitch" Checklist
We will keep Netflix on the WATCH list. It is a high-quality business that we would love to own, but only when Mr. Market offers a price that makes sense. Over the next 4 quarters, we will monitor:
- Cash Content Spend vs. Amortization: Does the gap widen? If Cash Spend consistently outpaces Amortization by $2B+, the Bear is right—accounting earnings are a mirage. We need to see these lines converge.
- Churn Retention During Price Hikes: The Bull claims pricing power. We need to verify this. If churn remains below industry averages during the next price increase, the "Consumer Monopoly" thesis holds.
- Ad-Tier Unit Economics: Is the ARM (Average Revenue per Member) on the ad tier actually accretive, or is it cannibalizing higher-margin ad-free subs?
- Price Action: We are looking for the price to approach the Bear's "Fair Value" range of $450-$500. At that level, the P/E compresses to ~20-25x, which is a fair price for a dominant media utility with these margins.
Self-Correction: Reflecting on my Kraft-Heinz error, I must be careful not to assume that a dominant market share equals an invincible brand. Consumer habits change. The Bear’s warning about "Linear TV 2.0" is valid. We must ensure Netflix isn't just becoming a more expensive version of the cable package we all cut the cord to escape. We will watch, but we will not swing yet.
Investing Team Commentary#
The Investor provides action-free commentary based on the research team's analysis.
In evaluating Netflix through the lens of a long-term business owner, we must distinguish between a spectacular achievement in management and a sound investment opportunity.
Netflix has accomplished what many thought impossible: they have built a global distribution system with a "Consumer Monopoly" on the streaming habit. However, from the perspective of the Berkshire framework, the business exhibits a fundamental tension that requires a disciplined approach.
The Value Investor’s Critique#
1. The Nature of the Moat: Brand vs. Content Treadmill A truly great business, like See’s Candies or Coca-Cola, possesses a moat where the product remains timeless and the capital requirements to maintain it are minimal. Netflix is different. It operates on a "Content Treadmill." To maintain its subscriber base, it must produce a constant stream of "new" hits. Unlike the secret formula for Coke, which hasn't changed in a century, Netflix’s "formula" must be reinvented every season. This makes its $17B+ annual spend more akin to "maintenance capex" than "growth investment." If the music stops, the subscribers leave.
2. Owner Earnings vs. GAAP Earnings We focus on Owner Earnings—the cash a business generates after reinvesting to maintain its competitive position. The Bear case correctly identifies the gap between amortization and actual cash spend. If Netflix is spending $17B in cash but only amortizing $13B, the reported net income is overstating the "spendable" cash available to shareholders. At a 42x P/E, the market is pricing the company as if every dollar of earnings is "free" for distribution, ignoring the massive reinvestment required just to stand still.
3. Contrarian Insight: The "Sports Trap" The market is currently euphoric about Netflix's move into live sports (NFL, WWE). While this boosts short-term sentiment, a value investor sees a long-term risk. Live sports rights are the ultimate commodity auction. Entering this arena pits Netflix against players with infinite pockets (Apple, Amazon, and Nation-States) in a race where the winner often suffers the "Winner’s Curse"—paying so much for the rights that the Return on Invested Capital (ROIC) is destroyed. This moves Netflix away from being a "Software/Studio" hybrid and closer to being "Cable 2.0."
4. The Margin of Safety The primary rule is: Price is what you pay; value is what you get. At $820 per share, the market is discounting a future of perfect execution, permanent pricing power, and successful ad-tier scaling. In our world, "priced for perfection" is synonymous with "lacking a margin of safety." If growth slows by even 2% or content costs inflate faster than expected, the valuation multiple will contract violently.
Business Quality Assessment#
- Management: Superior. Their ability to pivot to advertising and crack down on password sharing shows capital allocation agility.
- Moat: Wide, but expensive to maintain. It is a "Scale Moat," not a "Low-Cost Asset Moat."
- Financials: Improving, but the debt load and content liabilities require a watchful eye.
Conclusion#
Netflix is a "Wonderful Business" that I would be proud to own—but not at this price. The current valuation requires us to speculate on future growth rather than buy based on current intrinsic value. We do not swing at every pitch; we wait for the "Fat Pitch" where the business quality is high and the price is undeniably low.
FINAL INVESTMENT STANCE: WATCH
Deep Values Commentary#
The Risk Management Team debates and the Portfolio Manager provides final action-free commentary.
Here is the risk commentary and updated investment plan, evaluated through the lens of the Berkshire Hathaway value investing framework.
Executive Summary: The "Castle" is Strong, but the "Toll Bridge" is Expensive#
The debate highlights a classic tension in modern value investing: the conflict between Business Momentum (The Bull) and Capital Discipline (The Bear).
- The Bull (Risky Analyst) argues that Netflix has achieved "Escape Velocity." They view the $17B content spend not as a cost, but as an insurmountable moat that generates high-margin ad revenue. They see the current price dip as a technical capitulation and a buying opportunity.
- The Bear (Safe Analyst) counters that the business is a "Capital Treadmill." They argue that at 42x earnings, the market is pricing a mature utility as if it were still a hyper-growth startup. They see the move into live sports as a margin-eroding war against deep-pocketed tech giants (Amazon/Apple).
- The Neutral Analyst suggests a middle ground: The business model is shifting positively (Ads), but catching a "falling knife" is dangerous. They advise waiting for technical stability rather than aiming for a specific valuation floor.
My Verdict: While the Bull is correct about the business quality (Operating Margins of 28% are excellent), the Bear is correct about the math. We do not pay "perfect prices" for "wonderful businesses" when interest rates are non-zero. The transition to Live Sports introduces execution risk that the current multiple does not discount.
Final Verdict#
Stance: WATCH
Risk Commentary & Rationale#
1. Valuation Risk: The "Growth Trap" is Real The Risky Analyst argues that a 40x P/E is a "discount" compared to the historical average of 89x. We reject this logic. As the Safe Analyst correctly noted, "You cannot value a mature giant using the multiples of a high-growth startup." Buffett teaches us that as a business scales, its growth naturally slows (law of large numbers). Paying 42x earnings requires Netflix to grow at rates that are mathematically improbable for a company with its current penetration. We are looking for Owner Earnings, and right now, the price implies a future cash flow stream that leaves zero Margin of Safety.
2. The "Capital Treadmill" vs. The "Flywheel" This is the crux of the debate. * The Bull says: $17B spend is a "barrier to entry." * The Bear says: It is a "recurring liability" and a "millstone." From a risk perspective, we side with the Bear here. Unlike See's Candies (which requires little capital to maintain dominance), Netflix must re-spend its profits every year just to keep subscribers from churning. The Bear's warning about the "Sports Trap" is prescient: "Entering the live sports arena... pits the company against Apple and Amazon, entities that treat content spend as a rounding error." If Netflix gets into a bidding war for rights, Return on Invested Capital (ROIC) will compress.
3. Technicals vs. Fundamentals The Risky Analyst cites an RSI of 27 as a "buy signal." The Neutral Analyst calls this "jumping in front of a freight train." Value investors do not buy based on RSI, but we do respect Mr. Market's mood. The Neutral Analyst makes a valid point: there is no need to be a hero and buy the first dip. However, we disagree with the Neutral Analyst's suggestion to buy merely on "price stability." We buy on Value, not just because the price stopped falling. We will wait until the price reflects the Safe Analyst's intrinsic value assessment, not just a MACD crossover.
Refined Investor Plan: The "Fat Pitch" Strategy#
We are keeping the WATCH stance. The investor’s original plan was sound, but we will tighten the entry criteria based on the debate insights regarding the "Ad-Tier" shift.
Objective: Acquire a "Consumer Monopoly" at a price that offers a Margin of Safety against execution risk in the Live Sports transition.
1. Price Target Adjustment * Original Plan: $450-$500. * Debate Insight: The Neutral Analyst correctly identifies that the Ad-Tier changes the margin profile structurally. The Bear’s DCF fair value is ~$624. * New "Strike Zone": $550 - $600. * Reasoning: We will raise our floor slightly to account for the structural margin improvement (28%) mentioned by the Bull, but we refuse to pay $820. Buying at ~$580 implies a P/E of ~25-28x, which is fair for a dominant media utility.
2. The "Red Flag" Monitor (Updated) We will monitor specific metrics over the next 2 quarters to validate the "Moat": * Content Amortization vs. Cash Spend: (As originally planned). If Cash Spend > Amortization by >$2B, the "Accounting Reality" risk cited by the Bear is confirmed. * Ad-Tier Cannibalization: We need to know if the Bull's "Gold Mine" is real. Are Ad-Tier users generating higher ARM (Average Revenue per Member) than Standard users? If not, the Ad pivot is a wash. * Sports Rights ROIC: Watch the cost of the next major sports deal. If they overpay for rights (e.g., NBA/NFL), the Bear's "Commodity Auction" thesis is winning.
3. Addressing Past Mistakes (Self-Correction) * Reflection on IBM: I previously bought IBM because it looked "cheap" and had "sticky" clients, missing the cloud platform shift. * Application to NFLX: The Bear calls Netflix "Cable 2.0." This is the IBM risk. If Netflix becomes just a pipe for other people's sports rights (NFL/WWE), they lose their pricing power. We must ensure they own the intellectual property (like Squid Game), not just lease the distribution rights (like NFL games). We only buy if the mix stays heavy on Owned IP.
Final Instruction: Do not swing yet. The "Fear of Missing Out" (FOMO) expressed by the Risky Analyst ("missing the breakout of the century") is the enemy of the intelligent investor. Let the price come to us.
Stance: WATCH
Report generated by Deep Value Intelligence on 2026-02-16 00:59:04