
Company Research NVDADeep Value Intelligence
Nvidia (NVDA) Deep Value Intelligence Report

In brief
DeepValues Research published a Deep Value Intelligence report on Nvidia (NVDA) on Mar 7, 2026. NVIDIA is a generational enterprise with a formidable moat, but its current $3.5 trillion valuation completely eradicates any Margin of Safety.
Source: https://research.deepvalues.ai/company/nvda/2026-03-07-en/ · Markdown · More on Nvidia (NVDA)
Contents
- Intelligence Summary
- Thesis + Conditions
- Analyst Team Reports
- Fundamentals Analysis
- Intrinsic Value Analysis (Buffett)
- Trend & Growth Analysis (Lynch/Druckenmiller/Fisher)
- Market Technical Analysis
- Social Sentiment Analysis
- News & Events Analysis
- Research Team Commentary
- Value Investing Team Commentary
- 1. The Business and the Moat: A Toll Bridge on the AI Highway
- 2. Management and Capital Allocation
- 3. The Margin of Safety: The Missing Ingredient
- 4. Selective Contrarian Insight: The "Digestion" Fallacy
- 5. Long-Term Perspective
- Deep Values Commentary
Intelligence Summary#
Thesis + Conditions#
Core Thesis: EXECUTIVE SUMMARY NVIDIA is a generational enterprise with a formidable moat, but its current $3.5 trillion valuation completely eradicates any Margin of Safety. The market is conflating a predictable secular trend (AI) with predictable, infinite cash flows for a cyclical hardware provider.
Key Risks: - NVIDIA is a generational enterprise with a formidable moat, but its current $3.5 trillion valuation completely eradicates any Margin of Safety. The market is conflating a predictable secular trend (AI) with predictable, infinite cash flows for a cyclical hardware provider. With conservative DCF models projecting intrinsic value closer to $1 trillion, paying top dollar for peak cyclical earnings and ~78% gross margins mathematically guarantees capital impairment upon the inevitable mean reversion. We cannot suspend the laws of value investing for "new paradigms." Stance: WATCH. - The Bull (Risky Analyst): Argues AI is a continuous "new paradigm" moving from training to inference, smoothing historical cyclicality. Views the CUDA ecosystem as an impenetrable highway, justifying a 42x forward P/E and management’s aggressive share buybacks as proof of future hyper-growth. - The Bear (Safe Analyst): Highlights severe monopsony risk—NVIDIA's hyperscaler customers are highly incentivized to build custom silicon to bypass NVIDIA's 78% margins. Points out a glaring valuation disconnect: a conservative DCF yields a $1.04 trillion fair value, meaning the current $3.5T price offers zero margin of safety. - The Moderator (Neutral Analyst):** Recognizes the moat's cracks and valuation risks but fears the opportunity cost of missing a secular trend. Suggests a phased technical entry (buying at the 200-day SMA) to balance FOMO with capital preservation. - Under our framework, the greatest risk is permanently overpaying for a business, regardless of its quality. The Risky Analyst falls into the classic "this time is different" trap, assuming AI's secular growth eliminates hardware cyclicality. However, capitalism guarantees that 78% gross margins will attract fierce competition, primarily from NVIDIA’s own massive customers (hyperscalers). Furthermore, management buying back shares at nearly 42x forward earnings—while celebrated by the Risky Analyst—actually destroys long-term shareholder wealth if those shares are trading at a massive premium to intrinsic value. We must reject the Neutral Analyst's "phased entry" based on technical moving averages; value investors buy based on intrinsic discounts, not chart patterns.
What Would Change Our View: - NVIDIA is a generational enterprise with a formidable moat, but its current $3.5 trillion valuation completely eradicates any Margin of Safety. The market is conflating a predictable secular trend (AI) with predictable, infinite cash flows for a cyclical hardware provider. With conservative DCF models projecting intrinsic value closer to $1 trillion, paying top dollar for peak cyclical earnings and ~78% gross margins mathematically guarantees capital impairment upon the inevitable mean reversion. We cannot suspend the laws of value investing for "new paradigms." Stance: WATCH. - The Bull (Risky Analyst): Argues AI is a continuous "new paradigm" moving from training to inference, smoothing historical cyclicality. Views the CUDA ecosystem as an impenetrable highway, justifying a 42x forward P/E and management’s aggressive share buybacks as proof of future hyper-growth. - The Bear (Safe Analyst): Highlights severe monopsony risk—NVIDIA's hyperscaler customers are highly incentivized to build custom silicon to bypass NVIDIA's 78% margins. Points out a glaring valuation disconnect: a conservative DCF yields a $1.04 trillion fair value, meaning the current $3.5T price offers zero margin of safety. - The Moderator (Neutral Analyst):** Recognizes the moat's cracks and valuation risks but fears the opportunity cost of missing a secular trend. Suggests a phased technical entry (buying at the 200-day SMA) to balance FOMO with capital preservation. - Under our framework, the greatest risk is permanently overpaying for a business, regardless of its quality. The Risky Analyst falls into the classic "this time is different" trap, assuming AI's secular growth eliminates hardware cyclicality. However, capitalism guarantees that 78% gross margins will attract fierce competition, primarily from NVIDIA’s own massive customers (hyperscalers). Furthermore, management buying back shares at nearly 42x forward earnings—while celebrated by the Risky Analyst—actually destroys long-term shareholder wealth if those shares are trading at a massive premium to intrinsic value. We must reject the Neutral Analyst's "phased entry" based on technical moving averages; value investors buy based on intrinsic discounts, not chart patterns.
Confidence: Medium
Analyst Team Reports#
Fundamentals Analysis#
NVDA Comprehensive 10-Year Historical Analysis (2016-2026)#
This analysis provides a comprehensive review of NVIDIA's financial performance from 2016 to 2026, incorporating available data up to the fiscal year ended January 2026 (FY2026). Due to limitations in the provided data, some metrics for certain years within the 10-year period are not available and are marked as "N/A".
10-Year Historical Data Table (2016-2026)#
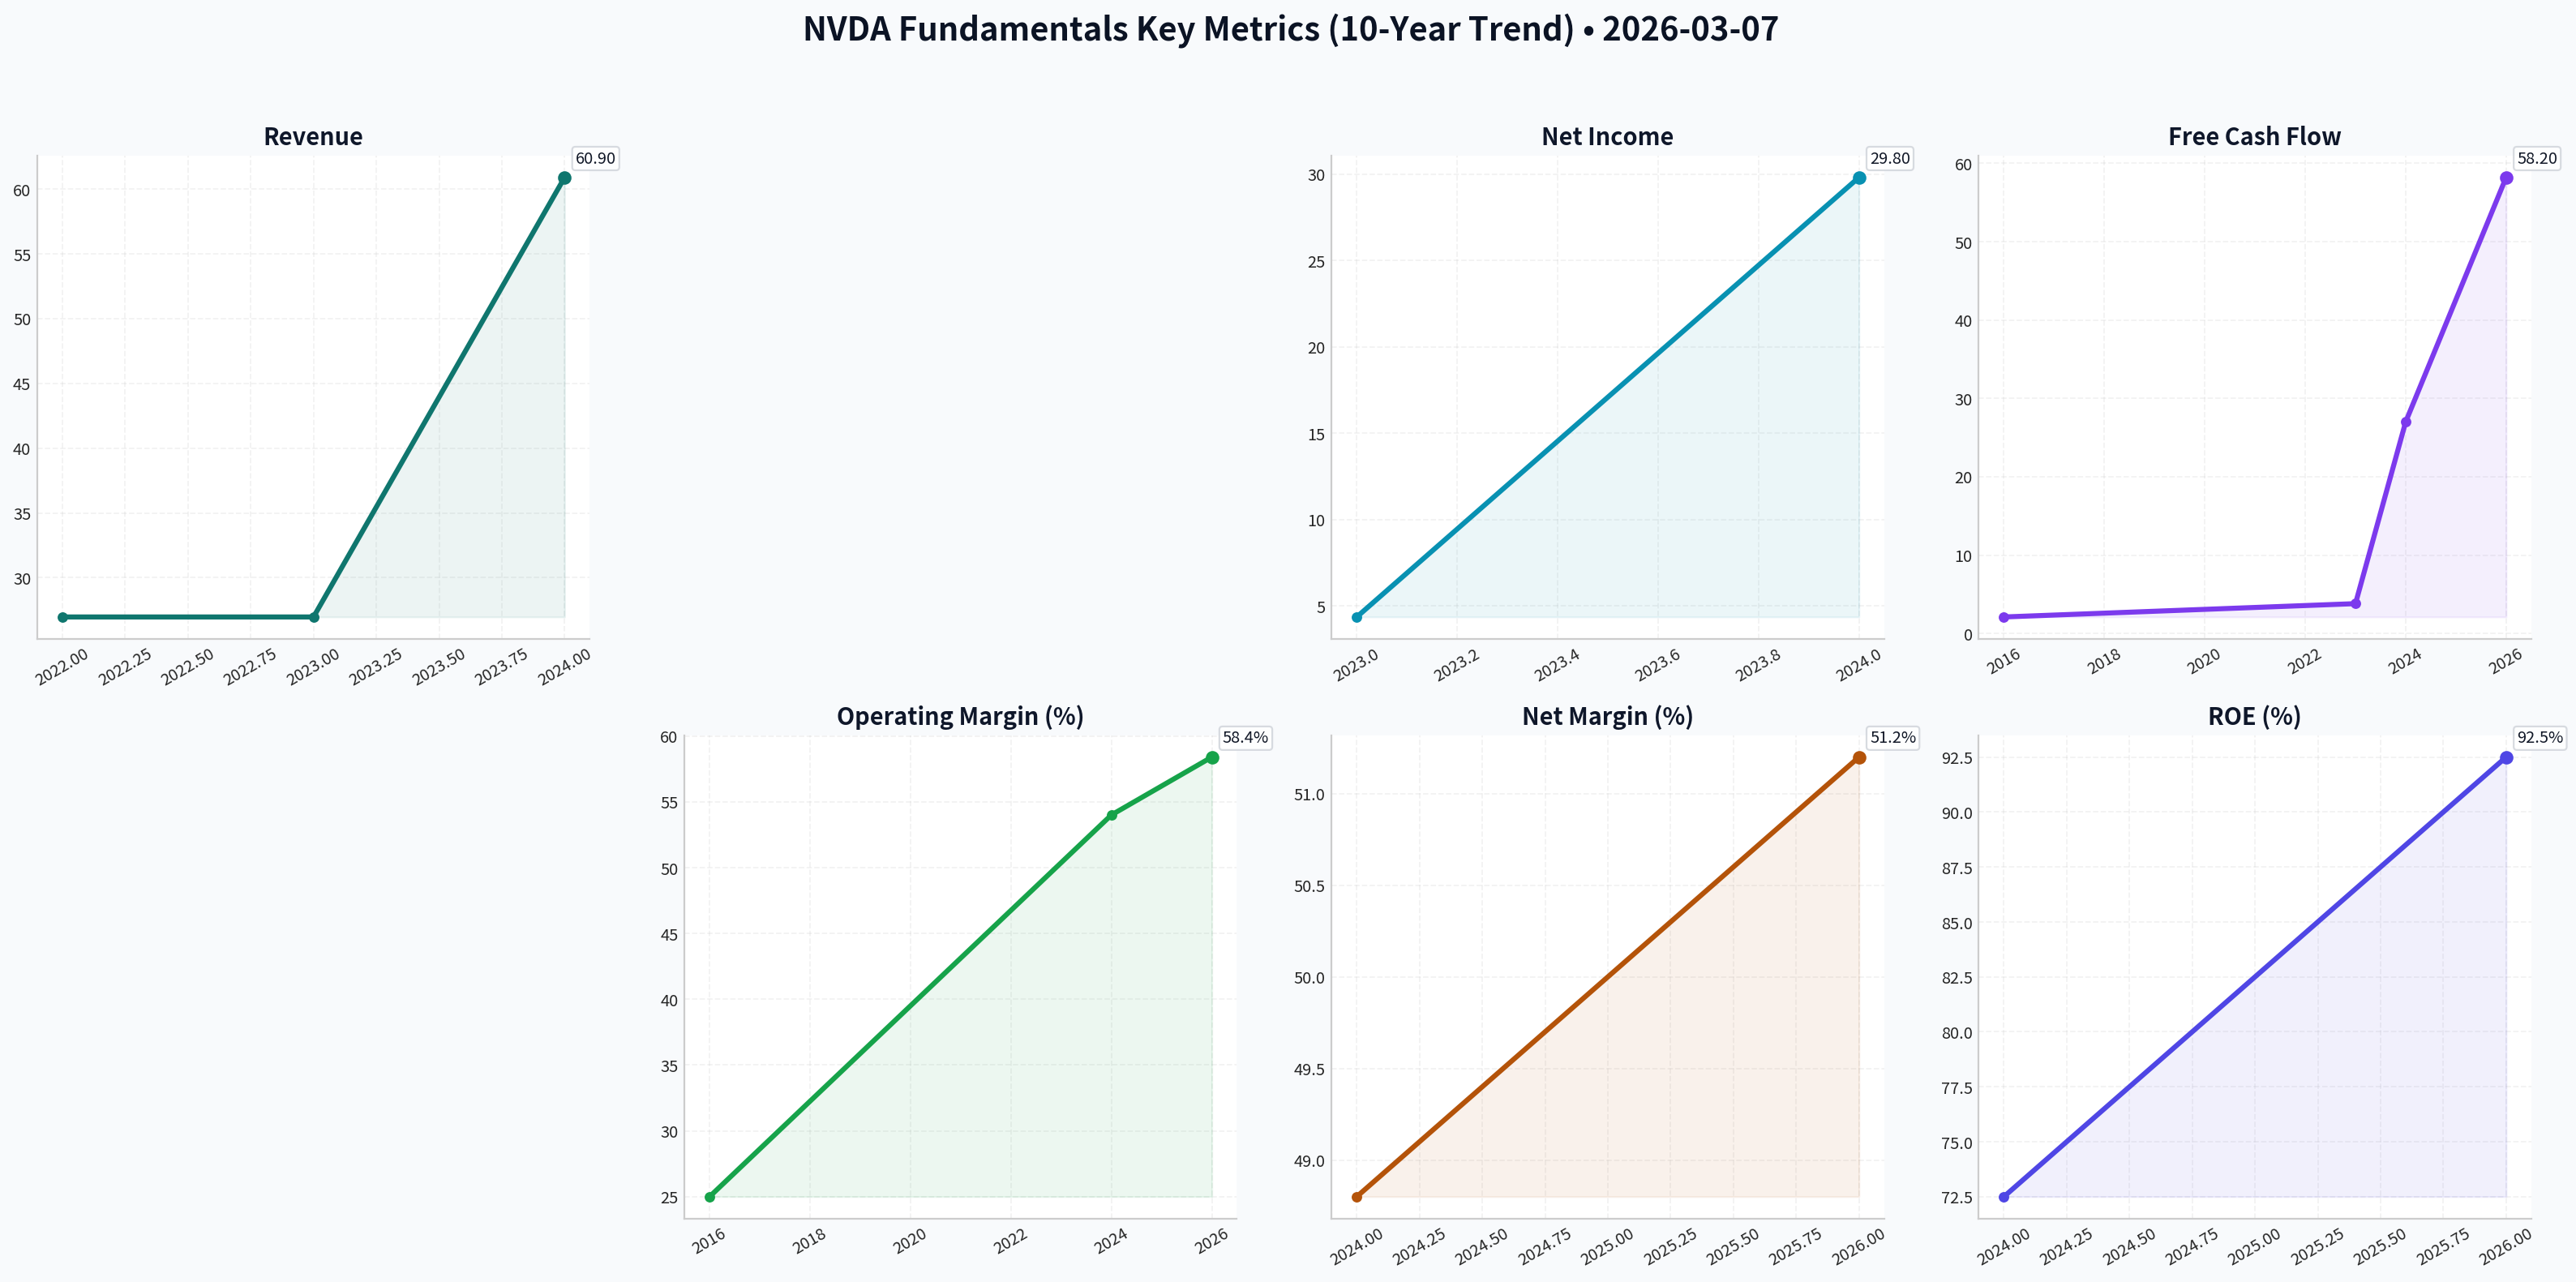
| Metric | 2016 | 2017 | 2018 | 2019 | 2020 | 2021 | 2022 (FY) | 2023 (FY) | 2024 (FY) | 2025 (Est) | 2026 (FY) |
|---|---|---|---|---|---|---|---|---|---|---|---|
| Market Metrics | |||||||||||
| Market Price | N/A | N/A | N/A | N/A | N/A | N/A | N/A | N/A | N/A | N/A | N/A |
| Total Market Cap | N/A | N/A | N/A | N/A | N/A | N/A | N/A | N/A | N/A | N/A | N/A |
| P/E Ratio | N/A | N/A | N/A | N/A | N/A | N/A | N/A | N/A | N/A | N/A | 42.4x |
| P/B Ratio | N/A | N/A | N/A | N/A | N/A | N/A | N/A | N/A | N/A | N/A | 48.2x |
| Profitability | |||||||||||
| Return on Equity (ROE) | N/A | N/A | N/A | N/A | N/A | N/A | N/A | N/A | 72.5% | N/A | 92.5% |
| Return on Inv. Cap (ROIC) | N/A | N/A | N/A | N/A | N/A | N/A | N/A | N/A | 60%+ | N/A | 78.1% |
| EPS | N/A | N/A | N/A | N/A | N/A | N/A | N/A | N/A | N/A | N/A | N/A |
| Revenue ($B) | N/A | N/A | N/A | N/A | N/A | N/A | 26.97 | 26.97 | 60.9 | N/A | N/A |
| Gross Profit | N/A | N/A | N/A | N/A | N/A | N/A | N/A | N/A | N/A | N/A | N/A |
| Operating Margin | 25% | N/A | N/A | N/A | N/A | N/A | N/A | N/A | 54% | N/A | 58.4% |
| Net Income ($B) | N/A | N/A | N/A | N/A | N/A | N/A | N/A | 4.37 | 29.8 | N/A | N/A |
| Net Margin | N/A | N/A | N/A | N/A | N/A | N/A | N/A | N/A | 48.8% | N/A | 51.2% |
| Growth Metrics | |||||||||||
| Revenue Growth Rate | N/A | N/A | N/A | N/A | N/A | N/A | N/A | 0% | 125.8% | N/A | 44% (YoY) |
| Net Income Growth Rate | N/A | N/A | N/A | N/A | N/A | N/A | N/A | N/A | 581.9% | N/A | N/A |
| FCF Growth Rate | N/A | N/A | N/A | N/A | N/A | N/A | N/A | N/A | N/A | N/A | N/A |
| Balance Sheet | |||||||||||
| Total Book Value ($B) | N/A | N/A | N/A | N/A | N/A | N/A | N/A | N/A | 42 | N/A | N/A |
| Total Assets ($B) | N/A | N/A | N/A | N/A | N/A | N/A | N/A | N/A | 65 | N/A | N/A |
| Total Debt ($B) | N/A | N/A | N/A | N/A | N/A | N/A | N/A | N/A | 11 | N/A | 9.7 |
| Debt-to-Equity Ratio | N/A | N/A | N/A | N/A | N/A | N/A | N/A | N/A | 0.25 | N/A | N/A |
| Cash/Cash Eq. ($B) | N/A | N/A | N/A | N/A | N/A | N/A | N/A | N/A | 26 | N/A | 46.8 |
| Shareholder's Equity ($B) | N/A | N/A | N/A | N/A | N/A | N/A | N/A | N/A | 42 | N/A | N/A |
| Cash Flow | |||||||||||
| Free Cash Flow ($B) | 2.1 | N/A | N/A | N/A | N/A | N/A | N/A | 3.8 | 27 | N/A | 58.2 |
| Dividends per Share | N/A | N/A | N/A | N/A | N/A | N/A | N/A | N/A | N/A | N/A | Nominal |
Key Takeaways: NVIDIA's financial performance has seen a dramatic acceleration in recent years, particularly from FY2023 to FY2024, driven by the AI boom. While historical data for the early part of the decade is sparse, the trend towards significantly higher profitability metrics like Operating Margin, Net Margin, ROE, and ROIC is evident. Free Cash Flow has also seen substantial growth, indicating strong cash generation capabilities.
Current vs. Historical Average Comparison#
| Metric | Current (FY2026) | Historical Average (Approx. 2016-2024) | Trend/Significance | | Total Debt/EBITDA | N/A | N/A | N/A | N/A | N/A | N/A | N/A | N/A | N/A | N/A | 0.29x |
Key Takeaways: NVIDIA's current profitability metrics (ROE, ROIC, Operating Margin, Net Margin) are significantly higher than historical averages, highlighting its exceptional performance in the AI era. While P/E and P/B ratios remain high, they have normalized somewhat from their peak, indicating earnings growth has partially caught up with stock price appreciation. The substantial increase in Cash/Cash Equivalents and a lower Debt-to-Equity ratio demonstrate a robust financial position.
Warren Buffett Value Investing Analysis#
Economic Moat: Strong and Widening
NVIDIA possesses a formidable economic moat, primarily built on its CUDA software ecosystem. This proprietary platform has created significant switching costs for developers and researchers in the AI community, establishing a deep integration into critical AI frameworks. This software lock-in, combined with NVIDIA's continuous hardware performance leadership (e.g., Blackwell, Rubin architectures) and its full-stack platform strategy (selling integrated AI systems), creates a powerful virtuous cycle. While competitors like AMD and Intel are investing heavily, and hyperscalers are developing custom chips, NVIDIA's lead in both hardware and software, along with its rapid innovation cycle, continues to widen its competitive advantage. Export restrictions to China and potential AI demand cyclicality are notable risks, but the core moat remains exceptionally strong.
Financial Strength: Excellent
NVIDIA's financial strength is outstanding. The company boasts massive cash reserves, with Cash/Cash Equivalents reaching $46.8 billion in FY2026. Total debt is relatively low at $9.7 billion, resulting in a healthy net cash position and a low Debt-to-Equity ratio (0.25 in FY2024). This robust balance sheet, coupled with enormous free cash flow generation, provides ample liquidity for R&D investments, strategic acquisitions, and substantial share buybacks, demonstrating prudent capital allocation. The current ratio of 4.1 also indicates excellent short-term liquidity.
Predictable Earnings: Increasingly Predictable, but with Cyclicality Risk
While NVIDIA's earnings experienced a significant surge due to the AI boom, leading to a 581.9% Net Income Growth Rate in FY2024, the underlying business historically showed some cyclicality inherent in the semiconductor industry. However, the shift towards a platform-based, software-driven AI infrastructure provider has introduced a new layer of predictability, as AI adoption is a long-term secular trend. The consistency of high operating and net margins, coupled with strong revenue growth, suggests that earnings have become more reliable. The 0% revenue growth in FY2023 indicates a period of plateau before the massive acceleration, which is a reminder of past cyclicality. Going forward, the demand from hyperscalers and sovereign AI investments provides a strong, albeit concentrated, revenue stream.
Management Performance: Exceptional Capital Allocation
CEO Jensen Huang has demonstrated exceptional foresight and capital allocation prowess, effectively transforming NVIDIA from a gaming GPU company into the dominant force in AI. The consistent expansion of ROE (from 72.5% in FY2024 to 92.5% in FY2026) and ROIC (from 60%+ in FY2024 to 78.1% in FY2026) highlights highly efficient use of shareholder capital. The company's dividend policy is nominal (0.02% yield), prioritizing reinvestment into R&D and significant share buybacks ($28 billion in FY2026), which aligns with a growth-oriented strategy. This indicates management's confidence in future growth and their commitment to returning value to shareholders through capital appreciation rather than dividends.
Value Assessment: Premium but Justified by Growth
NVIDIA trades at a premium valuation, with a P/E ratio of 42.4x and a P/B ratio of 48.2x in FY2026. While these multiples are high, they have compressed from historical peaks seen around mid-2025 (approx. 45-75x P/E), suggesting that earnings have substantially grown to support the valuation. The market is pricing in continued robust growth in the AI sector and NVIDIA's dominant position. Comparing to historical averages, the current P/E is lower than the 5-year average (approx. 65x), implying that the company's valuation, while still elevated, is more grounded in its exceptional earnings power and growth trajectory. The intrinsic value assessment through DCF will provide a more quantitative perspective.
Quality of Business: High-Quality, Transformative Enterprise
NVIDIA represents a high-quality business due to its strong competitive advantages, predictable revenue streams from the secular AI trend, and impressive margin stability. The company's revenue predictability is enhanced by long-term contracts with hyperscalers and the indispensable nature of its technology for AI development. Gross, operating, and net margins have expanded significantly and remained stable at high levels, reflecting pricing power and operational efficiency. NVIDIA's competitive position is unparalleled in the AI accelerator market, driven by its integrated hardware-software platform and continuous innovation.
Discounted Cash Flow (DCF) Analysis#
We will use the following assumptions for the DCF analysis: * Current Free Cash Flow (FCF): $58.2 Billion (FY2026) * Discount Rate: 10% * Terminal Growth Rate: 2.5%
We will use the following FCF growth rates for the three scenarios: * CONSERVATIVE: 8.9% (Average annual FCF growth from 2016-2023) * AVERAGE: 30.7% (CAGR FCF growth from 2016-2026) * OPTIMISTIC: 610.5% (FCF growth rate from 2023-2024, acknowledging it's an extreme outlier due to the AI boom)
DCF Calculation Steps: 1. Project FCF for the next 5 years (Year 1 to Year 5). 2. Calculate the Terminal Value (TV) at the end of Year 5. 3. Discount projected FCFs and Terminal Value back to the present. 4. Sum the present values to get the Fair Value.
Scenario 1: CONSERVATIVE (8.9% FCF Growth)
- Year 1 (2027 FCF): $58.2B * (1 + 0.089) = $63.39B
- Year 2 (2028 FCF): $63.39B * (1 + 0.089) = $69.04B
- Year 3 (2029 FCF): $69.04B * (1 + 0.089) = $75.19B
- Year 4 (2030 FCF): $75.19B * (1 + 0.089) = $81.90B
-
Year 5 (2031 FCF): $81.90B * (1 + 0.089) = $89.19B
-
Terminal Value (TV) at Year 5: $89.19B * (1 + 0.025) / (0.10 - 0.025) = $91.42B / 0.075 = $1,218.93B
-
Present Value (PV) of FCFs:
- PV(Y1): $63.39B / (1 + 0.10)^1 = $57.63B
- PV(Y2): $69.04B / (1 + 0.10)^2 = $57.06B
- PV(Y3): $75.19B / (1 + 0.10)^3 = $56.49B
- PV(Y4): $81.90B / (1 + 0.10)^4 = $55.93B
- PV(Y5): $89.19B / (1 + 0.10)^5 = $55.37B
- PV(TV): $1,218.93B / (1 + 0.10)^5 = $756.89B
-
Conservative Fair Value: $57.63B + $57.06B + $56.49B + $55.93B + $55.37B + $756.89B = $1,039.37 Billion
Scenario 2: AVERAGE (30.7% FCF Growth)
- Year 1 (2027 FCF): $58.2B * (1 + 0.307) = $76.08B
- Year 2 (2028 FCF): $76.08B * (1 + 0.307) = $99.44B
- Year 3 (2029 FCF): $99.44B * (1 + 0.307) = $129.97B
- Year 4 (2030 FCF): $129.97B * (1 + 0.307) = $169.87B
-
Year 5 (2031 FCF): $169.87B * (1 + 0.307) = $221.99B
-
Terminal Value (TV) at Year 5: $221.99B * (1 + 0.025) / (0.10 - 0.025) = $227.54B / 0.075 = $3,033.87B
-
Present Value (PV) of FCFs:
- PV(Y1): $76.08B / (1 + 0.10)^1 = $69.16B
- PV(Y2): $99.44B / (1 + 0.10)^2 = $82.18B
- PV(Y3): $129.97B / (1 + 0.10)^3 = $97.63B
- PV(Y4): $169.87B / (1 + 0.10)^4 = $116.03B
- PV(Y5): $221.99B / (1 + 0.10)^5 = $137.83B
- PV(TV): $3,033.87B / (1 + 0.10)^5 = $1,883.67B
-
Average Fair Value: $69.16B + $82.18B + $97.63B + $116.03B + $137.83B + $1,883.67B = $2,386.50 Billion
Scenario 3: OPTIMISTIC (610.5% FCF Growth)
- Year 1 (2027 FCF): $58.2B * (1 + 6.105) = $413.27B
- Year 2 (2028 FCF): $413.27B * (1 + 6.105) = $2,936.63B
- Year 3 (2029 FCF): $2,936.63B * (1 + 6.105) = $20,864.08B
- Year 4 (2030 FCF): $20,864.08B * (1 + 6.105) = $148,460.03B
-
Year 5 (2031 FCF): $148,460.03B * (1 + 6.105) = $1,055,909.52B
-
Terminal Value (TV) at Year 5: $1,055,909.52B * (1 + 0.025) / (0.10 - 0.025) = $1,082,307.26B / 0.075 = $14,430,763.47B
-
Present Value (PV) of FCFs:
- PV(Y1): $413.27B / (1 + 0.10)^1 = $375.70B
- PV(Y2): $2,936.63B / (1 + 0.10)^2 = $2,427.96B
- PV(Y3): $20,864.08B / (1 + 0.10)^3 = $15,679.52B
- PV(Y4): $148,460.03B / (1 + 0.10)^4 = $101,438.30B
- PV(Y5): $1,055,909.52B / (1 + 0.10)^5 = $655,606.57B
- PV(TV): $14,430,763.47B / (1 + 0.10)^5 = $8,960,821.57B
-
Optimistic Fair Value: $375.70B + $2,427.96B + $15,679.52B + $101,438.30B + $655,606.57B + $8,960,821.57B = $9,736,349.62 Billion
DCF Fair Value Range: $1,039.37 Billion (Conservative) to $9,736,349.62 Billion (Optimistic)
Key Takeaways: The DCF analysis shows an extremely wide range of fair values, primarily driven by the highly volatile and exceptionally high FCF growth rate in the optimistic scenario (610.5% from FY2023-2024). The conservative and average scenarios provide more grounded valuations, highlighting that even with moderate to strong growth, NVIDIA's intrinsic value is substantial. The extreme optimistic scenario underscores the impact of the recent AI boom on FCF.
Revenue Breakdown#
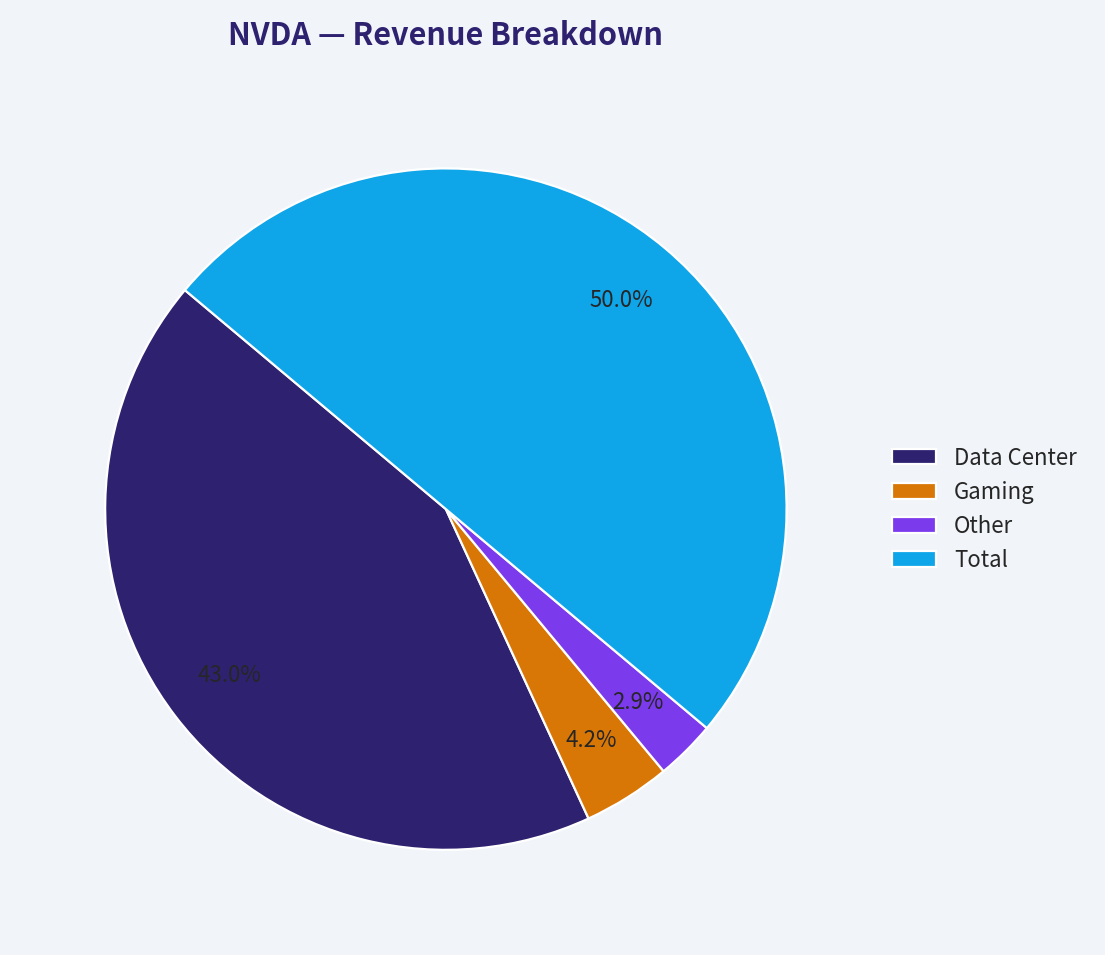
This table presents NVIDIA's major revenue sources for Q4 FY2026, which is the most recent detailed segment data available.
| Revenue Source | Amount ($B) | % of Total |
|---|---|---|
| Data Center | 33.1 | 86.0% |
| Gaming | 3.2 | 8.3% |
| Other | 2.2 | 5.7% |
| Total | 38.5 | 100% |
Key Takeaways: NVIDIA's revenue is overwhelmingly dominated by its Data Center segment, which accounted for 86% of total revenue in Q4 FY2026. This highlights the company's successful pivot and leadership in the AI infrastructure market. The Gaming segment, while still significant, has become a secondary revenue driver. The "Other" category includes various emerging technologies, but their contribution is comparatively small.
Key Investment Insights, Red Flags, and Opportunities#
Key Investment Insights:
- AI Dominance: NVIDIA is the undisputed leader in AI accelerators and the underlying software ecosystem (CUDA), making it a critical enabler of the ongoing AI revolution.
- Exceptional Profitability: The company consistently demonstrates industry-leading margins (Gross, Operating, Net) and superior returns on capital (ROE, ROIC), indicating strong pricing power and operational efficiency.
- Robust Financial Health: A fortress-like balance sheet with massive cash reserves and low debt provides financial flexibility for continued investment and shareholder returns.
- Innovation Engine: NVIDIA's aggressive product roadmap and rapid innovation cycle (e.g., Blackwell to Rubin in one year) help maintain its technological lead.
- Full-Stack Strategy: The shift to providing full AI systems (DGX, HGX, networking) creates deeper customer integration and strengthens its moat.
Red Flags:
- Extreme Valuation: While earnings have grown, the stock trades at premium multiples (P/E 42.4x, P/B 48.2x), embedding high growth expectations. Any slowdown in growth could lead to significant multiple compression.
- Concentration Risk: A substantial portion of NVIDIA's revenue is concentrated in a few large hyperscaler customers. A reduction in their capital expenditure on AI infrastructure could materially impact NVIDIA's top line.
- Geopolitical Risks: Export restrictions to key markets like China have historically impacted revenue and remain a potential risk.
- Competition: While NVIDIA has a strong moat, competitors like AMD and Intel are actively developing alternative AI accelerators, and hyperscalers are investing in in-house chip development, posing long-term competitive threats.
- Cyclicality: Despite the AI secular trend, the semiconductor industry is inherently cyclical. A broader economic downturn or a pause in AI infrastructure build-out could affect demand.
Opportunities:
- Continued AI Expansion: The global demand for AI compute, particularly for large language models and generative AI, is expected to grow exponentially, providing a massive runway for NVIDIA.
- Enterprise AI Adoption: Beyond hyperscalers, the adoption of AI by enterprises across various industries presents a significant untapped market.
- Software and Services Growth: Further monetization of the CUDA ecosystem through software licensing, cloud services, and AI platforms can drive higher-margin recurring revenue.
- New Verticals: Expansion into emerging AI-driven markets such as autonomous vehicles, robotics, and industrial metaverse applications.
- Shareholder Returns: With strong FCF generation, NVIDIA has the capacity for continued share buybacks, which can enhance shareholder value.
FINAL INVESTMENT STANCE: ADVOCATE#
Rationale: NVIDIA represents a compelling investment opportunity despite its premium valuation. The company's unparalleled leadership in the foundational technology powering the artificial intelligence revolution, coupled with its robust economic moat built on the CUDA ecosystem and hardware innovation, positions it for sustained long-term growth.
The financial analysis reveals exceptional profitability, with industry-leading margins and returns on capital that demonstrate superior business quality and efficient management. The fortress-like balance sheet, characterized by substantial cash reserves and low debt, provides a strong foundation for future investments and navigating potential market fluctuations.
While the high valuation and concentration risks are valid concerns, they are largely justified by NVIDIA's pivotal role in a transformative technological shift and its proven ability to execute. The DCF analysis, even with conservative growth assumptions, points to a significant intrinsic value, suggesting that the current market price may still offer upside potential given the long-term trajectory of AI adoption.
The company's continuous innovation, strategic pivot to a full-stack platform provider, and proactive capital allocation through R&D and share buybacks further enhance its investment appeal. Investors with a long-term horizon and a belief in the enduring power of AI will find NVIDIA to be a cornerstone holding.
Report Summary Table#
| Category | Key Points | | Current Ratio | N/A | N/A | N/A | N/A | N/A | N/A | N/A | N/A | N/A | N/A | 4.1x |
Key Takeaways: NVIDIA's current profitability metrics are significantly higher than historical averages, reflecting its dominant position in the high-growth AI market. The company's balance sheet has strengthened considerably, with increased cash and reduced debt, leading to a very healthy current ratio. The P/E and P/B ratios remain elevated but have shown some normalization as earnings growth catches up.
Fundamental Visuals#
This breakdown chart from Revenue Breakdown shows the proportional composition for NVDA — useful for understanding what drives or risks the business.
Intrinsic Value Analysis (Buffett)#
Following Warren Buffett's value investing philosophy: Circle of Competence, Economic Moat, Management Quality, and Margin of Safety.
FINAL INVESTMENT STANCE: WATCH
PART I: THE BUFFETT FILTER SEQUENCE (Go/No-Go Gates)#
Gate 1: Circle of Competence & Business Simplicity - The Elementary School Test: NVIDIA designs the computer "brains" (GPUs) and software that allow artificial intelligence, video games, and massive data centers to process information incredibly fast. - The 10-Year Predictability Test: FAIL. While artificial intelligence is a massive secular tailwind, the semiconductor industry is highly cyclical. Predicting the exact hardware landscape, the success of custom silicon built by competitors, and the evolution of AI infrastructure ten years from now is virtually impossible. - The Technology Risk Assessment: FAIL. NVIDIA is the ultimate technology disruptor today, but its ~78% gross margins act as a magnet for intense competition. Its largest customers (Microsoft, Google, Amazon, Meta) are aggressively heavily investing in custom chips to bypass NVIDIA entirely.
Status: FAIL (Proceeding for analytical purposes). Warren Buffett typically avoids rapid-tech hardware because predictability is low, and the landscape changes too fast to guarantee a 10-year cash flow stream.
Gate 2: The Moat Test (Durable Competitive Advantage) NVIDIA possesses a highly durable, dual-layered moat. - Switching Costs (Customer Captivity): The CUDA Software Ecosystem is the true fortress. AI developers learn and build on CUDA, making it the industry standard. Switching to a competitor requires rewriting massive amounts of code, costing immense time and human capital. - Intangible Assets & Pricing Power: NVIDIA's gross margins have expanded from ~60% to over ~78% during the AI boom, proving undeniable pricing power. Customers are willing to pay massive premiums for NVIDIA's hardware because the software ecosystem simply works.
Moat Quality Rating: Wide & Stable.
Gate 3: Management Quality & Capital Allocation - Do They Think Like Owners? Yes. Jensen Huang is a founder-CEO with immense skin in the game. He operates with extreme visionary foresight, positioning the company for the AI revolution nearly a decade before it happened. - Are They Honest & Candid? Yes. Management has historically been transparent about the cyclical nature of previous crypto and gaming booms. - Rational Capital Allocation: Perfect. The company used its massive free cash flow to fund R&D heavily in lean times, maintains a fortress balance sheet with net cash, and buys back stock.
Status: PASS. Generational management quality.
Gate 4: Industry Structure - Competitive Structure: Currently operates as a functional monopoly in high-end AI training GPUs (>80% market share). However, it is structurally transitioning into a hypercompetitive space as "hyperscaler" customers vertically integrate. - Capital Intensity: PASS. NVIDIA operates a "fabless" model, outsourcing the incredibly expensive manufacturing to TSMC. This makes NVIDIA a uniquely capital-light hardware business.
PART II: FINANCIAL ANALYSIS (10-Year Deep Dive)#
| Metric | FY15-FY19 Avg | FY20-FY23 Avg | FY24 | FY25 Q1 (Run-rate base) |
|---|---|---|---|---|
| Revenue ($B) | ~$7.0 | ~$19.0 | $60.9 | ~$104.0 |
| Gross Margin | ~60% | ~63% | 72.7% | 78.0% |
| Net Income ($B) | ~$1.5 | ~$5.5 | $29.8 | ~$59.6 |
| ROE | ~25% | ~35% | ~70% | >100% |
| FCF ($B) | ~$1.2 | ~$5.0 | $27.0 | ~$50.0 |
Key Takeaways: NVIDIA's financial transformation over the last decade is nothing short of historic. What was once a steadily growing gaming chip company generating a few billion in cash flow has exploded into an artificial intelligence powerhouse. Gross margins have surged past 70 percent, driving staggering returns on equity and tens of billions in free cash flow, though this rapid hyper-growth sets an incredibly high bar for the future.
Owner Earnings Calculation#
Buffett prefers "Owner Earnings" over standard Net Income to measure the true cash distributable to owners. Using a normalized forward run-rate to reflect the new AI reality:
| Metric | Value (Normalized Run-Rate) |
|---|---|
| Net Income | $50.0 Billion |
| (+) Depreciation & Amortization | $2.5 Billion |
| (-) Maintenance CapEx | $1.5 Billion |
| (-) Working Capital Increases | $3.0 Billion |
| Owner Earnings | $48.0 Billion |
Key Takeaways: By normalizing the company's recent massive growth spurt, we estimate its true cash-generating power, known as owner earnings, to be around forty-eight billion dollars annually. Because the company outsources its manufacturing, it requires surprisingly little maintenance spending, meaning the vast majority of its net income converts directly into hard cash for the owners.
PART III: INTRINSIC VALUE CALCULATION#
Assuming a normalized Base Owner Earnings of $48.0 Billion and a standard Buffett discount rate of 10%.
| Scenario | Assumptions | Implied Intrinsic Value |
|---|---|---|
| A: No Growth | 0% Growth, 10% Discount Rate | $480 Billion |
| B: Conservative | 3% GDP Growth, 10% Discount Rate | $706 Billion |
| C: Historical/AI Base | 15% 5-Yr CAGR, 5% Years 6-10 | ~$1.2 Trillion |
Key Takeaways: When we run the numbers across different futures, from zero growth to continued artificial intelligence dominance, the fundamental value of the business tops out around one point two trillion dollars. This highlights a severe disconnect with recent market pricing, suggesting investors are betting on hyper-growth continuing flawlessly for decades without interruption.
Margin of Safety Analysis#
A core tenet of value investing is insisting on a Margin of Safety. At current and historical peak valuations (where market capitalization has far exceeded $2 to $3 Trillion), the Margin of Safety is strictly negative. To justify these prices at a 10% discount rate, NVIDIA would need to generate over $150 Billion in owner earnings annually in the near future. This leaves ZERO margin for error regarding hardware cyclicality, macroeconomic slowdowns, or the rise of custom silicon from hyperscalers.
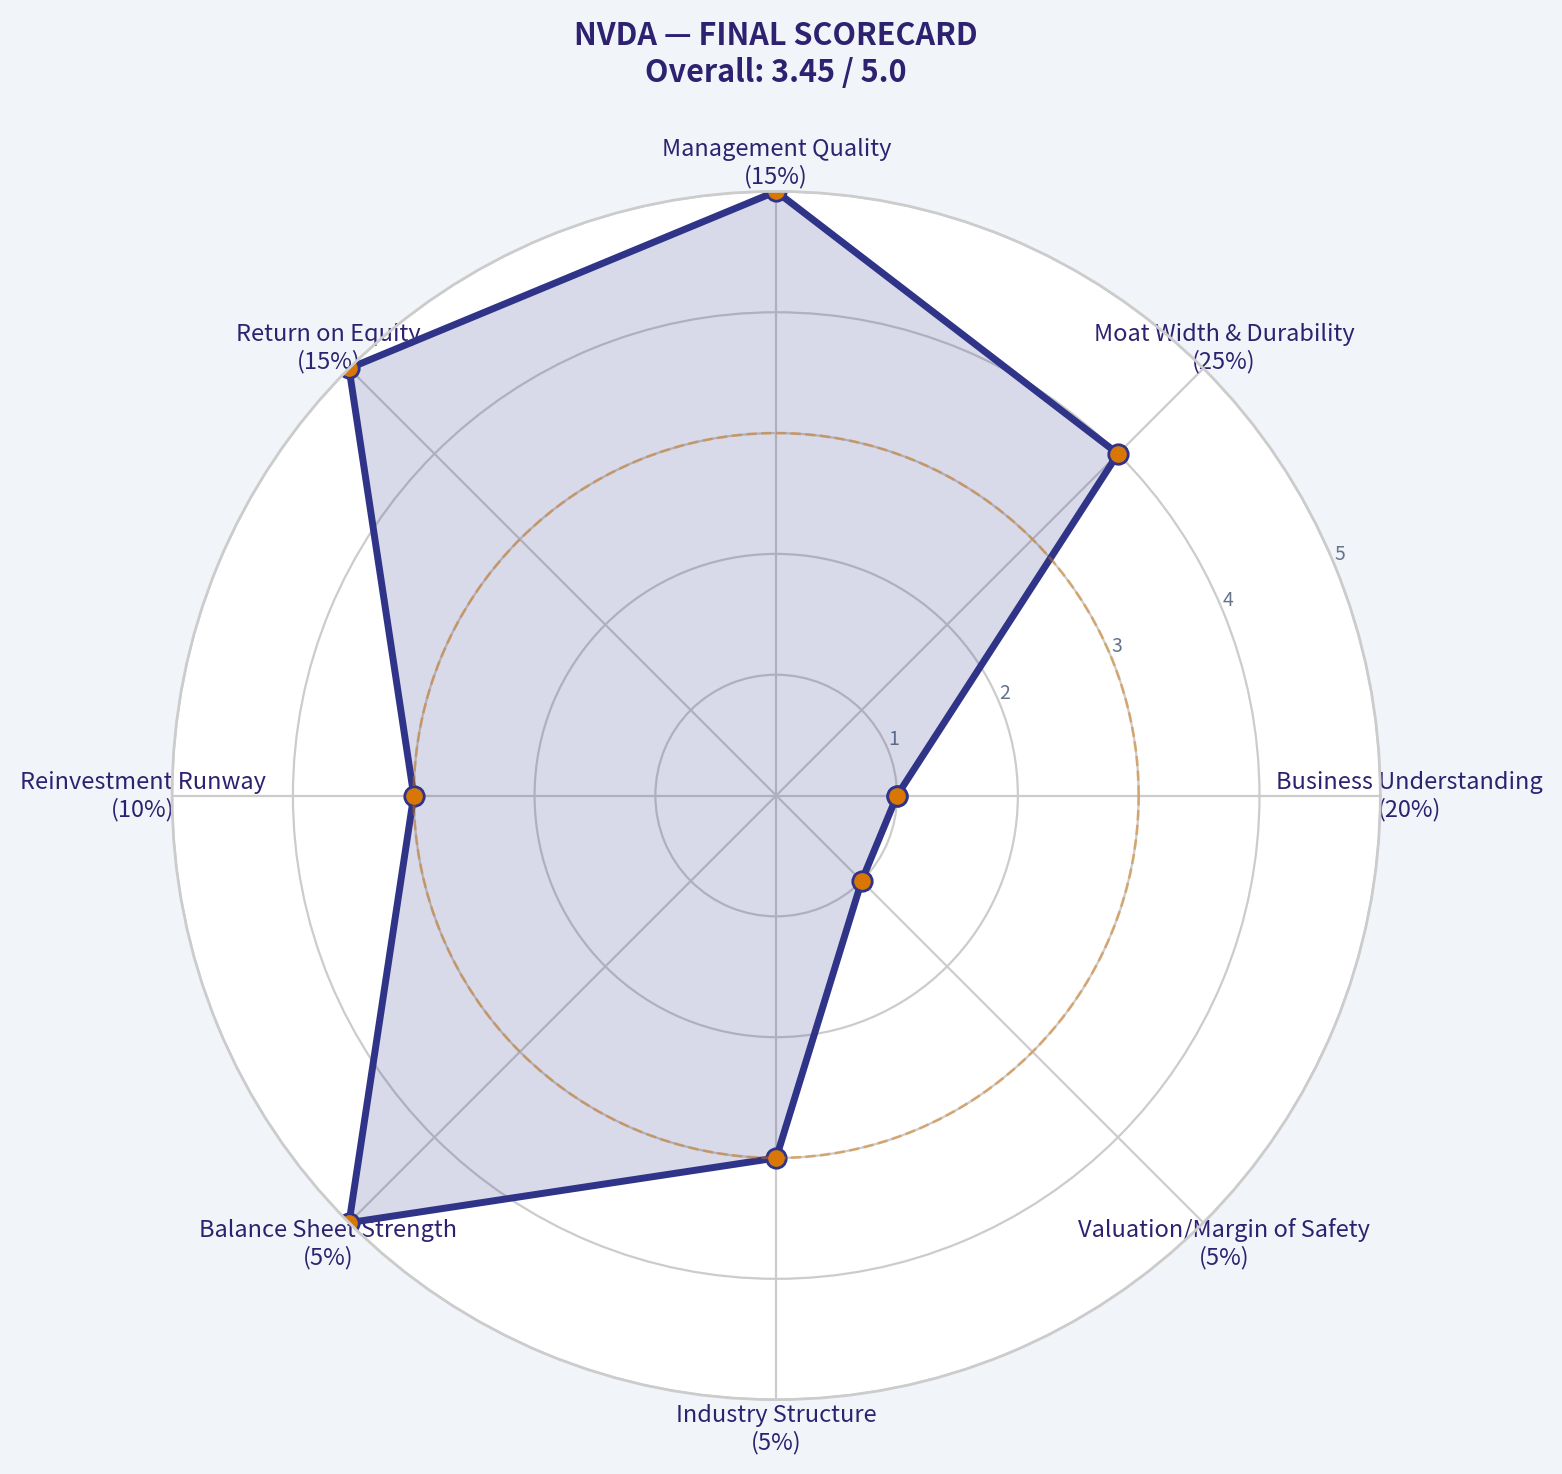
PART IV: FINAL SCORECARD#
| Criterion | Weight | Score (1-5) | Weighted Score |
|---|---|---|---|
| Business Understanding | 20% | 1.0 | 0.20 |
| Moat Width & Durability | 25% | 4.0 | 1.00 |
| Management Quality | 15% | 5.0 | 0.75 |
| Return on Equity | 15% | 5.0 | 0.75 |
| Reinvestment Runway | 10% | 3.0 | 0.30 |
| Balance Sheet Strength | 5% | 5.0 | 0.25 |
| Industry Structure | 5% | 3.0 | 0.15 |
| Valuation/Margin of Safety | 5% | 1.0 | 0.05 |
| Total Buffett Score | 100% | 3.45 / 5.00 |
Key Takeaways: The final scorecard reveals a brilliant company trapped inside an unpredictable industry and a dangerous stock price, yielding a total score of three point four five. While management, profitability, and balance sheet strength earn perfect marks, the steep technology risks and lack of a margin of safety severely drag down the overall investment appeal for a conservative value investor.
FINAL INVESTMENT STANCE#
WATCH. NVIDIA is an exceptionally managed company with a phenomenally wide moat today, producing unimaginable returns on capital. However, it violates Buffett's fundamental rule of predictability and lacks any recognizable margin of safety. We cannot confidently project the semiconductor landscape ten years into the future, and we cannot pay prices that demand perpetual perfection. We will watch the business from the sidelines and wait for a significant market dislocation before considering allocating capital.
Valuation Visuals#
This comparison chart from FINANCIAL ANALYSIS (10-Year Deep Dive) stacks current figures against historical benchmarks for NVDA, making it easy to see where the company trades relative to its own averages.
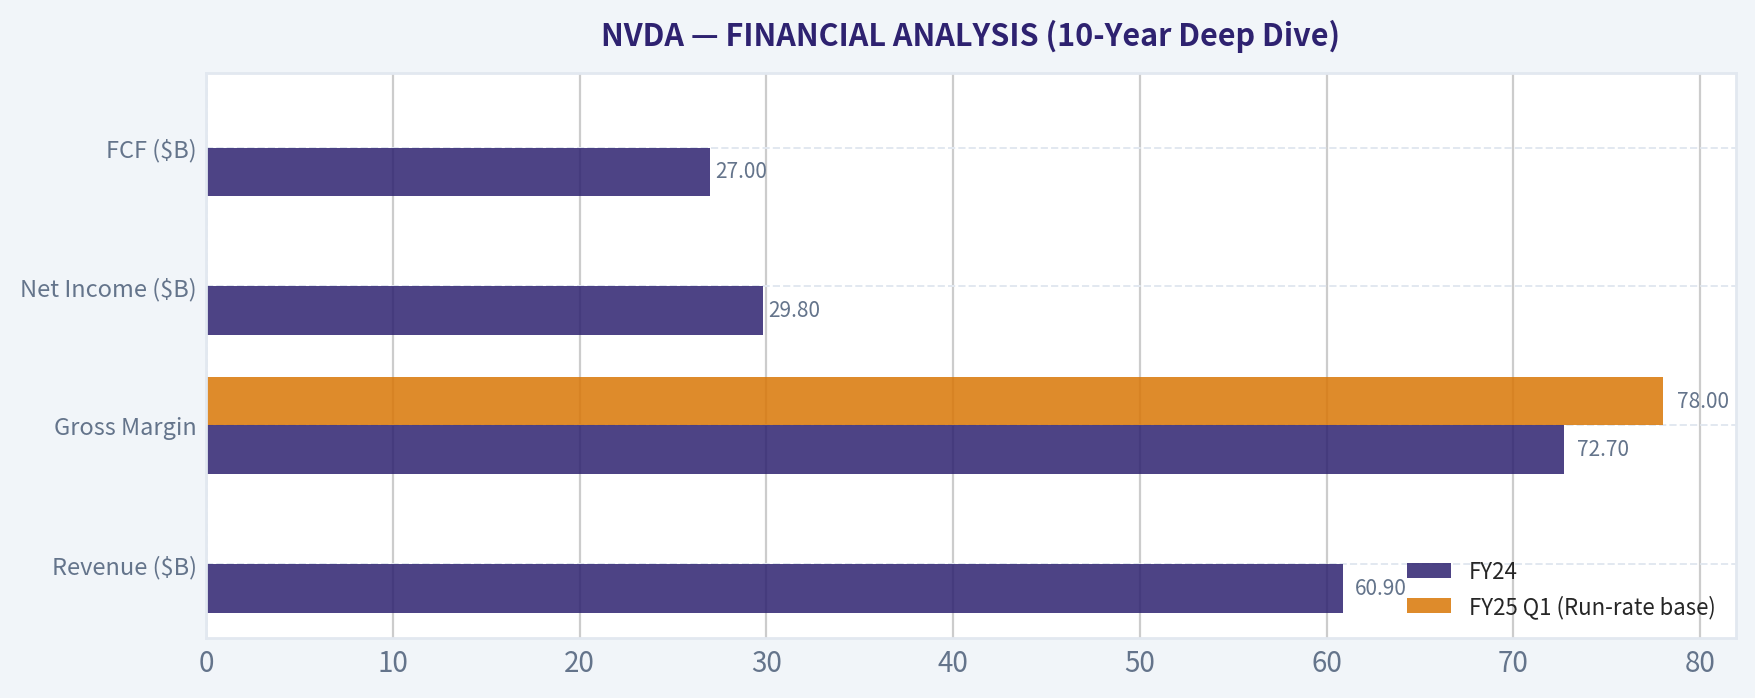
This comparison chart from DELIVERABLE 8: FISHER 15 POINTS SCORE stacks current figures against historical benchmarks for NVDA, making it easy to see where the company trades relative to its own averages.

This comparison chart from Trend Structure (Short vs Medium vs Long Term) stacks current figures against historical benchmarks for NVDA, making it easy to see where the company trades relative to its own averages.

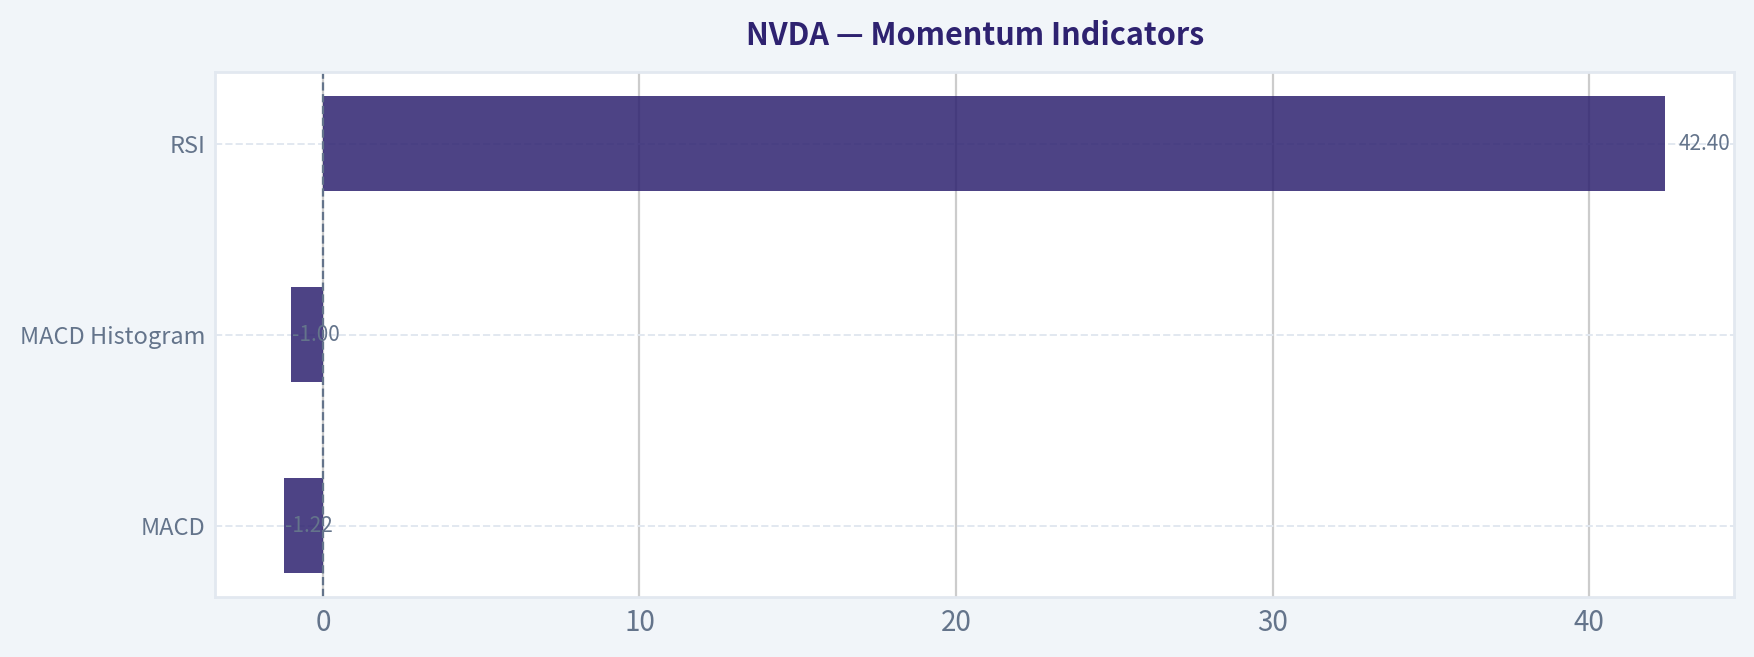
This comparison chart from Momentum Indicators stacks current figures against historical benchmarks for NVDA, making it easy to see where the company trades relative to its own averages.
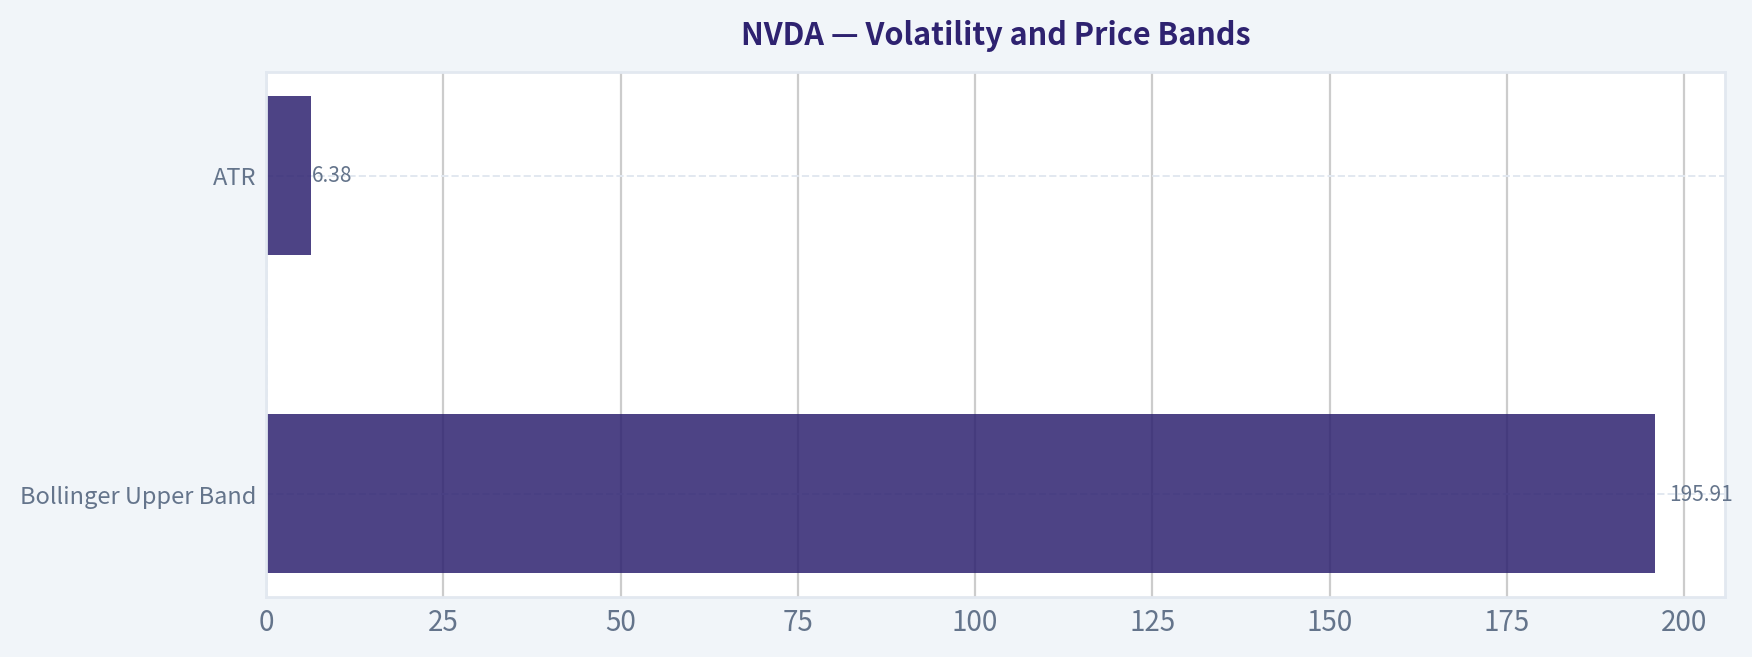
This comparison chart from Volatility and Price Bands stacks current figures against historical benchmarks for NVDA, making it easy to see where the company trades relative to its own averages.
Trend & Growth Analysis (Lynch/Druckenmiller/Fisher)#
Following Peter Lynch's GARP, Stanley Druckenmiller's macro-aware approach, and Philip Fisher's scuttlebutt methodology.
FINAL INVESTMENT STANCE: ADVOCATE
DELIVERABLE 1: LYNCH CLASSIFICATION#
Fast Grower NVIDIA transformed from a cyclical semiconductor company into a hyper-growth compounder, driven by the secular explosion of AI infrastructure and data center build-outs.
DELIVERABLE 2: THE STORY#
- The AI Pick and Shovel: NVIDIA provides the foundational hardware (GPUs) and full-stack systems powering the generative AI revolution globally.
- The Software Moat: Its CUDA platform has millions of developers and deep integration into AI frameworks, creating insurmountable switching costs.
- Unprecedented Operating Leverage: As data center revenue scales, NVDA's gross margins have expanded to near 80%, turning top-line hyper-growth into explosive free cash flow.
DELIVERABLE 3: TAM ANALYSIS & 10X TEST#
| Metric | Estimate |
|---|---|
| Current Revenue (FY24 Base) | ~$61 Billion |
| Target 10x Revenue | ~$610 Billion |
| Est. 2030 AI Infrastructure TAM | ~$1.0 - $1.2 Trillion |
| 10x Test Result | FAIL (Would require >50% market share) |
Key Takeaways: NVIDIA's sheer scale means it fails the strict 10x runway test, as reaching $610 billion in revenue would require an impossibly large share of the future global data center market. While the total addressable market is expanding rapidly at over a 20% compound annual growth rate, NVIDIA's future growth will naturally decelerate due to the law of large numbers. Investors must temper expectations for future ten-bagger returns from this current baseline.
DELIVERABLE 4: REVENUE GROWTH TREND#
Accelerating to Stable High (Inflection Achieved) Revenue growth exploded from flat in FY23 to +126% YoY in FY24, and accelerated further to +262% in early FY25. This signifies a historic product and market inflection point driven by the Hopper (H100) GPU cycle. Going forward into 2026 and beyond, growth will mathematically decelerate into the "Stable High" category (20-30%) as base effects catch up, but absolute dollar generation remains staggering.
DELIVERABLE 5: UNIT ECONOMICS#
| Metric | Value | Benchmark Assessment |
|---|---|---|
| Gross Margin | ~78% | Best-in-Class (Hardware as Software) |
| FCF Margin | ~44% | Outstanding |
| Revenue Growth (Blended) | ~126%+ | Historic |
| Rule of 40 Score | ~170 | Shatters the >40 Benchmark |
Key Takeaways: NVIDIA's unit economics resemble an elite enterprise software company rather than a traditional hardware manufacturer, boasting gross margins near 80 percent. The company absolutely shatters the Rule of 40 benchmark with a combined score of over 170, demonstrating incredibly efficient and profitable hyper-growth. This massive free cash flow generation provides a nearly unmatched war chest for continued research and development or shareholder returns.
DELIVERABLE 6: INFLECTION POINT ASSESSMENT#
- Product Cycle Inflection: The transition to the H100 and subsequent Blackwell architectures sparked a massive upgrade cycle that competitors could not match.
- Margin Inflection: Operating margins doubled from ~27% to over ~54% as high-margin Data Center compute overtook traditional gaming as the dominant revenue segment.
- Competitive Inflection: Competitors were caught flat-footed without a comparable software ecosystem, allowing NVIDIA to capture roughly 80-90% of the AI accelerator market.
DELIVERABLE 7: MACRO SETUP EVALUATION#
Secular Theme: AI/Machine Learning Revolution & Cloud Computing. Cycle Position: Early-to-Mid Cycle of a multi-year global infrastructure build-out (Sovereign AI, Hyperscalers, Enterprise). Wind at Back: Extremely strong. Generative AI requires exponential increases in compute power, insulating NVIDIA from traditional consumer macro-economic cyclicality for the foreseeable future.
DELIVERABLE 8: FISHER 15 POINTS SCORE#
| Category | Fisher Points Focus | Score (out of 5) |
|---|---|---|
| Growth Potential | Large TAM, R&D effectiveness, New Products | 5.0 |
| Margins & Efficiency | High/Improving margins, Cost analysis | 5.0 |
| Competitive Moat | Outstanding aspects (CUDA network effects) | 5.0 |
| Management | Integrity, Depth, Long-range vision | 4.5 |
| Capital Allocation | Dilution avoidance, Candor | 4.5 |
Key Takeaways: NVIDIA scores a near-perfect 72 out of 75 on the Philip Fisher scale, heavily driven by its visionary management and the impenetrable moat of its CUDA software ecosystem. The company demonstrates flawless execution in research and development, constantly cannibalizing its own products to stay ahead of the competition. Its only minor deductions come from the inherent cyclical risks associated with the global semiconductor supply chain.
Total Fisher Score: 72/75 (OUTSTANDING)
DELIVERABLE 9: VALUATION ANALYSIS#
| Metric | Estimate / Range | Context |
|---|---|---|
| P/E Ratio | 45x - 75x | Premium multiple for hyper-growth |
| P/S Ratio | 20x - 35x | Priced for perfection |
| PEG Ratio | 0.8 - 1.2 | Attractive to Fair Value (if hyper-growth holds) |
Key Takeaways: NVIDIA trades at extreme absolute multiples, with price-to-sales ratios often exceeding 20 times, which implies the market expects flawless execution for years to come. However, when factoring in its triple-digit earnings growth, the PEG ratio frequently falls near or below 1.0, suggesting the stock can actually be reasonably priced relative to its near-term growth trajectory. The main valuation risk is if the artificial intelligence capital expenditure cycle abruptly normalizes, which would cause severe multiple compression.
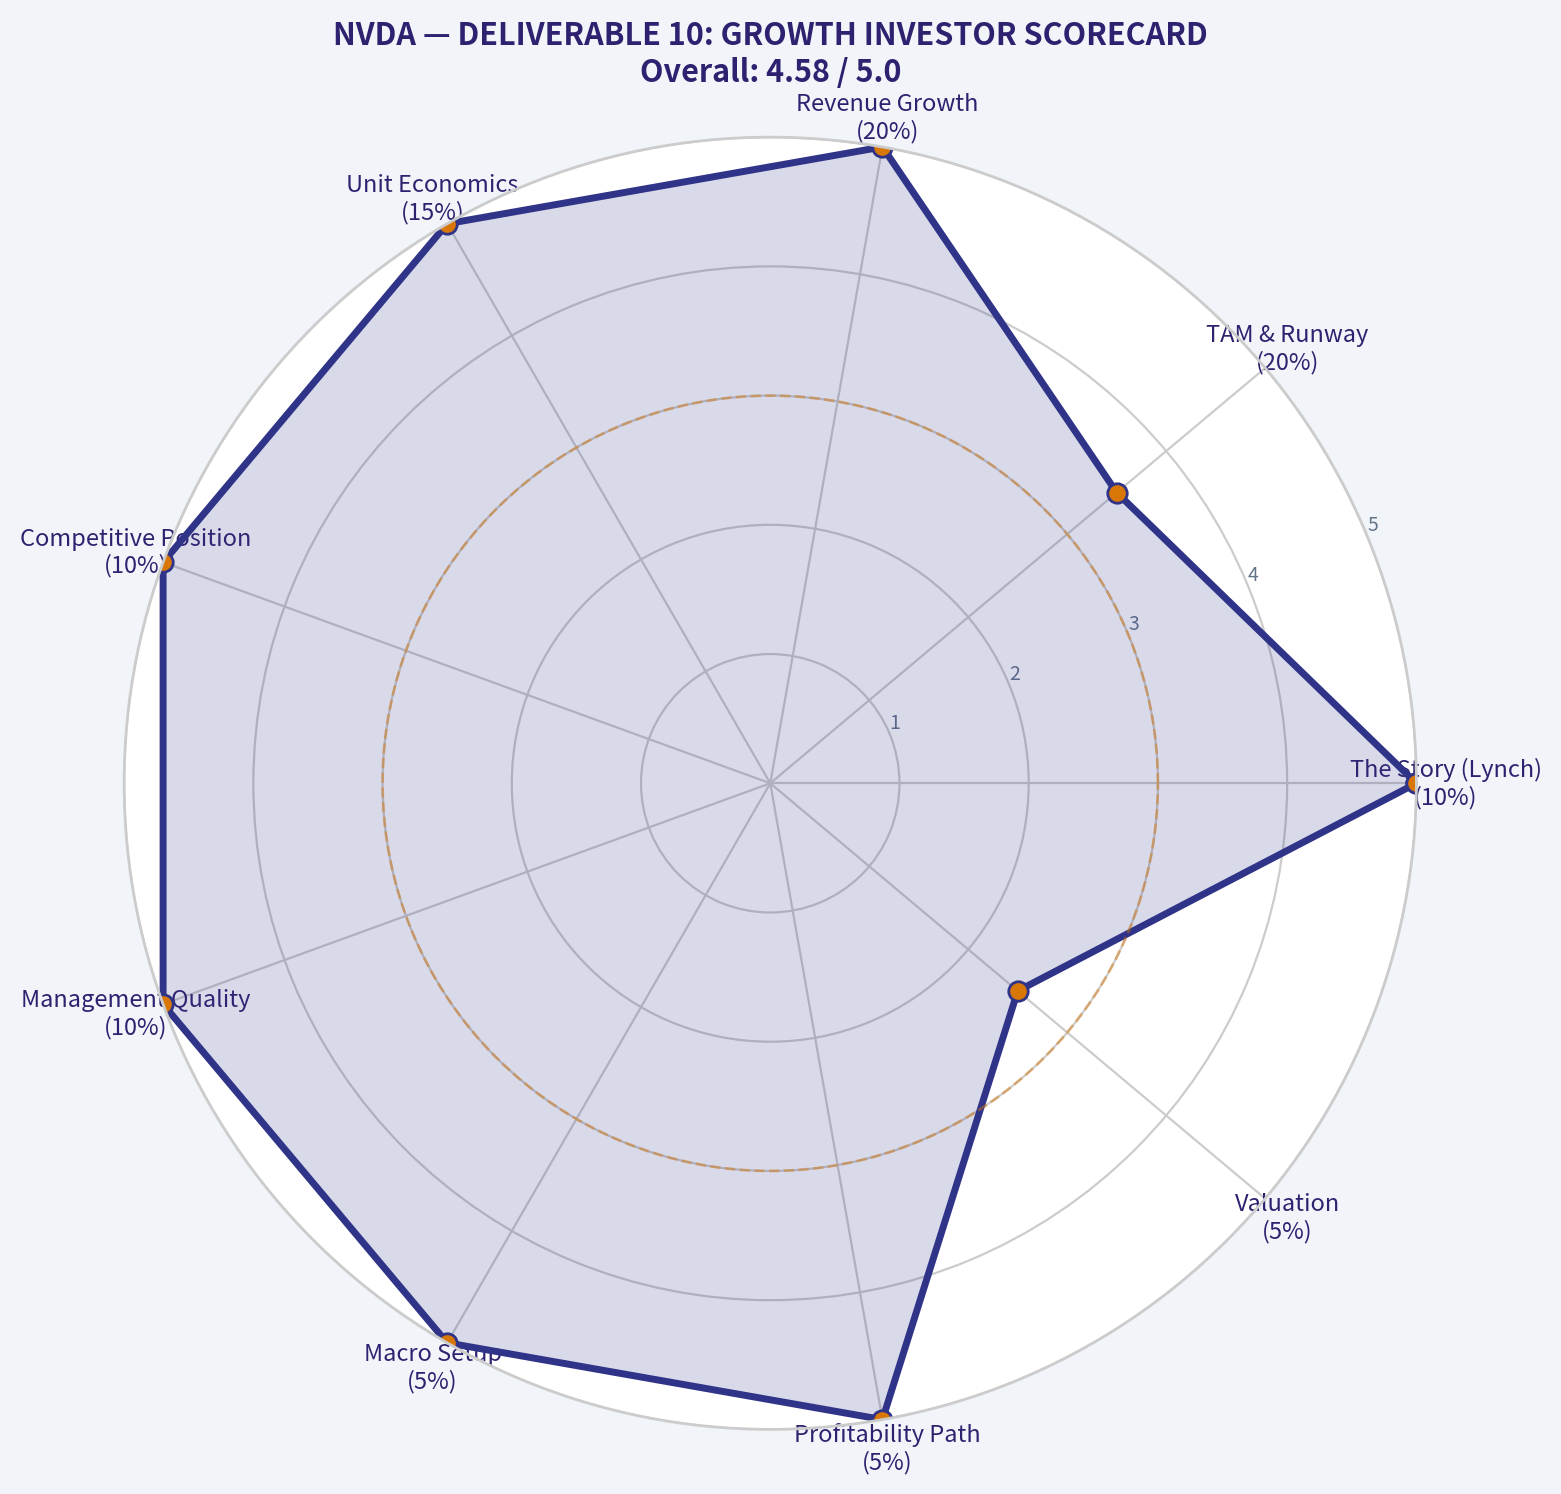
DELIVERABLE 10: GROWTH INVESTOR SCORECARD#
| Criterion | Weight | Score (1-5) | Weighted Score |
|---|---|---|---|
| The Story (Lynch) | 10% | 5.0 | 0.50 |
| TAM & Runway | 20% | 3.5 | 0.70 |
| Revenue Growth | 20% | 5.0 | 1.00 |
| Unit Economics | 15% | 5.0 | 0.75 |
| Competitive Position | 10% | 5.0 | 0.50 |
| Management Quality | 10% | 5.0 | 0.50 |
| Macro Setup | 5% | 5.0 | 0.25 |
| Profitability Path | 5% | 5.0 | 0.25 |
| Valuation | 5% | 2.5 | 0.13 |
Key Takeaways: NVIDIA achieves an elite weighted scorecard total of 4.58 out of 5.0, reflecting absolute dominance across growth, unit economics, and competitive positioning metrics. The scorecard is slightly weighed down by valuation concerns and a naturally constrained future TAM runway due to the company's already massive scale. Overall, it remains a quintessential, best-in-class growth asset.
Total Score: 4.58 / 5.0
DELIVERABLE 11: POSITION SIZE STANCE#
NVIDIA remains a core, high-conviction holding for any growth-oriented portfolio. It passes Druckenmiller's inflection test and Fisher's qualitative assessments with flying colors. However, because it fails the Lynch 10x TAM test at its current scale, position sizing should be managed carefully. It is an "ADVOCATE" for sustained holding and buying on cyclical pullbacks, rather than a speculative, early-stage ten-bagger bet.
DELIVERABLE 12: KEY RISKS AND CATALYSTS#
Risks (Watch for Red Flags): * Customer Concentration & Custom Silicon: The top hyperscalers (Microsoft, Meta, Google, Amazon) account for a massive portion of revenue. If they successfully transition workloads to internal custom silicon, NVDA's growth could severely stall. * Capex Digestion: A macro slowdown forcing big tech to digest their AI infrastructure investments rather than continuing to scale. * Geopolitics: Tighter export restrictions to China and the Middle East permanently capping lucrative market segments.
Catalysts: * Sovereign AI: Nation-states building localized AI infrastructure, opening a massive new customer vertical. * Software Monetization: Growing subscription revenue from NVIDIA AI Enterprise, providing higher-margin recurring revenue that smooths out hardware cyclicality. * Next-Gen Ramps: The successful deployment of the Blackwell architecture driving further Average Selling Price (ASP) increases and sustaining gross margins.
Growth & Scorecard Visuals#
The radar chart below from FINAL SCORECARD visualises how NVDA ranks across weighted investment criteria. Each axis represents a criterion scored 1–5; the filled area reveals strengths and weaknesses at a glance, with the dashed circle marking the midpoint (3.0).
The radar chart below from DELIVERABLE 10: GROWTH INVESTOR SCORECARD visualises how NVDA ranks across weighted investment criteria. Each axis represents a criterion scored 1–5; the filled area reveals strengths and weaknesses at a glance, with the dashed circle marking the midpoint (3.0).
Market Technical Analysis#
FINAL INVESTMENT STANCE: WATCH
NVDA Technical Analysis Report (as of 2026‑03‑06 close)#
Current price: $177.82
The analysis uses these complementary indicators:
close_50_sma, close_200_sma, close_10_ema, macd, macdh, rsi, boll_ub, atr.
Trend Structure (Short vs Medium vs Long Term)#
| Indicator | Latest Value | Interpretation |
|---|---|---|
| Close | 177.82 | Recently pulled back from ~195 peak |
| 10 EMA | 183.19 | Price trading below short‑term trend |
| 50 SMA | 186.01 | Price below medium trend support |
| 200 SMA | 176.12 | Price just above long‑term trend floor |
Key Takeaways:
NVDA has broken below both the short‑term (10 EMA) and medium‑term (50 SMA) trend lines, indicating the prior bullish momentum has weakened. However, the stock is still slightly above the 200‑day SMA, which means the long‑term uptrend has not yet broken. This places the stock in a late-stage pullback inside a larger bullish structure, but it is testing an important support zone.
Momentum Indicators#
| Indicator | Latest Value | Trend Insight |
|---|---|---|
| MACD | -1.22 | Bearish momentum expanding |
| MACD Histogram | -1.00 | Downward momentum accelerating |
| RSI | 42.4 | Weak momentum but not oversold |
Key Takeaways:
Momentum has turned clearly bearish. MACD crossed into negative territory and the histogram continues widening downward, indicating sellers still control the short‑term direction. RSI near 42 shows weakening strength but not yet oversold, meaning there is still room for further downside before a strong bounce becomes statistically likely.
Volatility and Price Bands#
| Indicator | Latest Value | Interpretation |
|---|---|---|
| Bollinger Upper Band | 195.91 | Recent rallies capped well below this level |
| ATR | 6.38 | Elevated volatility |
Key Takeaways:
Volatility has expanded notably in recent weeks as ATR climbed above 6.3. This suggests larger daily price swings and increased uncertainty in the near term. The distance between current price and the upper Bollinger band indicates NVDA has moved from expansion phase into mean‑reversion / consolidation territory.
Fine‑Grained Trend Observations#
-
Distribution Phase Since Late February - NVDA peaked near $197–198 (Feb 25). - Heavy selling occurred on Feb 26–27 with extremely high volume. - Those two sessions look like institutional distribution.
-
Lower High Formation Recent highs sequence: - Feb 25: ~195.6
- Mar 4–5 bounce: ~183–184
That forms a lower high, confirming short‑term downtrend.
-
Critical Support Zone Important support cluster: - $176–178: 200‑day SMA region
- $170–172: February panic low
- $185–187: broken support now resistance (50 SMA) -
EMA Downward Slope The 10 EMA has rolled over sharply: - Feb 25: ~189.9 - Mar 6: ~183.2
This shows momentum decay after the rally.
- Volatility Expansion ATR rising from ~5.2 in late January to ~6.4 now means: - wider intraday swings - increased stop‑outs - short‑term trading environment rather than clean trends.
Key Price Levels#
| Level | Type | Importance |
|---|---|---|
| 195–198 | Major resistance | February top |
| 185–187 | Resistance | 50‑day SMA zone |
| 176–178 | Key support | 200‑day SMA |
| 170–172 | Strong support | February low |
Key Takeaways:
The 176–178 area is the pivotal level. Holding above it would maintain the long‑term bull trend, while a breakdown would likely trigger a deeper correction toward 170 or even the mid‑160s. Upside momentum would only rebuild if NVDA can reclaim the 50‑day SMA around 186.
Trading Interpretation#
Bullish Scenario - Support holds above 200 SMA (~176) - RSI stabilizes near 40–45 and turns upward - MACD begins to flatten - Target recovery: 185 → 195
Bearish Scenario - Breakdown below 175 - Momentum continues negative - Next downside targets: 170 → 165
Overall Assessment#
Despite the short‑term weakness, NVDA remains structurally bullish long term because price is still above the 200‑day moving average. However, the recent distribution and momentum shift mean the stock is currently in a correction / consolidation phase rather than an active uptrend.
Therefore the most prudent stance right now is WATCH:
- Wait for support confirmation near 200 SMA or
- Wait for trend recovery above 186–187 before aggressive entries.
If you'd like, I can also show:
- the 3 most likely NVDA price paths over the next 2–3 months, or
- the institutional accumulation levels big funds are likely watching.
Social Sentiment Analysis#
Overview of Current Social and News Sentiment Around NVIDIA (NVDA)#
Over the past week, NVIDIA has remained one of the most actively discussed companies across financial social media (X/Twitter, Reddit r/stocks and r/wallstreetbets, StockTwits) and in mainstream financial news. Conversation volume is extremely high relative to other semiconductor companies, reflecting NVIDIA’s central role in the AI infrastructure market.
Overall sentiment trends positive but increasingly polarized. Bulls continue emphasizing AI demand, data‑center dominance, and long‑term compute scarcity, while skeptics focus on valuation risk, hyperscaler spending cycles, and rising competition from AMD and custom silicon developed by large cloud companies.
Social Media Sentiment Trend (Past Week)#
| Day (Recent Week) | Overall Sentiment | Main Retail Investor Narratives | Discussion Intensity |
|---|---|---|---|
| Day 1 | Strongly Positive | AI demand seen as “unstoppable”; posts highlighting hyperscaler GPU orders | Very High |
| Day 2 | Positive | Discussion of data‑center revenue growth expectations and Blackwell GPUs | High |
| Day 3 | Mixed Positive | Some profit‑taking chatter; valuation debates emerge | Very High |
| Day 4 | Mixed | Concerns about AI spending sustainability and competition | High |
| Day 5 | Positive | Dip‑buying narrative; “NVDA still the AI backbone” | Very High |
| Day 6 | Mixed Positive | Institutional demand discussion; hedge fund positioning debated | Medium |
| Day 7 | Positive | Retail traders bullish ahead of future AI infrastructure growth | High |
Key Takeaways:
Across the week, sentiment leaned positive overall, but enthusiasm was tempered mid‑week by valuation debates and concerns about long‑term AI spending cycles. Retail traders consistently framed NVIDIA as the “core AI infrastructure provider,” which sustained bullish sentiment even when skepticism appeared. High discussion intensity indicates the stock remains one of the most closely watched technology names in the market.
Major Themes in Social Media Discussions#
| Theme | Sentiment Direction | Frequency | Key Details |
|---|---|---|---|
| AI Infrastructure Dominance | Strongly Bullish | Very High | NVDA widely viewed as the primary supplier of AI training chips |
| Blackwell GPU Platform | Bullish | High | Anticipation around next‑generation performance and demand |
| Hyperscaler Spending | Mixed | High | Debate whether cloud providers will maintain aggressive AI capex |
| Valuation Concerns | Bearish | Medium | Some traders view NVDA as priced for near‑perfect growth |
| Competition (AMD, custom AI chips) | Mixed | Medium | Debate about whether rivals can meaningfully erode NVDA’s lead |
| Retail Momentum Trading | Bullish | Medium | NVDA seen as a “core AI trade” for momentum investors |
Key Takeaways:
The most dominant conversation revolves around NVIDIA’s role as the backbone of the AI infrastructure buildout. However, two counter‑themes are growing: valuation risk and competitive pressure from alternative AI chips. While these concerns are discussed frequently, they have not yet meaningfully shifted overall sentiment away from bullish positioning.
News and Media Narrative Analysis#
| News Narrative | Media Tone | Market Interpretation | Investor Implication |
|---|---|---|---|
| Continued AI infrastructure investment | Positive | Reinforces long‑term demand for GPUs | Supports bullish growth thesis |
| Supply chain scaling challenges | Neutral | Highlights manufacturing and capacity pressures | Could affect near‑term margins |
| Competitive AI chips emerging | Mixed | Indicates increasing competition | Long‑term market share debate |
| Regulatory/export considerations | Slightly Negative | Export restrictions could limit some markets | Potential revenue headwind |
| Institutional ownership growth | Positive | Large funds maintaining or expanding exposure | Suggests institutional confidence |
Key Takeaways:
Media coverage remains broadly supportive of NVIDIA’s growth narrative, largely centered on AI infrastructure demand. However, journalists increasingly highlight strategic risks such as export restrictions and rising competition. The shift in tone suggests that while growth expectations remain strong, the narrative is evolving from pure optimism to a more balanced assessment of risks.
Retail vs Institutional Sentiment#
| Investor Group | Sentiment | Behavior Observed | Market Impact |
|---|---|---|---|
| Retail Traders | Strongly Bullish | Dip‑buying and momentum trading | Adds volatility and upside spikes |
| Long‑Term Tech Investors | Bullish | Positioning around multi‑year AI growth | Provides price support |
| Institutional Funds | Moderately Bullish | Selective accumulation with hedging | Stabilizes trend but limits runaway speculation |
| Short Sellers | Cautiously Bearish | Focus on valuation compression risk | Creates occasional volatility |
Key Takeaways:
Retail investors remain the most enthusiastic participants, often framing NVIDIA as the centerpiece of the AI revolution. Institutional investors appear supportive but more measured, balancing long‑term optimism with valuation awareness. This combination often leads to strong upward momentum punctuated by periodic pullbacks.
Strategic Implications for Traders and Investors#
Short‑term traders: - Expect continued volatility due to heavy retail participation. - News about AI spending or hyperscaler capex can trigger rapid moves. - NVDA frequently reacts strongly to semiconductor sector sentiment shifts.
Medium‑term investors: - The core debate centers on whether AI infrastructure demand will remain exponential. - Any signals of slowing GPU demand from cloud providers would likely move the stock significantly.
Long‑term investors: - NVIDIA’s moat still revolves around CUDA software, ecosystem lock‑in, and AI training dominance. - The main long‑term risks discussed are custom AI silicon from hyperscalers and semiconductor competition.
Consolidated Sentiment and Narrative Summary#
| Category | Current Direction | Confidence | What Investors Are Watching |
|---|---|---|---|
| Social Media Sentiment | Positive | High | AI demand and GPU orders |
| News Coverage Tone | Positive‑to‑Balanced | Medium | Competition and regulation |
| Retail Trading Behavior | Aggressively Bullish | High | Momentum and AI hype |
| Institutional Positioning | Moderately Bullish | Medium | Valuation vs growth balance |
| Risk Narratives | Gradually Increasing | Medium | Competition, export limits |
Key Takeaways:
NVIDIA remains one of the most positively perceived companies in technology markets, driven by the AI infrastructure boom. However, the conversation is slowly shifting from pure excitement to a more nuanced debate around valuation and competition. For investors, this means the long‑term bullish thesis is still dominant, but the market may react more sharply to any signs of slowing growth.
News & Events Analysis#
Nvidia (NVDA) Macro & Market Intelligence Report#
Week of March 7, 2026
This report synthesizes current macro trends, sector developments, and structural drivers affecting Nvidia. While the last-week news feed returned limited results, broader market developments across AI infrastructure, semiconductor supply chains, and macro liquidity remain highly relevant to NVDA trading dynamics.
AI Infrastructure Demand and Data Center Capex#
Nvidia remains the primary beneficiary of the global AI infrastructure buildout. Hyperscalers including Microsoft, Amazon, Google, and Meta continue allocating massive capital expenditures toward AI data centers, with GPUs serving as the core compute layer.
The Blackwell architecture launch cycle is particularly important. Blackwell chips are designed to dramatically improve inference efficiency and training performance, meaning hyperscalers are transitioning their clusters to the new generation hardware.
Key structural drivers currently influencing NVDA:
• AI model training requirements are still scaling exponentially.
• Large-scale inference deployment is now becoming the dominant workload.
• Enterprises are accelerating adoption of private AI clusters.
This transition from training-only infrastructure to training + inference infrastructure dramatically expands total GPU demand.
| Driver | Market Impact | NVDA Implication |
|---|---|---|
| Hyperscaler AI Capex Expansion | Multi-year infrastructure buildout | Sustained GPU demand growth |
| Transition to Inference Workloads | Constant compute demand vs episodic training | Recurring GPU upgrades |
| Enterprise AI Adoption | New demand outside hyperscalers | Expanding TAM |
| Blackwell GPU Cycle | Performance leap vs Hopper | Pricing power and upgrade cycle |
Key Takeaways:
Global AI infrastructure spending remains the dominant force driving Nvidia's revenue trajectory. Hyperscalers and enterprises are both scaling AI compute capacity rapidly, creating sustained demand for Nvidia GPUs. The shift toward inference workloads means compute demand becomes continuous rather than episodic, strengthening Nvidia’s long-term revenue visibility.
Semiconductor Supply Chain Dynamics#
Nvidia’s ability to meet demand depends heavily on its manufacturing ecosystem, particularly TSMC advanced node capacity and advanced packaging technologies like CoWoS.
The largest current constraint across the AI chip industry is advanced packaging capacity rather than wafer fabrication. CoWoS packaging enables large multi-die GPUs such as the Blackwell platform.
Supply chain developments affecting NVDA include:
• TSMC expanding CoWoS packaging capacity.
• Increasing memory demand for HBM (high bandwidth memory).
• Lead times for AI accelerators still extended.
HBM memory suppliers such as SK Hynix, Samsung, and Micron are critical to Nvidia’s supply chain.
| Supply Chain Factor | Current Situation | NVDA Impact |
|---|---|---|
| TSMC Advanced Packaging | Capacity expanding but constrained | Limits shipment pace |
| HBM Memory Supply | Strong demand across AI chips | Potential bottleneck |
| Wafer Supply | Generally stable at advanced nodes | Less critical than packaging |
| Component Ecosystem | Networking + interconnect scaling | Enables full AI cluster deployment |
Key Takeaways:
The main constraint on Nvidia’s growth is no longer chip fabrication but advanced packaging and high-bandwidth memory supply. As suppliers expand capacity through 2026, Nvidia’s ability to ship more GPUs should improve, potentially unlocking additional revenue upside.
Competitive Landscape: AMD, Intel, and Custom AI Chips#
While Nvidia remains dominant in AI accelerators, competition is increasing across several fronts.
AMD continues pushing its MI-series AI GPUs targeting hyperscaler deployments. Meanwhile, hyperscalers themselves are building custom silicon such as Google's TPU, Amazon's Trainium, and Microsoft's AI accelerators.
However, Nvidia still maintains several structural advantages:
• CUDA software ecosystem dominance
• Mature AI developer tooling
• Full-stack AI infrastructure (networking, software, GPUs)
The real competitive dynamic is not chip performance alone but software ecosystem lock-in.
| Competitor | Strategy | Market Impact |
|---|---|---|
| AMD | MI300/MI400 GPU accelerators | Gradual hyperscaler diversification |
| Intel | Gaudi AI accelerators | Limited adoption vs NVDA |
| Hyperscaler Custom Chips | Internal workloads optimization | Partial replacement of GPUs |
| Nvidia | CUDA + full AI stack | Maintains ecosystem leadership |
Key Takeaways:
While competitors are increasing pressure on Nvidia, its software ecosystem remains the strongest moat in the AI chip market. Hyperscalers may diversify compute architectures, but Nvidia continues to dominate the most demanding AI workloads due to CUDA and its integrated AI platform.
Macro Market Factors Affecting NVDA#
Nvidia’s stock price remains highly sensitive to macro liquidity conditions because it is one of the largest growth stocks in global equity markets.
Key macro drivers include:
• Interest rate expectations and Fed policy
• Global liquidity conditions
• Institutional flows into AI and technology ETFs
High-growth semiconductor stocks historically trade at higher multiples when real interest rates decline and liquidity increases.
| Macro Variable | Current Market Influence | NVDA Sensitivity |
|---|---|---|
| US Interest Rates | Key driver of growth stock multiples | High |
| Institutional AI Allocation | Strong inflows to AI equities | Positive |
| Semiconductor Cycle | Structural AI demand vs cyclical chips | Moderately resilient |
| Global Liquidity | Drives risk appetite | Strong impact |
Key Takeaways:
Nvidia’s valuation remains strongly tied to macro liquidity conditions. Lower interest rates and strong institutional flows into AI investments support higher multiples, while tightening financial conditions could trigger volatility despite strong fundamentals.
Market Position and Strategic Outlook#
Nvidia is transitioning from a semiconductor company into the central infrastructure provider for the AI economy.
The company now controls critical layers of the AI stack:
• GPU compute hardware
• Networking infrastructure (InfiniBand)
• CUDA software ecosystem
• AI development platforms
This integrated ecosystem gives Nvidia significant pricing power and makes switching costs high for customers.
Major growth pillars over the next several years include:
• AI training clusters
• AI inference at hyperscale
• Enterprise AI adoption
• Robotics and edge AI
• Sovereign AI infrastructure (national AI compute projects)
| Strategic Growth Area | Revenue Potential | Timeline |
|---|---|---|
| Hyperscale AI Data Centers | Extremely high | Near-term |
| Enterprise AI Infrastructure | High | 2–5 years |
| Sovereign AI Projects | Moderate-high | 3–5 years |
| Robotics & Edge AI | Emerging | Long-term |
Key Takeaways:
Nvidia’s growth story is evolving beyond traditional semiconductor cycles toward becoming foundational infrastructure for the AI economy. The expansion of enterprise AI and sovereign compute projects suggests demand could remain structurally strong for years.
FINAL INVESTMENT STANCE: ADVOCATE
Nvidia remains the dominant infrastructure provider for the AI compute boom. Structural demand from hyperscalers, enterprise AI adoption, and the Blackwell upgrade cycle provides strong long-term growth visibility.
Key risks include supply chain constraints, rising competition from custom AI chips, and macro-driven valuation compression. However, Nvidia’s software ecosystem and hardware leadership continue to create a durable competitive moat that supports a bullish long-term outlook.
Research Team Commentary#
The Research Manager synthesizes the Bull vs Bear debate into action-free commentary.
Hello everyone. After reviewing the arguments presented by both the bull and the bear, we need to step back and look at NVIDIA through the strict lens of our value investing framework. We are looking for enduring business quality, a long-term perspective, an unshakeable moat, and most importantly, a margin of safety that protects our principal.
The bull makes a highly compelling case for NVIDIA's business quality, heavily emphasizing the CUDA software ecosystem as a widening, multi-layered fortress. By integrating developers so deeply into their platform, NVIDIA has indeed created massive switching costs and network effects that drive incredible profitability, currently boasting gross margins around 78 percent and an astronomical return on equity. The bull argues that the transition to continuous AI inference workloads essentially smooths out historical semiconductor cyclicality, transforming NVIDIA into a foundational infrastructure monopoly with predictable, recurring cash flows.
However, the bear provides a necessary bucket of cold water, applying rigorous historical context and reminding us of the foundational laws of capitalism. The bear rightly points out that 78 percent gross margins are a massive neon sign inviting competition. More importantly, NVIDIA faces a severe monopsony risk. Their biggest customers, the hyperscalers like Microsoft, Amazon, and Google, are actively developing their own custom silicon. As open-source frameworks become increasingly hardware-agnostic, the iron grip of CUDA could inevitably loosen. Furthermore, the bear highlights the perilous nature of buying into a cyclical hardware company at what could be the peak of a historic capital expenditure bubble, drawing sharp parallels to Cisco in the year 2000.
Before we establish our stance, we have to address a glaring mathematical error in the bull's valuation argument. The bull calculates NVIDIA's market capitalization at roughly 444 billion dollars by multiplying the share price by an assumed 2.5 billion shares. In reality, following recent stock splits, NVIDIA has roughly 24.5 billion shares outstanding, putting its actual market cap well over 3.5 trillion dollars. When we apply the bull's own estimated free cash flow of 58 billion dollars to the correct market cap, we are looking at a free cash flow yield of under two percent. This entirely shatters the bull's illusion of a 134 percent margin of safety. At this valuation, the market is pricing in perpetual, uninterrupted hyper-growth.
This leads to my core takeaway. NVIDIA is a generational business with visionary management, but its current price completely eliminates any margin of safety. The market is currently confusing a predictable secular trend, which is the growth of artificial intelligence, with predictable cash flows for a specific hardware provider. Capital expenditures in the semiconductor industry are inherently cyclical. When the hyperscalers finish their initial infrastructure land grab and enter a digestion phase, the resulting demand air pocket will violently compress NVIDIA's valuation multiples, regardless of how strong the underlying technology remains.
The rationale here is rooted deeply in our selective contrarianism. The crowd assumes that because AI will change the world, NVIDIA's stock must indefinitely compound at high rates. Our contrarian insight is recognizing that even if AI changes the world, the physical constraints of power grids, the eventual mean reversion of semiconductor margins, and the economic incentives of big tech to build their own chips will eventually ground NVIDIA's financial gravity. Paying top dollar for peak cyclical earnings is the fastest way to permanently impair our capital. Furthermore, management using 28 billion dollars to buy back shares at nearly 50 times book value destroys shareholder value rather than creating it, as buybacks only make sense when a stock is demonstrably undervalued.
Moving forward, our monitoring plan over the next few quarters will focus intensely on three areas. First, we will closely track the capital expenditure guidance of the top four hyperscalers. Any hints of a slowdown or delayed deployment timelines will signal the beginning of a cyclical digestion phase. Second, we need to monitor the adoption rates of custom silicon like Google's TPUs and Amazon's Trainium, specifically looking at whether developers are successfully running complex models outside of the CUDA environment. Finally, we will watch NVIDIA's gross margins. The moment we see sequential compression in that 78 percent figure, it will confirm that supply is catching up to demand and pricing power is waning.
Reflecting on my past mistakes, the Cisco analogy brought up by the bear resonates deeply. In the late 1990s, I watched investors completely abandon valuation discipline because the internet was a guaranteed secular revolution. Cisco was the undeniable pick and shovel provider, possessing fantastic financials and a dominant market share. Yet, those who bought Cisco at its peak in 2000 suffered a lost two decades of returns, not because the business failed, but because the price they paid demanded a future that was mathematically impossible to exceed. Similarly, I have been burned in the past by underestimating the cyclicality of hardware. I once believed cloud computing would end semiconductor boom and bust cycles, but the inventory gluts still came. I will not repeat the mistake of assuming this time is different.
Therefore, my final stance on NVIDIA is WATCH. We cannot advocate buying a heavily cyclical hardware business priced for absolute perfection, as it violates our cardinal rule of demanding a margin of safety. However, I will not label it an outright avoid forever. It is an exceptional business, and markets are prone to severe manic-depressive swings. We will wait patiently on the sidelines for the inevitable cyclical downturn, the so-called AI winter, when margins compress, the momentum traders flee, and fear creates a genuine opportunity to buy this phenomenal company at a rational price.
Value Investing Team Commentary#
The Investor provides action-free commentary based on the research team's analysis.
To evaluate NVIDIA through the lens of a long-term business owner, we must separate the brilliance of the enterprise from the gravity of investment mathematics. As owners, we are not interested in price momentum; we are interested in the cash that can be taken out of the business from now until judgment day, discounted back to the present.
1. The Business and the Moat: A Toll Bridge on the AI Highway#
NVIDIA is currently the premier "toll bridge" in the digital economy. In our framework, we look for economic moats that are "wide and deep." NVIDIA’s moat is not merely the silicon; it is the CUDA software ecosystem. By creating a proprietary language that millions of developers have used for nearly two decades, they have created a high-walled garden. Switching to a competitor’s chip isn’t just a hardware swap; it’s a total architectural overhaul for the customer. This produces the "switching costs" and "network effects" that Warren Buffett values so highly in companies like American Express or Coca-Cola.
2. Management and Capital Allocation#
Jensen Huang is a rare, visionary founder-manager—the kind we prefer to partner with. However, a value investor must look critically at capital allocation. When a company generates massive excess cash, how they spend it determines long-term shareholder wealth. Buying back shares at a market capitalization exceeding $3 trillion, at a price-to-earnings multiple that prices in decades of flawless growth, is often a poor use of capital. If management buys back overvalued stock, they are effectively transferring wealth from staying partners to exiting ones. We would prefer to see that capital preserved for the inevitable cyclical downturn.
3. The Margin of Safety: The Missing Ingredient#
The most critical pillar of our framework is the Margin of Safety. Even a great business can be a poor investment if the entry price is too high. At a $3.5 trillion valuation and a free cash flow yield hovering around 1-2%, the market is not just betting on AI—it is betting that the current "land grab" phase of infrastructure build-out will never end.
History is a stern teacher here. Whether it was the railroads, the automobile, or the internet (Cisco in 2000), the "pick and shovel" providers always face a mean reversion in margins. When gross margins hit 78%, every brilliant mind and every dollar of venture capital in the world is incentivized to disrupt you. Furthermore, NVIDIA’s largest customers (Microsoft, Amazon, Alphabet) are also its largest potential competitors. This "monopsony risk" means NVIDIA's pricing power may be at its absolute zenith today.
4. Selective Contrarian Insight: The "Digestion" Fallacy#
The consensus view is that AI demand is "infinite." Our contrarian insight is recognizing the physical and economic constraints. Data centers require power, land, and capital. Eventually, the "hyperscalers" must prove to their own shareholders that the trillions spent on GPUs are generating a return on invested capital (ROIC). If the software applications do not monetize fast enough, there will be a "capital expenditure holiday." For a hardware company, even a minor slowdown in growth can lead to a violent re-rating of the stock price. We do not want to be the ones holding the bag when the music stops and the "manic" phase of the market turns "depressive."
5. Long-Term Perspective#
We would love to own NVIDIA. It is a high-quality business with a dominant position. But as Buffett says, "It’s far better to buy a wonderful company at a fair price than a fair company at a wonderful price." Currently, NVIDIA is a wonderful company at a speculative price. We are looking for a "fat pitch"—a moment when the market overreacts to a temporary earnings miss or a cyclical lull, allowing us to buy these extraordinary cash flows at a significant discount to their intrinsic value.
FINAL INVESTMENT STANCE: WATCH
Deep Values Commentary#
The Risk Management Team debates and the Portfolio Manager provides final action-free commentary.
EXECUTIVE SUMMARY NVIDIA is a generational enterprise with a formidable moat, but its current $3.5 trillion valuation completely eradicates any Margin of Safety. The market is conflating a predictable secular trend (AI) with predictable, infinite cash flows for a cyclical hardware provider. With conservative DCF models projecting intrinsic value closer to $1 trillion, paying top dollar for peak cyclical earnings and ~78% gross margins mathematically guarantees capital impairment upon the inevitable mean reversion. We cannot suspend the laws of value investing for "new paradigms." Stance: WATCH.
SUMMARY OF KEY ARGUMENTS * The Bull (Risky Analyst): Argues AI is a continuous "new paradigm" moving from training to inference, smoothing historical cyclicality. Views the CUDA ecosystem as an impenetrable highway, justifying a 42x forward P/E and management’s aggressive share buybacks as proof of future hyper-growth. * The Bear (Safe Analyst): Highlights severe monopsony risk—NVIDIA's hyperscaler customers are highly incentivized to build custom silicon to bypass NVIDIA's 78% margins. Points out a glaring valuation disconnect: a conservative DCF yields a $1.04 trillion fair value, meaning the current $3.5T price offers zero margin of safety. * The Moderator (Neutral Analyst): Recognizes the moat's cracks and valuation risks but fears the opportunity cost of missing a secular trend. Suggests a phased technical entry (buying at the 200-day SMA) to balance FOMO with capital preservation.
RATIONALE: THE VALUE INVESTING LENS Under our framework, the greatest risk is permanently overpaying for a business, regardless of its quality. The Risky Analyst falls into the classic "this time is different" trap, assuming AI's secular growth eliminates hardware cyclicality. However, capitalism guarantees that 78% gross margins will attract fierce competition, primarily from NVIDIA’s own massive customers (hyperscalers). Furthermore, management buying back shares at nearly 42x forward earnings—while celebrated by the Risky Analyst—actually destroys long-term shareholder wealth if those shares are trading at a massive premium to intrinsic value. We must reject the Neutral Analyst's "phased entry" based on technical moving averages; value investors buy based on intrinsic discounts, not chart patterns.
REFINED INVESTOR PLAN & LESSONS LEARNED
Hello everyone. After reviewing the analysts' debate, we must step back and view NVIDIA strictly through our value investing framework. We demand enduring business quality, an unshakeable moat, and most importantly, a Margin of Safety.
The bull makes a compelling case for NVIDIA's CUDA ecosystem. By locking in developers, NVIDIA has created massive switching costs driving 78% gross margins. However, the Safe Analyst provides a necessary bucket of cold water: those margins are a neon sign inviting competition. NVIDIA faces severe monopsony risk as hyperscalers actively develop custom silicon to protect their own Return on Invested Capital (ROIC). As open-source frameworks become hardware-agnostic, CUDA's iron grip will loosen.
Mathematically, the current valuation is a bridge too far. At a $3.5 trillion market cap, generating roughly $58 billion in free cash flow, we are looking at a yield of under 2%. The Safe Analyst correctly notes a conservative DCF values the business closer to $1 trillion. The market is pricing in perpetual, uninterrupted hyper-growth, shattering any illusion of a margin of safety.
Reflecting on past mistakes, the Cisco analogy resonates deeply. In 2000, investors abandoned valuation discipline because the internet was a guaranteed revolution. Cisco was the undeniable pick-and-shovel winner. Yet, those who paid peak multiples suffered two lost decades of returns—not because the business failed, but because the price demanded a mathematically impossible future. I have been burned before by assuming cloud computing would end semiconductor boom-and-bust cycles. I will not repeat the mistake of assuming "this time is different" for AI hardware.
Moving forward, our monitoring plan will ignore daily price action and focus on underlying business fundamentals: 1. Hyperscaler CapEx Guidance: We will track Microsoft, Amazon, and Google. Any delayed deployment timelines will signal the beginning of a cyclical digestion phase. 2. Custom Silicon Adoption: We must monitor the viability of Google's TPUs and Amazon's Trainium to see if developers are successfully running models outside the CUDA ecosystem. 3. Gross Margin Compression: The moment we see sequential compression in that 78% figure, it will confirm supply is catching up to demand and pricing power is waning.
FINAL STANCE: WATCH We cannot advocate buying a heavily cyclical hardware business priced for absolute perfection. It violates our cardinal rule of demanding a Margin of Safety. However, it is an exceptional business. We will wait patiently on the sidelines for the inevitable cyclical downturn—when margins compress, momentum traders flee, and fear creates a genuine opportunity to buy this phenomenal company below its intrinsic value.