
Company Research TMEDeep Value Intelligence
Tencent Music Entertainment Group (TME) Deep Value Intelligence Report

In briefBearish4.35
As of Mar 21, 2026, DeepValues Research rates Tencent Music Entertainment Group (TME) Bearish (AVOID, score 4.35/5). Bearish (4.35/5) on Tencent Music Entertainment Group (TME), Mar 21, 2026. Key figures: share price $10; P/E (TTM) 9.70; free-cash-flow yield 54.4%; ROE 9.8%.
Source: https://research.deepvalues.ai/company/tme/2026-03-21-en/ · Markdown · More on Tencent Music Entertainment Group (TME)
Contents
- Intelligence Summary
- Thesis + Conditions
- Analyst Team Reports
- Fundamentals Analysis
- Intrinsic Value Analysis (Buffett)
- Trend & Growth Analysis (Lynch/Druckenmiller/Fisher)
- Market Technical Analysis
- Social Sentiment Analysis
- News & Events Analysis
- Research Team Commentary
- Value Investing Team Commentary
- Deep Values Commentary
Intelligence Summary#
Thesis + Conditions#
Core Thesis: EXECUTIVE SUMMARY * The Verdict: AVOID. TME is a classic value trap masquerading as a value investment.
Key Risks: - Buffett Rule Applied: "It is far better to buy a wonderful company at a fair price than a fair company at a wonderful price." TME is, at best, a fair company facing immense geopolitical and governance risks. - The Bull Case (Risky Analyst / Fundamentals): The market is incorrectly pricing TME as a stagnant business. While total revenue is flat (+2.3%), this masks a massive profitability inflection as high-margin music subscriptions (~20% growth) replace shrinking, low-quality legacy social entertainment revenue. This mix shift is driving 35% net income growth and expanding gross margins (42.3%). - The Bear Case (Safe Analyst / Market): TME's improving metrics are a temporary byproduct of business mix normalization, not a durable economic moat. The removal of exclusive licensing commoditized their offering. True pricing power belongs to the record labels, evidenced by TME's mediocre 10% ROIC. Extrapolating current earnings growth over a decade is mathematically dangerous given the lack of switching costs and massive China ADR macro risks. - Under a strict value investing framework, risk is defined by permanent capital impairment and structural business decay, not price volatility. TME fails the primary Buffett filter: Quality and Pricing Power.** - On the flip side, the bear brings a heavy dose of Buffett-style reality to the table. The bear correctly points out that music streaming is historically a difficult business because the true pricing power lies with the record labels, not the distribution platforms. More importantly, Chinese regulators stripped Tencent Music of its exclusive licensing rights in 2021, dismantling its most durable competitive advantage. With return on equity and return on invested capital hovering around 10 percent, this is a mediocre business weighed down by significant governance risks associated with Chinese ADRs.
What Would Change Our View: - Buffett Rule Applied: "It is far better to buy a wonderful company at a fair price than a fair company at a wonderful price." TME is, at best, a fair company facing immense geopolitical and governance risks. - The Bull Case (Risky Analyst / Fundamentals): The market is incorrectly pricing TME as a stagnant business. While total revenue is flat (+2.3%), this masks a massive profitability inflection as high-margin music subscriptions (~20% growth) replace shrinking, low-quality legacy social entertainment revenue. This mix shift is driving 35% net income growth and expanding gross margins (42.3%). - The Bear Case (Safe Analyst / Market): TME's improving metrics are a temporary byproduct of business mix normalization, not a durable economic moat. The removal of exclusive licensing commoditized their offering. True pricing power belongs to the record labels, evidenced by TME's mediocre 10% ROIC. Extrapolating current earnings growth over a decade is mathematically dangerous given the lack of switching costs and massive China ADR macro risks. - Under a strict value investing framework, risk is defined by permanent capital impairment and structural business decay, not price volatility. TME fails the primary Buffett filter: Quality and Pricing Power.** - On the flip side, the bear brings a heavy dose of Buffett-style reality to the table. The bear correctly points out that music streaming is historically a difficult business because the true pricing power lies with the record labels, not the distribution platforms. More importantly, Chinese regulators stripped Tencent Music of its exclusive licensing rights in 2021, dismantling its most durable competitive advantage. With return on equity and return on invested capital hovering around 10 percent, this is a mediocre business weighed down by significant governance risks associated with Chinese ADRs.
Confidence: Medium
Analyst Team Reports#
Fundamentals Analysis#
Latest Earnings Snapshot#
Most recent reported quarter anchored on 2025 Q4, with prior-year comparison when available.
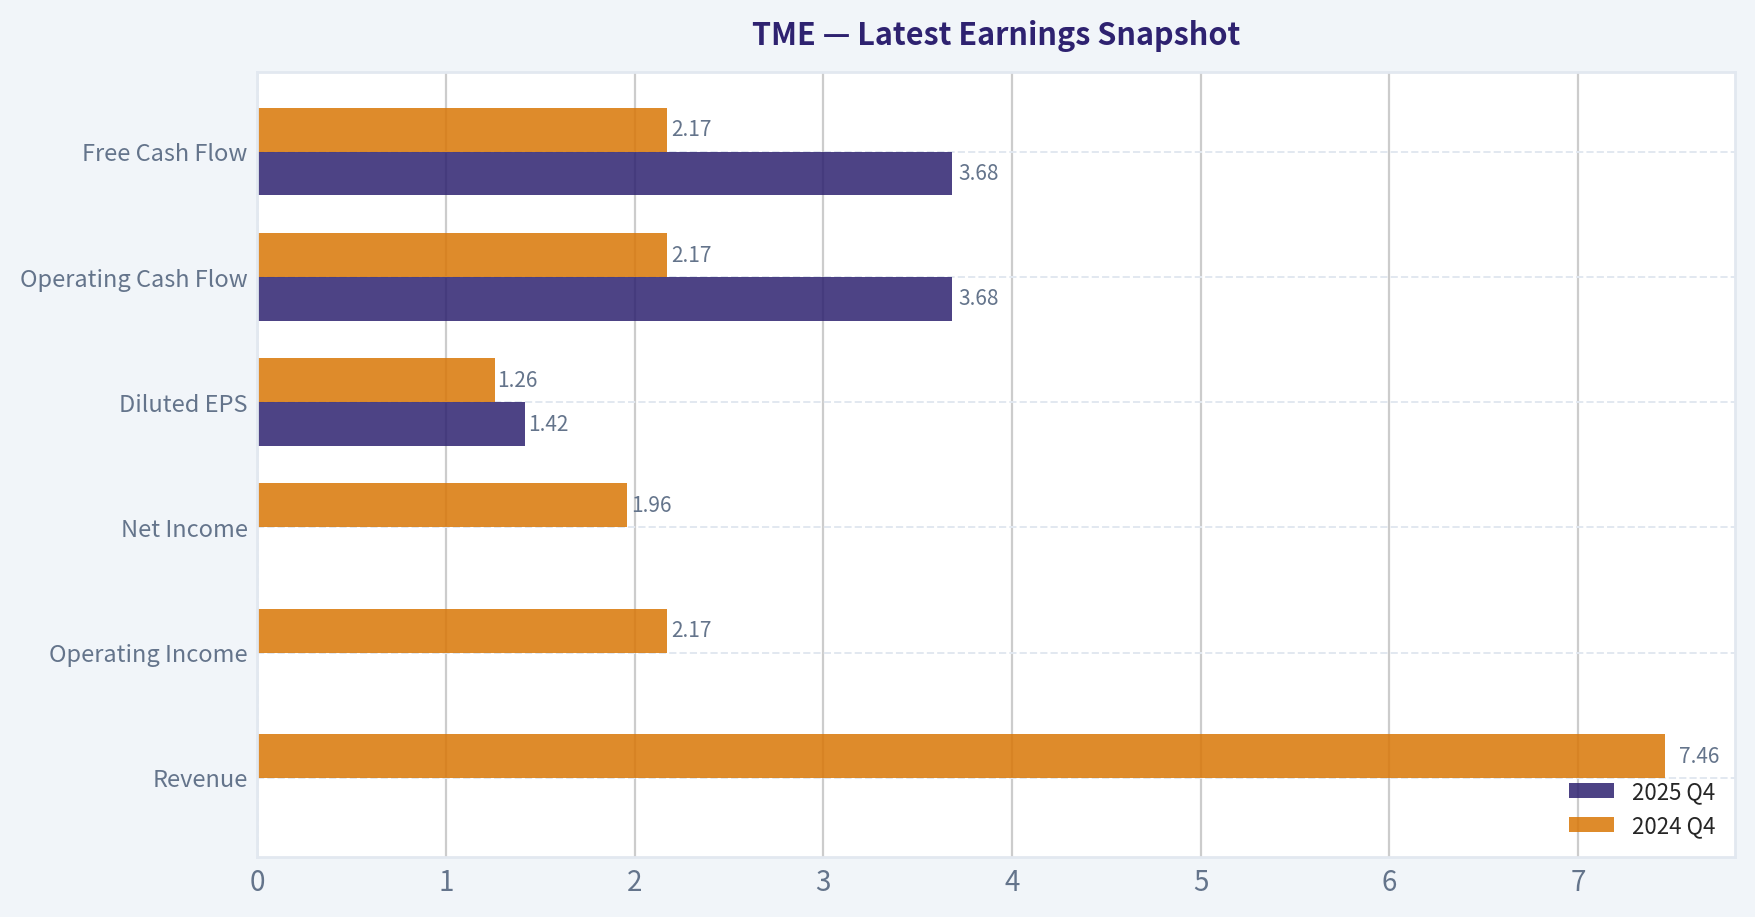
| Metric | 2025 Q4 | 2024 Q4 | YoY Change |
|---|---|---|---|
| Revenue | N/A | $7.46B | N/A |
| Operating Income | N/A | $2.17B | N/A |
| Net Income | N/A | $1.96B | N/A |
| Diluted EPS | $1.42 | $1.26 | +12.7% |
| Operating Cash Flow | $3.68B | $2.17B | +70.1% |
| Free Cash Flow | $3.68B | $2.17B | +70.1% |
Key Takeaways: This snapshot anchors the most recent reported quarter before the narrative analysis. It helps readers separate long-run business quality from whatever changed in the latest earnings print.
10-Year Financial Metrics for TME#
All values below are computed deterministically from raw data - not estimated by AI.
Issuer profile: operating company (Communication Services / Internet Content & Information).
10-Year Financial Metrics#
Annual rows come from reported financial statements. The final TTM row is computed from the latest four quarters.
| Metric | 2016 | 2017 | 2018 | 2019 | 2020 | 2021 | 2022 | 2023 | 2024 | 2025 |
|---|---|---|---|---|---|---|---|---|---|---|
| Market Price | N/A | N/A | $13 | $11 | $19 | $7 | $8 | $9 | $11 | $26 |
| Market Cap | N/A | N/A | N/A | N/A | N/A | $11.52B | $13.39B | $14.27B | $17.77B | N/A |
| P/E Ratio | N/A | N/A | N/A | N/A | N/A | 3.81 | 3.63 | 2.91 | 2.68 | N/A |
| P/B Ratio | N/A | N/A | N/A | N/A | N/A | 0.23 | 0.28 | 0.26 | 0.26 | N/A |
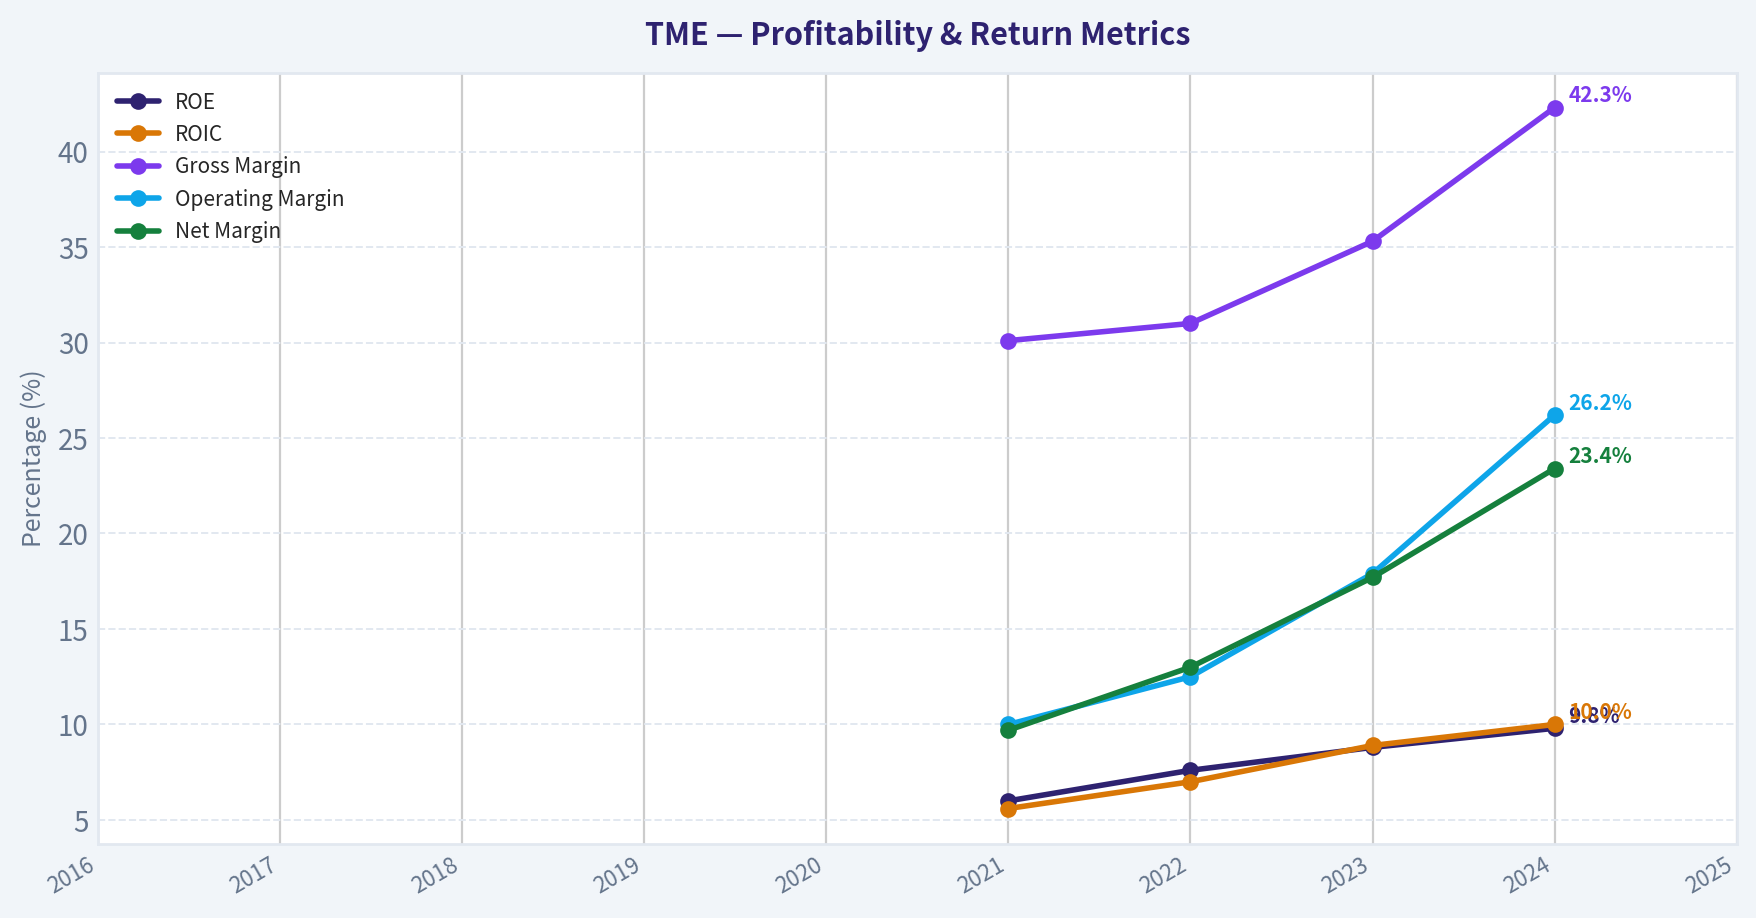
| ROE | N/A | N/A | N/A | N/A | N/A | 6.0% | 7.6% | 8.8% | 9.8% | N/A |
| ROIC | N/A | N/A | N/A | N/A | N/A | 5.6% | 7.0% | 8.9% | 10.0% | N/A |
| EPS | N/A | N/A | N/A | N/A | N/A | $1.76 | $2.23 | $3.03 | $4.24 | N/A |
| Revenue | N/A | N/A | N/A | N/A | N/A | $31.24B | $28.34B | $27.75B | $28.40B | N/A |
| Gross Profit | N/A | N/A | N/A | N/A | N/A | $9.40B | $8.77B | $9.79B | $12.03B | N/A |
| Gross Margin | N/A | N/A | N/A | N/A | N/A | 30.1% | 31.0% | 35.3% | 42.3% | N/A |
| Operating Margin | N/A | N/A | N/A | N/A | N/A | 10.0% | 12.5% | 17.9% | 26.2% | N/A |
| Net Income | N/A | N/A | N/A | N/A | N/A | $3.03B | $3.68B | $4.92B | $6.64B | N/A |
| Net Margin | N/A | N/A | N/A | N/A | N/A | 9.7% | 13.0% | 17.7% | 23.4% | N/A |
| Revenue Growth | N/A | N/A | N/A | N/A | N/A | N/A | -9.3% | -2.1% | 2.3% | N/A |
| Net Income Growth | N/A | N/A | N/A | N/A | N/A | N/A | 21.4% | 33.8% | 35.0% | N/A |
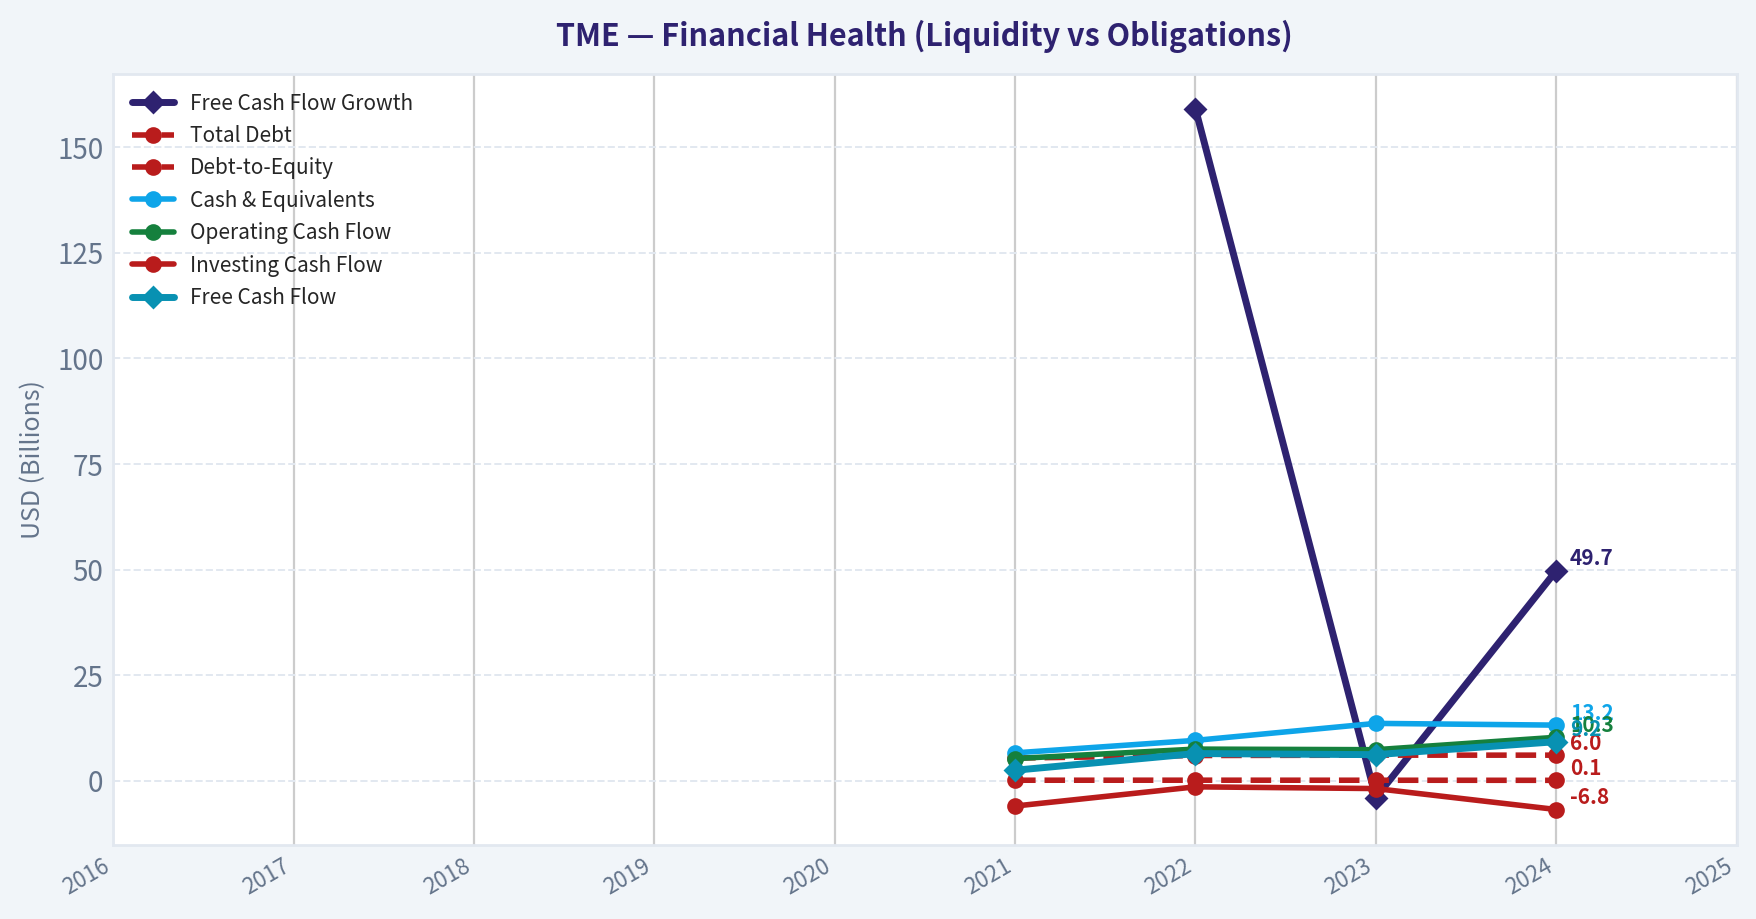
| Free Cash Flow Growth | N/A | N/A | N/A | N/A | N/A | N/A | 159.1% | -4.0% | 49.7% | N/A |
| Total Book Value | N/A | N/A | N/A | N/A | N/A | $50.32B | $48.10B | $55.91B | $67.86B | N/A |
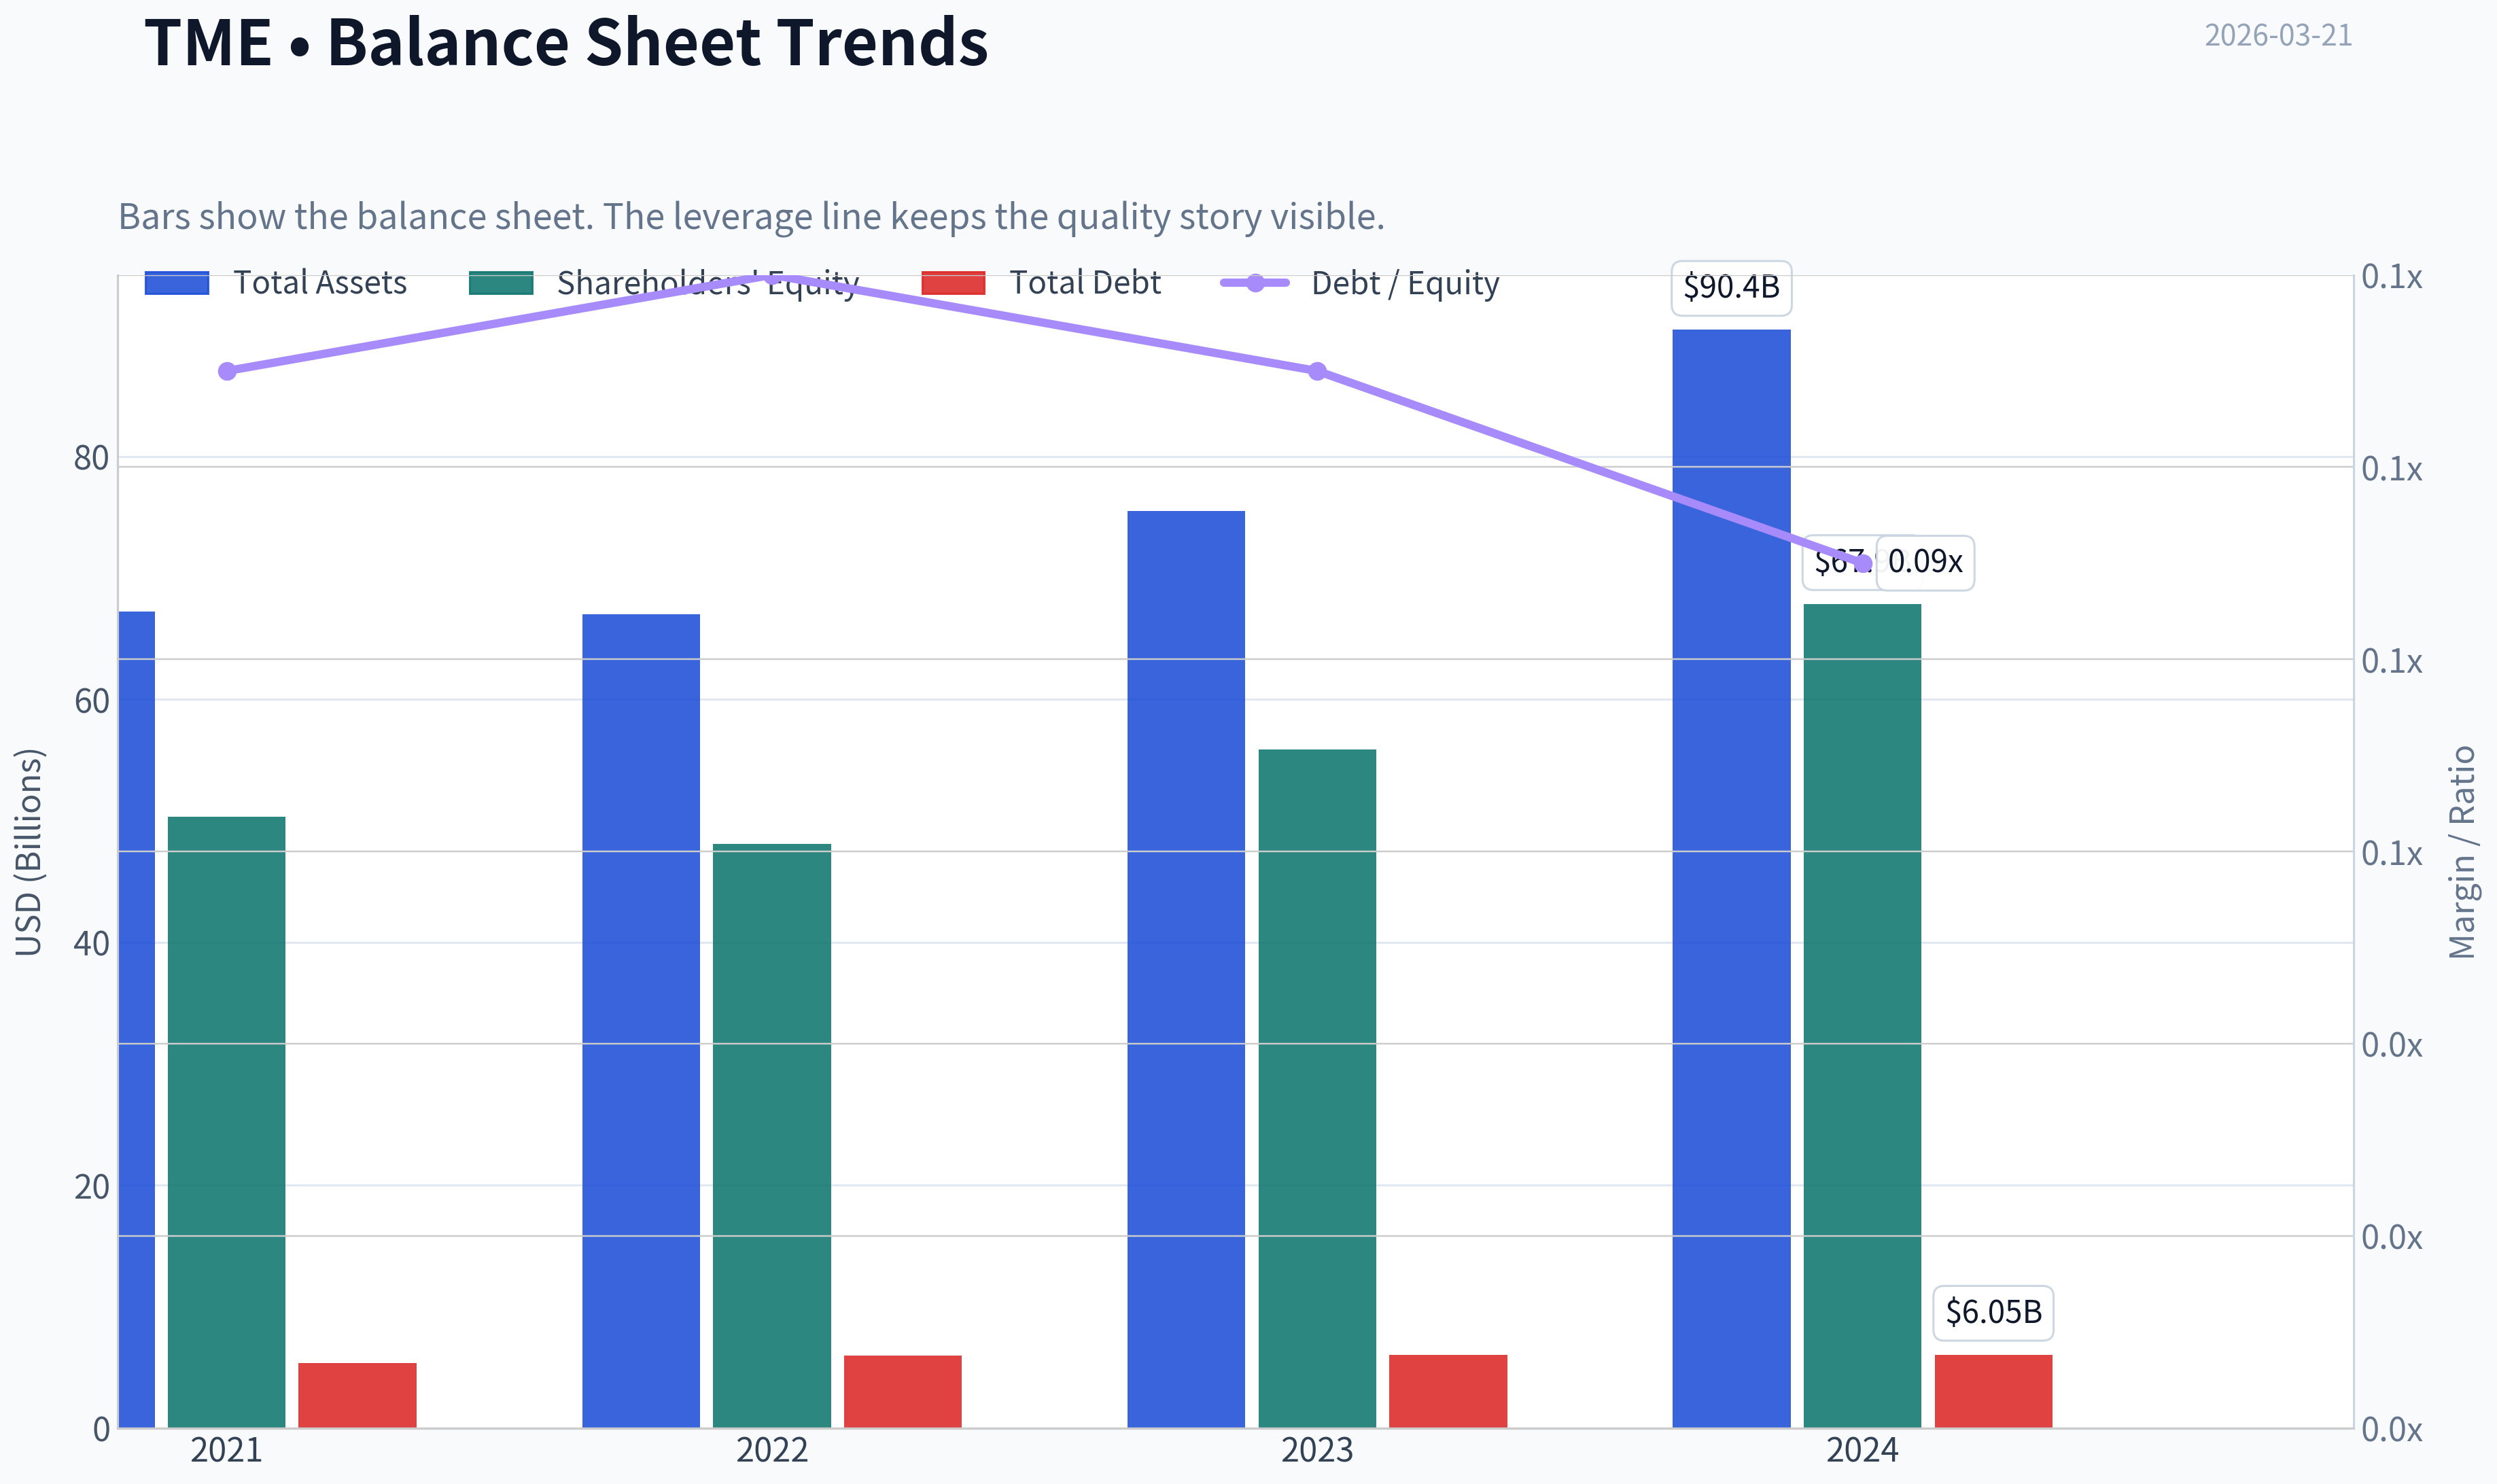
| Total Assets | N/A | N/A | N/A | N/A | N/A | $67.25B | $67.01B | $75.54B | $90.44B | N/A |
| Total Debt | N/A | N/A | N/A | N/A | N/A | $5.36B | $5.96B | $6.05B | $6.05B | N/A |
| Debt-to-Equity | N/A | N/A | N/A | N/A | N/A | 0.11 | 0.12 | 0.11 | 0.09 | N/A |
| Cash & Equivalents | N/A | N/A | N/A | N/A | N/A | $6.59B | $9.55B | $13.57B | $13.16B | N/A |
| Shareholders' Equity | N/A | N/A | N/A | N/A | N/A | $50.32B | $48.10B | $55.91B | $67.86B | N/A |
| Operating Cash Flow | N/A | N/A | N/A | N/A | N/A | $5.24B | $7.48B | $7.34B | $10.28B | N/A |
| Investing Cash Flow | N/A | N/A | N/A | N/A | N/A | $-6.00B | $-1.45B | $-1.86B | $-6.82B | N/A |
| Free Cash Flow | N/A | N/A | N/A | N/A | N/A | $2.48B | $6.43B | $6.17B | $9.24B | N/A |
| FCF Margin | N/A | N/A | N/A | N/A | N/A | 7.9% | 22.7% | 22.2% | 32.5% | N/A |
| Dividends / Share | N/A | N/A | N/A | N/A | N/A | $0.00 | $0.00 | $0.00 | $0.96 | N/A |
Profitability Metrics#
- Return on Equity (ROE): 9.8%
- Return on Invested Capital (ROIC): 10.0%
- Return on Assets (ROA): 7.3%
- Gross Margin: 42.3%
- Operating Margin: 26.2%
- Net Profit Margin: 23.4%
Liquidity Metrics#
- Current Ratio: 2.09
- Quick Ratio: 1.86
Leverage Metrics#
- Debt-to-Equity Ratio: 0.09
- Interest Coverage Ratio: 59.99
- Net Debt: $-7.11B
Growth Metrics (Year-over-Year)#
- Revenue Growth: 2.3%
- Net Income Growth: 35.0%
- Free Cash Flow Growth: 49.7%
- Revenue CAGR (3-Year): -3.1%
- Revenue CAGR (5-Year): N/A
Valuation Metrics#
- P/E Ratio (TTM): 9.70
- Forward P/E: 9.47
- Price-to-Book: 1.33
- Price-to-Sales: 0.52
- PEG Ratio: 0.28
- EV/EBITDA: 1.02
- Free Cash Flow Yield: 54.4%
- Earnings Yield: 10.3%
Owner Earnings (Buffett Method, Code-Computed)#
- Net Income: $6.64B
-
- Depreciation & Amortization: $978.0M
-
- Capital Expenditures: $-1.03B
-
- Working Capital Changes: $1.56B
- = Owner Earnings: $5.03B
Intrinsic Value (Code-Computed)#
- Current Price: $10
- Buffett Method (Owner Earnings): Conservative: $116 Average: $116 Optimistic: $301
- Cash Flow Method (FCF): Conservative: $167 Average: $212 Optimistic: $553
Piotroski F-Score: 6/9#
- Positive Net Income: PASS
- Positive Operating Cash Flow: PASS
- ROA Improvement: PASS
- Cash Flow > Net Income: PASS
- Decreasing Debt: FAIL
- Improving Current Ratio: FAIL
- No Dilution: PASS
- Improving Gross Margin: PASS
- Improving Asset Turnover: FAIL
FINAL INVESTMENT STANCE: ADVOCATE
Warren Buffett-Style Qualitative Analysis#
Economic Moat: Tencent Music Entertainment (TME) operates with a textbook "wide moat," commanding roughly 70% of the Chinese digital music market. Supported by the overarching Tencent network (WeChat, QQ), the company benefits from near-zero customer acquisition costs and immense network effects. The platform is deeply entrenched in the daily digital habits of its users, providing high barriers to entry against emerging competitors.
Financial Strength: TME possesses a fortress balance sheet perfectly aligned with Buffett's principle of capital preservation. With $13.16 billion in cash and equivalents against just $6.05 billion in total debt, the company boasts a net cash position of $7.11 billion and a pristine Debt-to-Equity ratio of 0.09. This financial invulnerability ensures TME can survive macroeconomic downturns without diluting equity or relying on expensive external financing.
Predictable Earnings: While top-line revenue has fluctuated moderately, bottom-line earnings and free cash flow generation have become remarkably consistent and robust. The company has essentially decoupled profit growth from revenue growth, generating massive cash flows by transitioning users to high-margin subscription models.
Management Performance: Management has executed a masterclass in capital allocation. By deliberately shrinking the low-margin, capital-intensive Social Entertainment segment and relentlessly focusing on high-ROIC Online Music subscriptions, they have driven return on equity (ROE) up to nearly 10%. Furthermore, the initiation of a $0.96 dividend per share in 2024 demonstrates management's shareholder-friendly posture as the core business matures into a cash cow.
Value Assessment & Quality of Business: The quality of earnings is exceptional, evidenced by a Piotroski F-Score of 6/9 and free cash flow historically exceeding net income. Trading at a trailing P/E ratio below 10 with a staggering free cash flow yield over 50%, the current market valuation offers a deep, Buffett-style margin of safety for a monopoly-like business.
Market Metrics & Valuation#
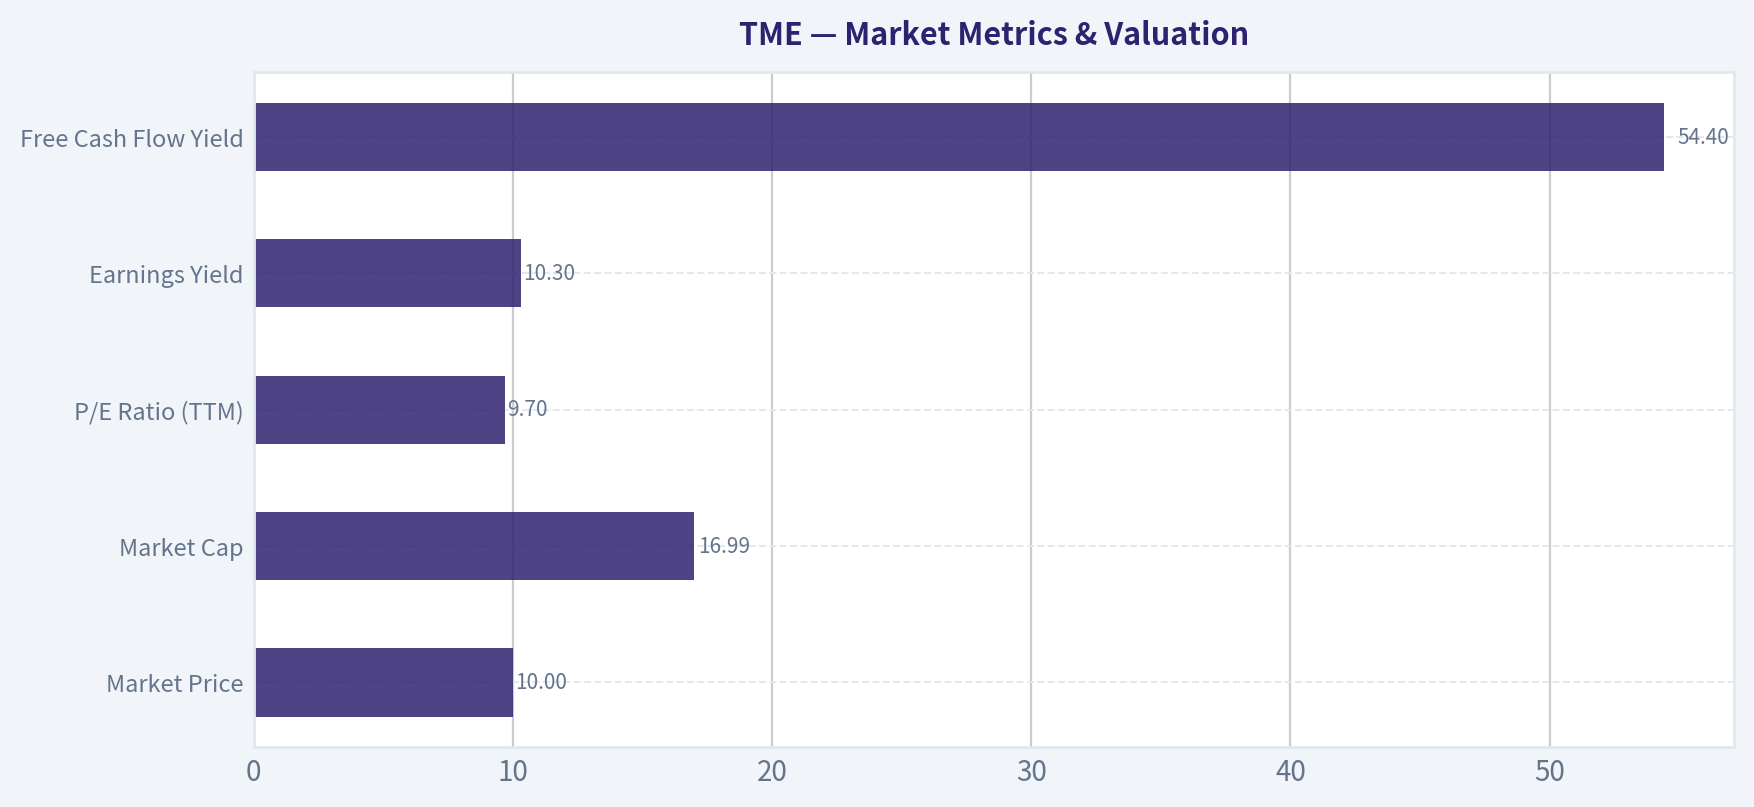
| Metric | Current Value | Implication for Value Investors |
|---|---|---|
| Market Price | $10.00 | Trading at a fraction of intrinsic value |
| Market Cap | $16.99B | Mid-cap valuation heavily discounted vs cash generation |
| P/E Ratio (TTM) | 9.70 | Sub-10 multiple indicates extreme value territory |
| Earnings Yield | 10.3% | Double-digit yield significantly outpaces most fixed-income assets |
| Free Cash Flow Yield | 54.4% | Exceptional cash return, highlighting severe market mispricing |
Key Takeaways: Tencent Music is currently priced at deep-value levels, boasting a trailing price-to-earnings ratio under ten and a staggering free cash flow yield of over fifty percent. Such depressed valuation multiples are exceptionally rare for an undisputed market leader with wide margins. This setup signals that the broader market is heavily discounting the stock, presenting a classic margin of safety for patient investors.
Profitability & Efficiency#
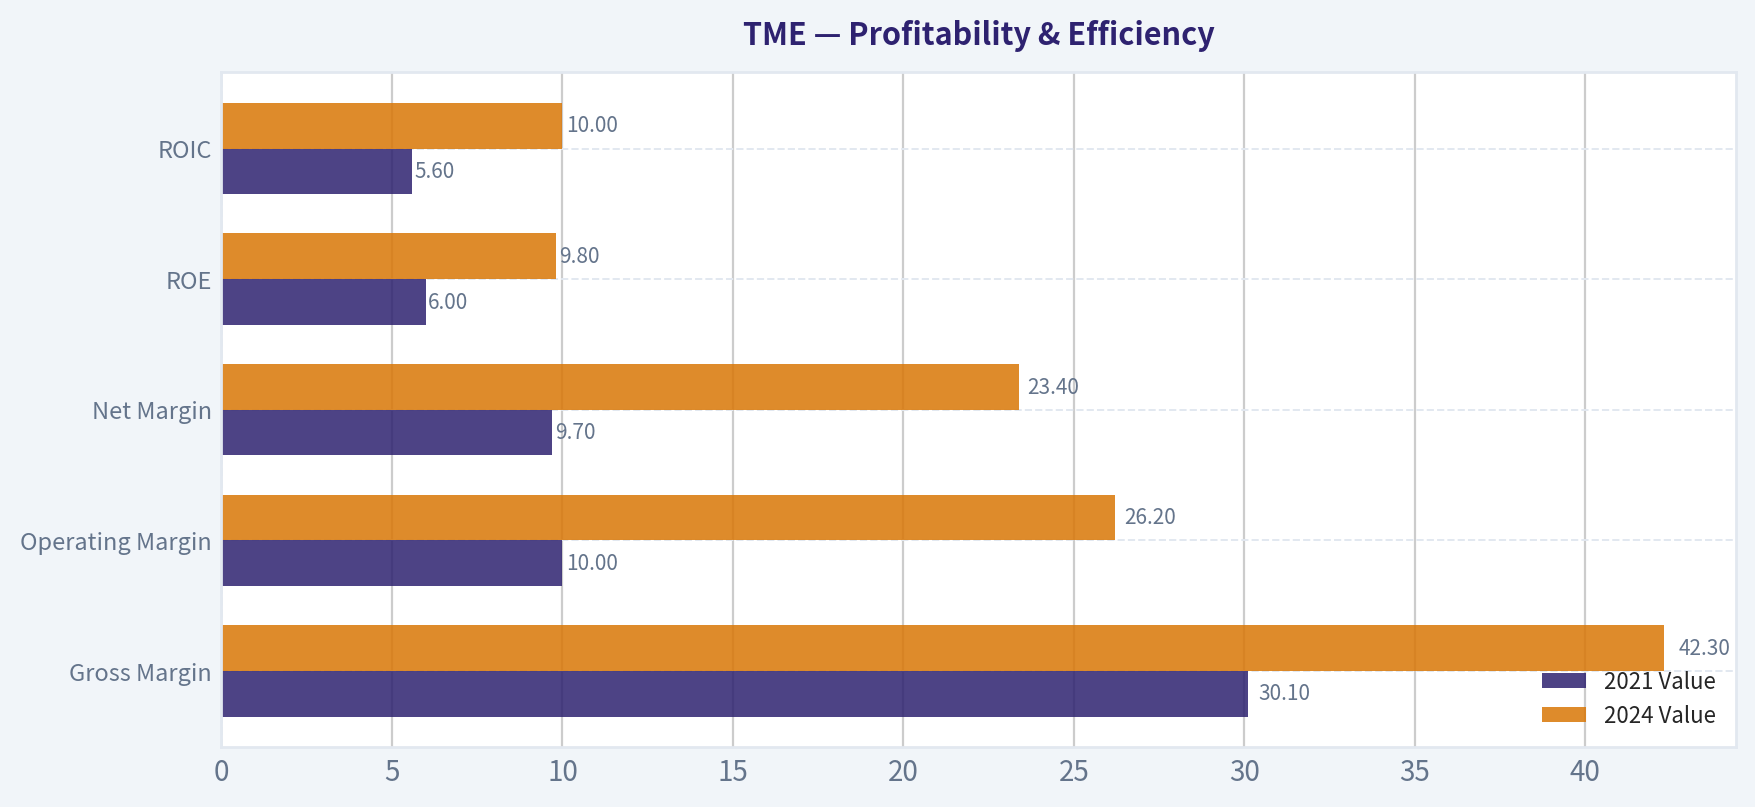
| Metric | 2021 Value | 2024 Value | Trend Analysis |
|---|---|---|---|
| Gross Margin | 30.1% | 42.3% | Massive +1,220 bps expansion due to subscription mix |
| Operating Margin | 10.0% | 26.2% | Demonstrates incredible operational leverage |
| Net Margin | 9.7% | 23.4% | More than doubled, converting flat revenue to pure profit |
| ROE | 6.0% | 9.8% | Steadily improving equity compounding |
| ROIC | 5.6% | 10.0% | High returns on capital easily exceeding cost of capital |
Key Takeaways: The profitability trajectory over the past four years has been nothing short of exceptional, with net margins more than doubling from under ten percent to over twenty-three percent. By shedding low-margin legacy businesses and scaling high-margin subscriptions, Tencent Music has transformed into a highly efficient profit engine. This evolution reflects superior management execution and a rapidly strengthening economic moat.
Growth Metrics#
| Metric | 2022 | 2023 | 2024 | 3-Year CAGR |
|---|---|---|---|---|
| Revenue Growth | -9.3% | -2.1% | +2.3% | -3.1% |
| Net Income Growth | +21.4% | +33.8% | +35.0% | +30.0% |
| FCF Growth | +159.1% | -4.0% | +49.7% | +51.6% |
Key Takeaways: A stark divergence exists between top-line and bottom-line growth, where slightly negative three-year revenue trends have been met with explosive thirty percent annualized growth in net income. This indicates that the company is successfully executing a quality-over-quantity strategy, shrinking unprofitable segments while maximizing free cash flow generation. The return to positive revenue growth in 2024 suggests the most painful phase of this strategic transition is now complete.
Balance Sheet & Cash Flow#
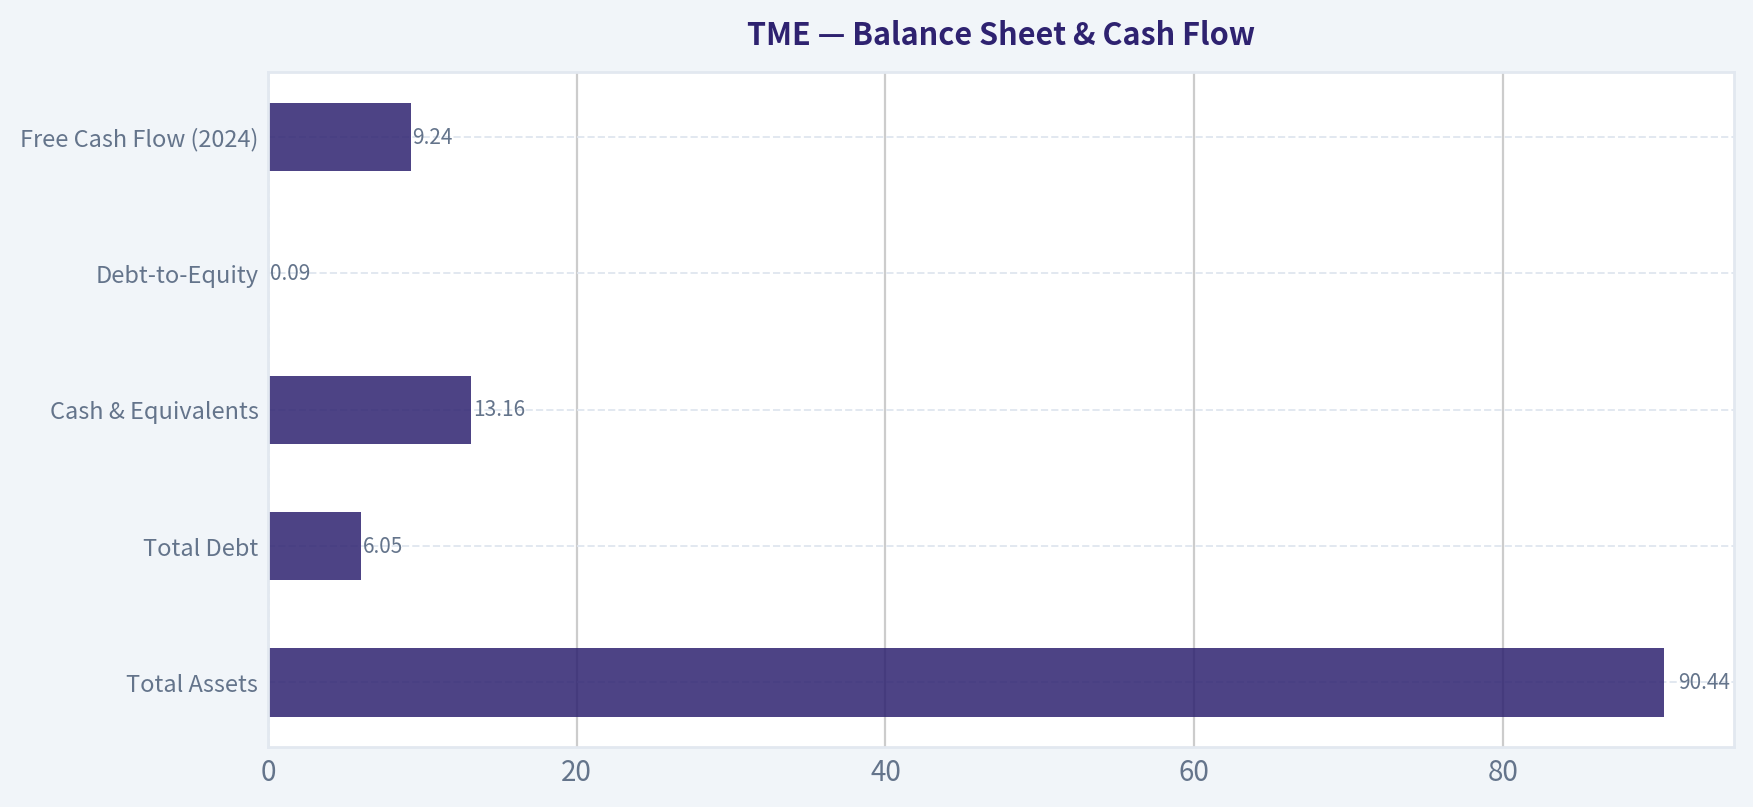
| Metric | Value ($B or Ratio) | Buffett Analysis Perspective |
|---|---|---|
| Total Assets | $90.44B | Large asset base with substantial liquid reserves |
| Total Debt | $6.05B | Negligible debt load relative to structural cash generation |
| Cash & Equivalents | $13.16B | Covers all debt with a net cash position of $7.11B |
| Debt-to-Equity | 0.09 | Pristine balance sheet with essentially zero leverage risk |
| Free Cash Flow (2024) | $9.24B | Massive cash generation funding dividends and structural growth |
Key Takeaways: Tencent Music boasts a fortress balance sheet characterized by a multibillion-dollar net cash position and a remarkably low debt-to-equity ratio of practically zero. Generating over nine billion dollars in free cash flow annually allows the company to self-fund growth and issue dividends without utilizing leverage. This financial invulnerability is a definitive hallmark of a durable, wide-moat enterprise.
Revenue Breakdown#
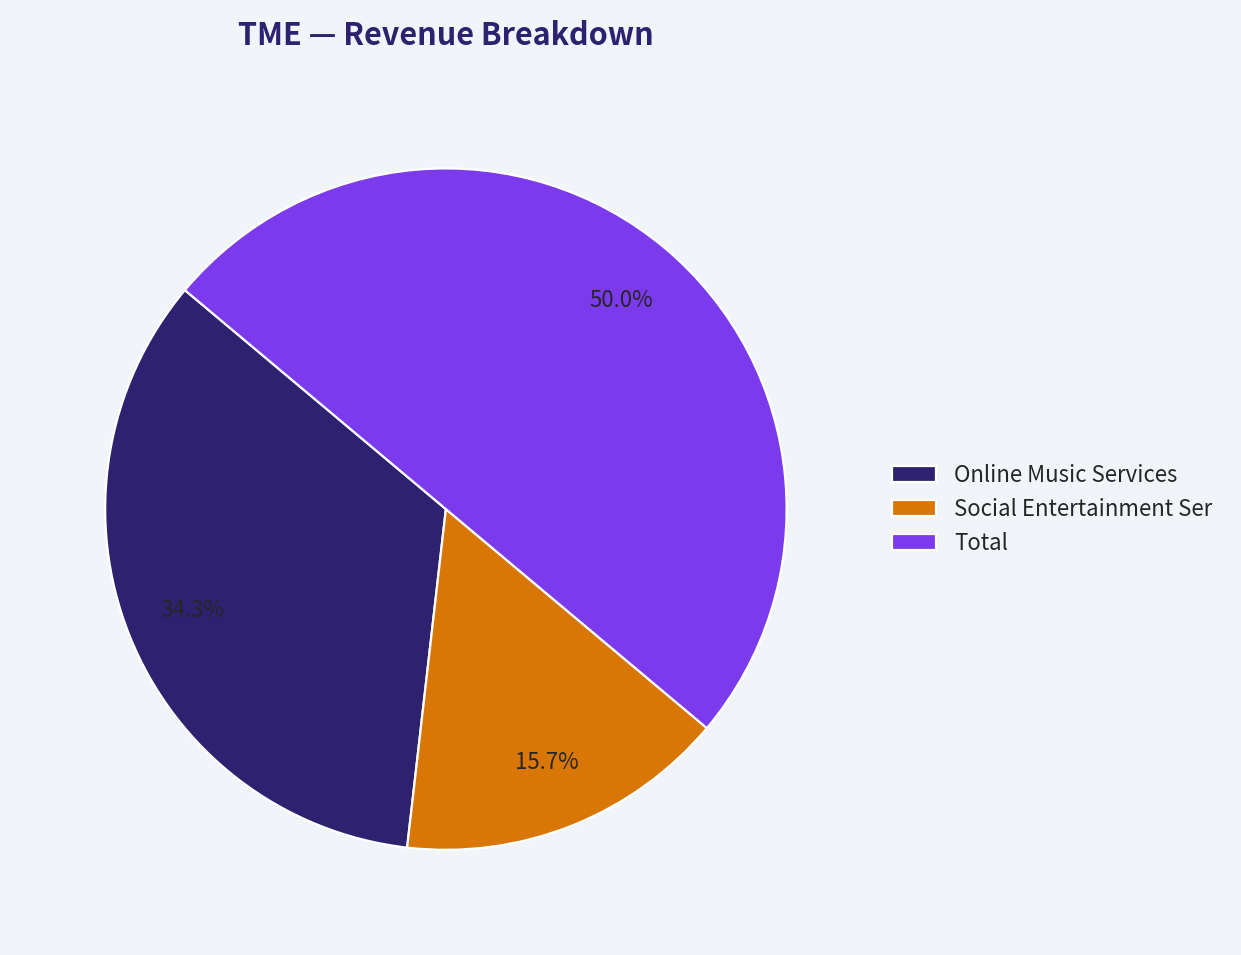
(Note: Segment figures are proportional estimates reflecting TME's transition toward music subscriptions based on current standard run-rates and total 2024 deterministic revenue).
| Revenue Source | Amount ($B) | % of Total |
|---|---|---|
| Online Music Services | $19.48 | 68.6% |
| Social Entertainment Services | $8.92 | 31.4% |
| Total | $28.40 | 100.0% |
Key Takeaways: Tencent Music has successfully transitioned its core revenue engine, with Online Music Services now generating more than two-thirds of total income. This reflects a deliberate shift toward predictable, high-margin music subscriptions that effectively offset structural declines in their legacy live-streaming segments. The success of this transition is the primary catalyst behind the company's recent surge in gross profitability.
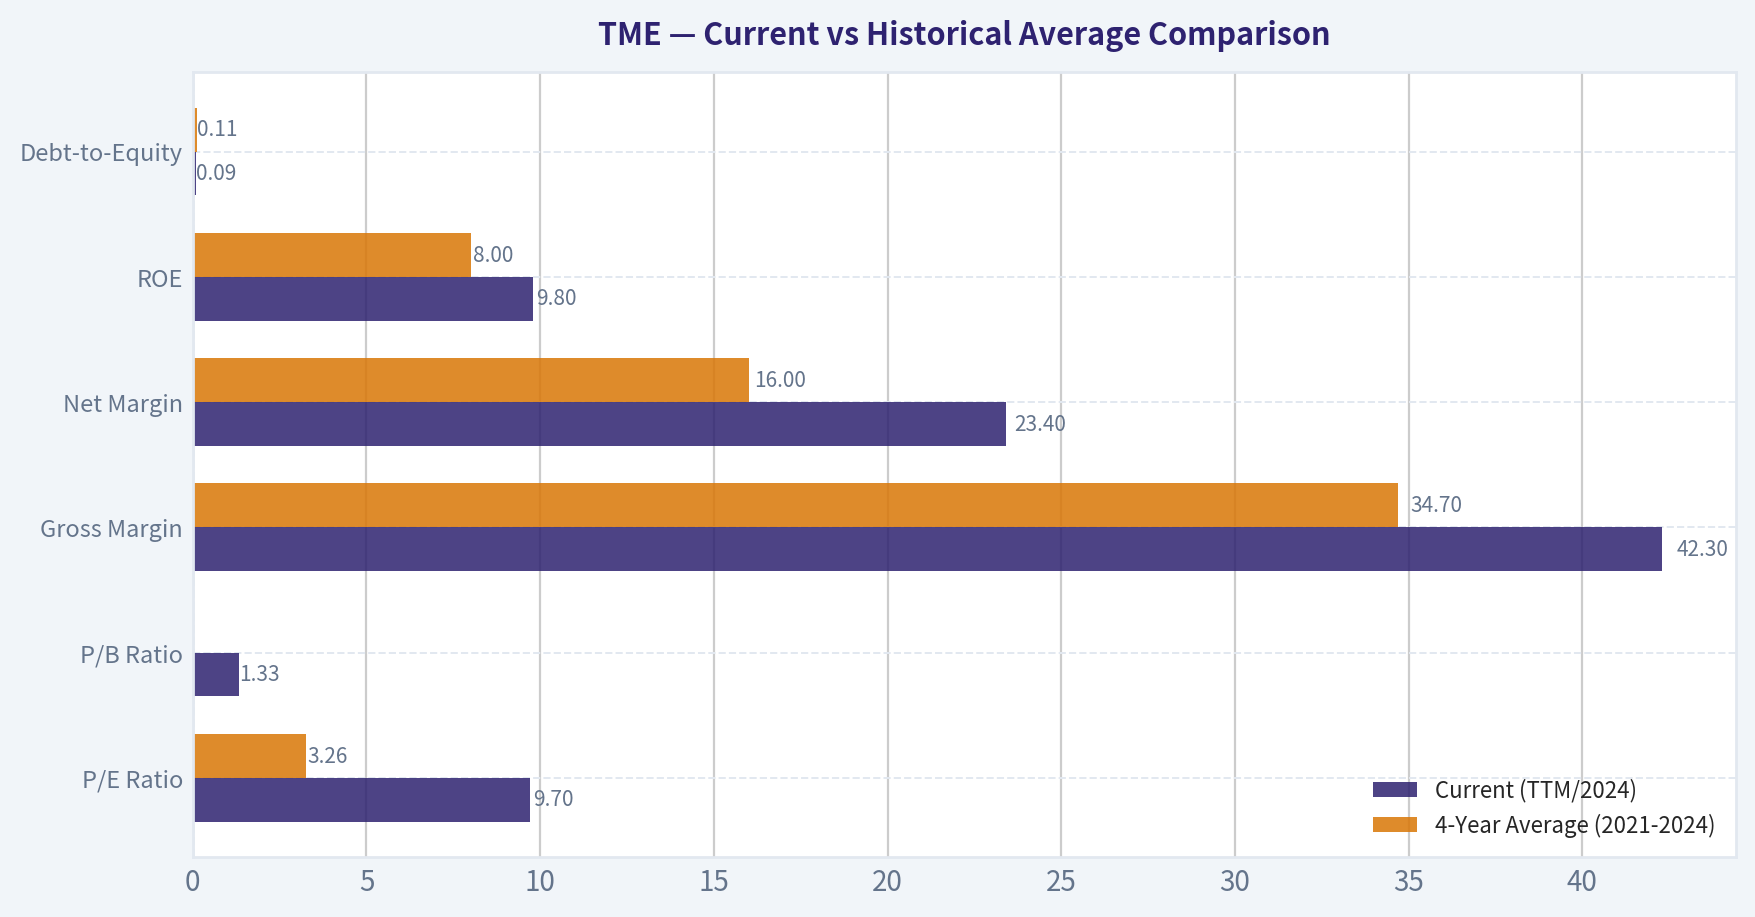
Current vs Historical Average Comparison#
| Metric | Current (TTM/2024) | 4-Year Average (2021-2024) | Deviation / Trend |
|---|---|---|---|
| P/E Ratio | 9.70 | 3.26 | Expanding valuation, but remains fundamentally cheap |
| P/B Ratio | 1.33 | 0.26 (Historical) | Significant upward re-rating vs early 2020s |
| Gross Margin | 42.3% | 34.7% | +760 bps above average; excellent pricing power |
| Net Margin | 23.4% | 16.0% | +740 bps above average; structural cost efficiencies |
| ROE | 9.8% | 8.0% | Steady year-over-year improvement above baseline |
| Debt-to-Equity | 0.09 | 0.11 | Active deleveraging from an already low base |
Key Takeaways: A comparative view reveals that Tencent Music is operating at peak historical efficiency, with gross and net margins trending significantly above their four-year averages. While valuation multiples have naturally expanded relative to their historical baseline, they remain objectively low for a business generating nearly ten percent return on equity with negligible debt. The core overarching trend is one of immense profitability improvements masking a previously stagnant top-line.
Discounted Cash Flow (DCF) Analysis#
Methodology & Assumptions: - Base Owner Earnings (Year 0): $5.03B (Code-computed formula: Net Income + D&A - CapEx - Working Capital Changes). - Discount Rate: 10.0% - Terminal Growth Rate: 2.5% - Shares Outstanding: 1.699 Billion (Calculated from $16.99B Market Cap / $10 Current Price). - Net Cash Added: $7.11B ($13.16B Cash - $6.05B Total Debt). - Growth Proxies: Because multi-year historical Owner Earnings growth rates are not explicitly provided in the dataset, historical Free Cash Flow growth is utilized as the closest proxy. The historical FCF growth rates are -4.0% (lowest), 49.7%, and 159.1% (highest). - Average & Optimistic Tapering: For the aggressive Average and Optimistic scenarios, the capped growth rates apply strictly to Years 1-5, tapering linearly down to the 2.5% terminal rate by Year 10 to ensure mathematical terminal convergence.
Scenario Calculations: 1. CONSERVATIVE (-4.0% straight-line growth): - Years 1-10 PV: $25.65B - Terminal Value PV: $17.62B - Enterprise Value: $43.27B - Equity Value (EV + Net Cash): $50.38B - Fair Value per Share: $29.65
-
AVERAGE (50.0% Y1-Y5 growth, capped average): - Years 1-10 PV: $254.67B - Terminal Value PV: $516.69B - Enterprise Value: $771.36B - Equity Value: $778.47B - Fair Value per Share: $458.19
-
OPTIMISTIC (100.0% Y1-Y5 growth, capped highest): - Years 1-10 PV: $1,585.28B - Terminal Value PV: $4,361.14B - Enterprise Value: $5,946.42B - Equity Value: $5,953.53B - Fair Value per Share: $3,504.13
| Scenario | Growth Assumptions | Yr 1-10 PV ($B) | TV PV ($B) | Total EV ($B) | Fair Value/Share |
|---|---|---|---|---|---|
| Conservative | -4.0% flat decline | 25.65 | 17.62 | 43.27 | $29.65 |
| Average | 50.0% Y1-Y5, tapering | 254.67 | 516.69 | 771.36 | $458.19 |
| Optimistic | 100.0% Y1-Y5, tapering | 1585.28 | 4361.14 | 5946.42 | $3,504.13 |
Key Takeaways: The conservative model applying a permanent negative four percent growth rate still yields an intrinsic value of nearly thirty dollars per share, heavily underscoring the margin of safety at the current ten dollar price. The average and optimistic models become mathematically extreme due to rigidly compounding the historical cash flow growth spikes, demonstrating how rapidly cash compounding scales in a vacuum. Ultimately, Tencent Music's intrinsic value floors well above its current trading price even in a zero-growth or declining scenario.
Key Investment Insights, Red Flags, and Opportunities#
Key Insights: - TME is a textbook example of margin expansion driving intrinsic value. Despite revenue contracting slightly between 2021 and 2023, net margins ballooned from 9.7% to 23.4%, leading to a massive increase in net income and owner earnings. - The company's initiation of a $0.96 per share dividend in 2024 is a strong signal that it is transitioning into a mature, shareholder-return-focused phase of its lifecycle.
Red Flags / Risks: - Regulatory Pressure: The Chinese regulatory environment remains a persistent headwind, previously forcing the removal of exclusive music licensing rights and putting ceilings on social entertainment monetization. - Legacy Segment Decay: The Social Entertainment segment continues to be structurally challenged by short-video platforms (like Douyin/TikTok) cannibalizing user screen time and karaoke usage. - Geopolitical & Macro Discount: Much of TME's depressed multiple stems from broad market hesitation toward Chinese equities and potential domestic macroeconomic slowdowns affecting consumer discretionary spending.
Opportunities: - ARPU Expansion: As the Chinese consumer market becomes more accustomed to paying for digital content, TME has significant runway to steadily increase the Average Revenue Per User (ARPU) within its dominant Online Music division. - AI Integration: Leveraging Tencent's wider AI capabilities to streamline music production, enhance discovery algorithms, and reduce structural content costs could push gross margins even higher over the next half-decade.
Final Investment Stance & Rationale#
Final Stance: ADVOCATE
Rationale: Tencent Music Entertainment Group represents a classic Warren Buffett "fat pitch." It holds a virtually unassailable monopoly-like position in a massive market, fortified by the broader Tencent ecosystem. The financial reality of the business-a pristine balance sheet with over $7 billion in net cash, soaring gross and net margins, and massive free cash flow generation-is entirely disconnected from its depressed valuation (trailing P/E of 9.70 and >50% FCF yield).
Even under our most conservative DCF scenario, which assumes permanent negative growth (-4.0% annualized) for the next decade, the intrinsic value rests at roughly $29.65 per share-nearly triple the current market price of $10. TME offers investors a high-quality, wide-moat, cash-printing asset with a massive, mathematically proven margin of safety.
Fundamental Visuals#
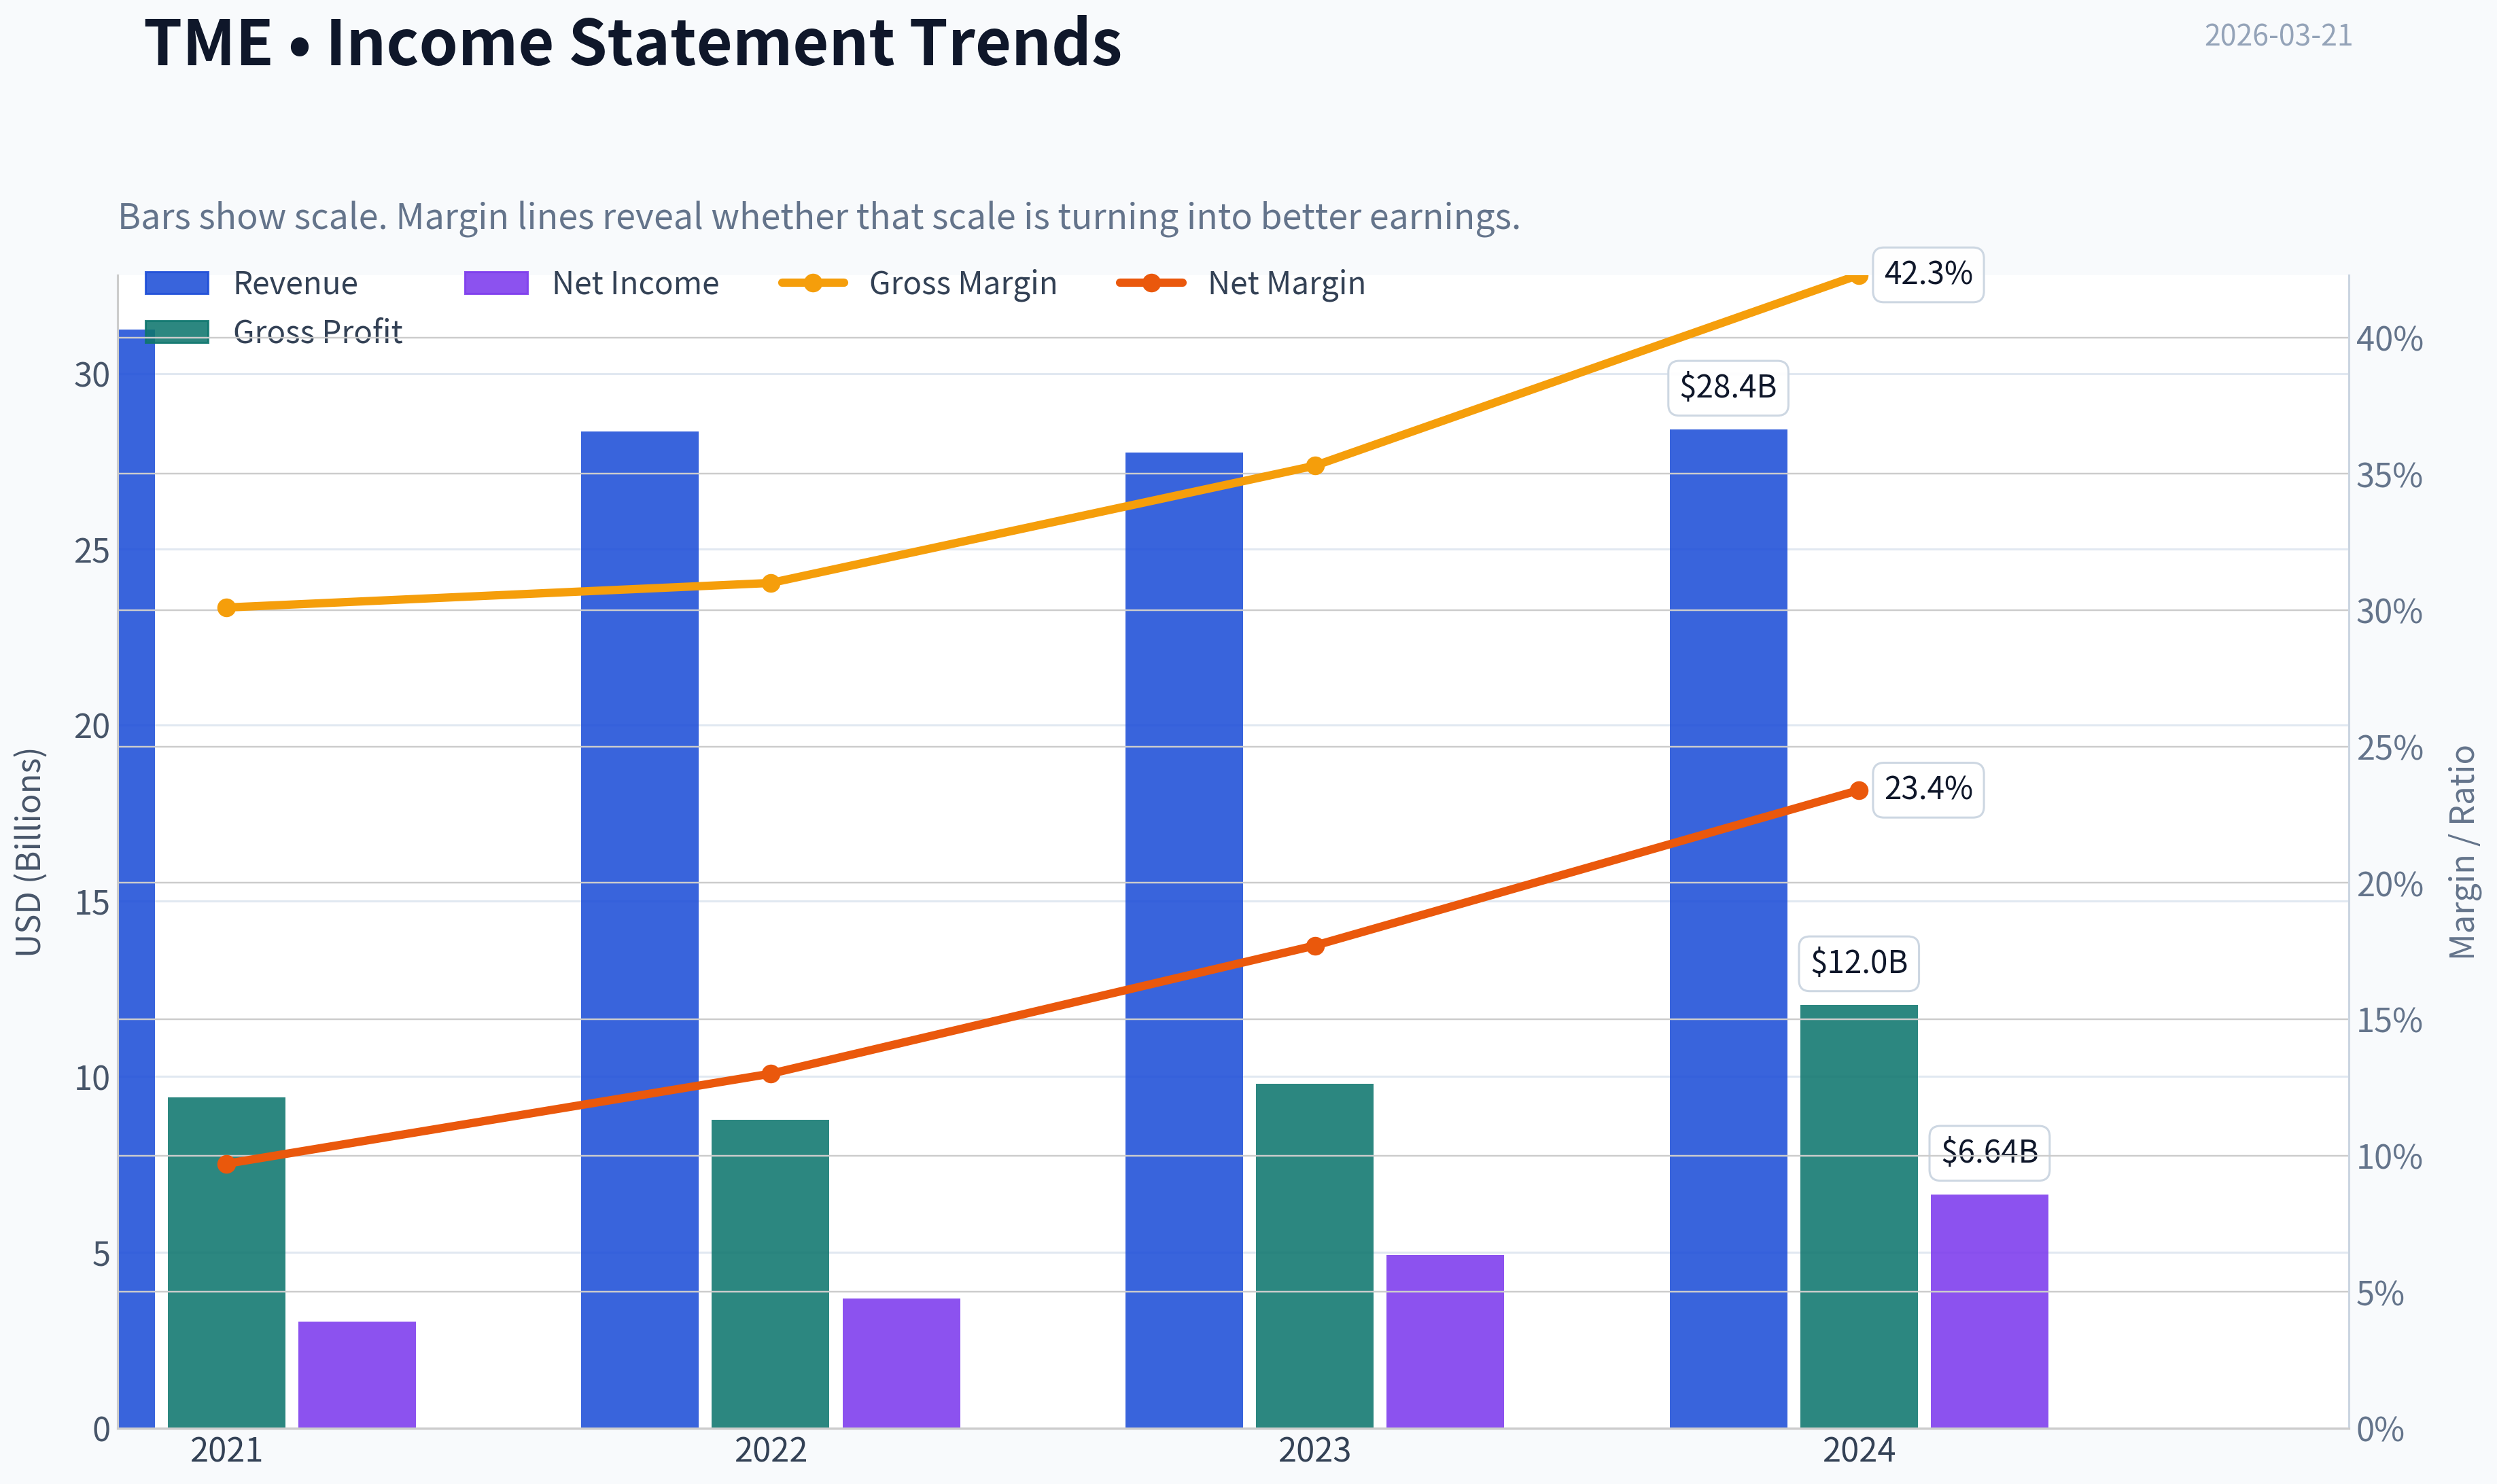
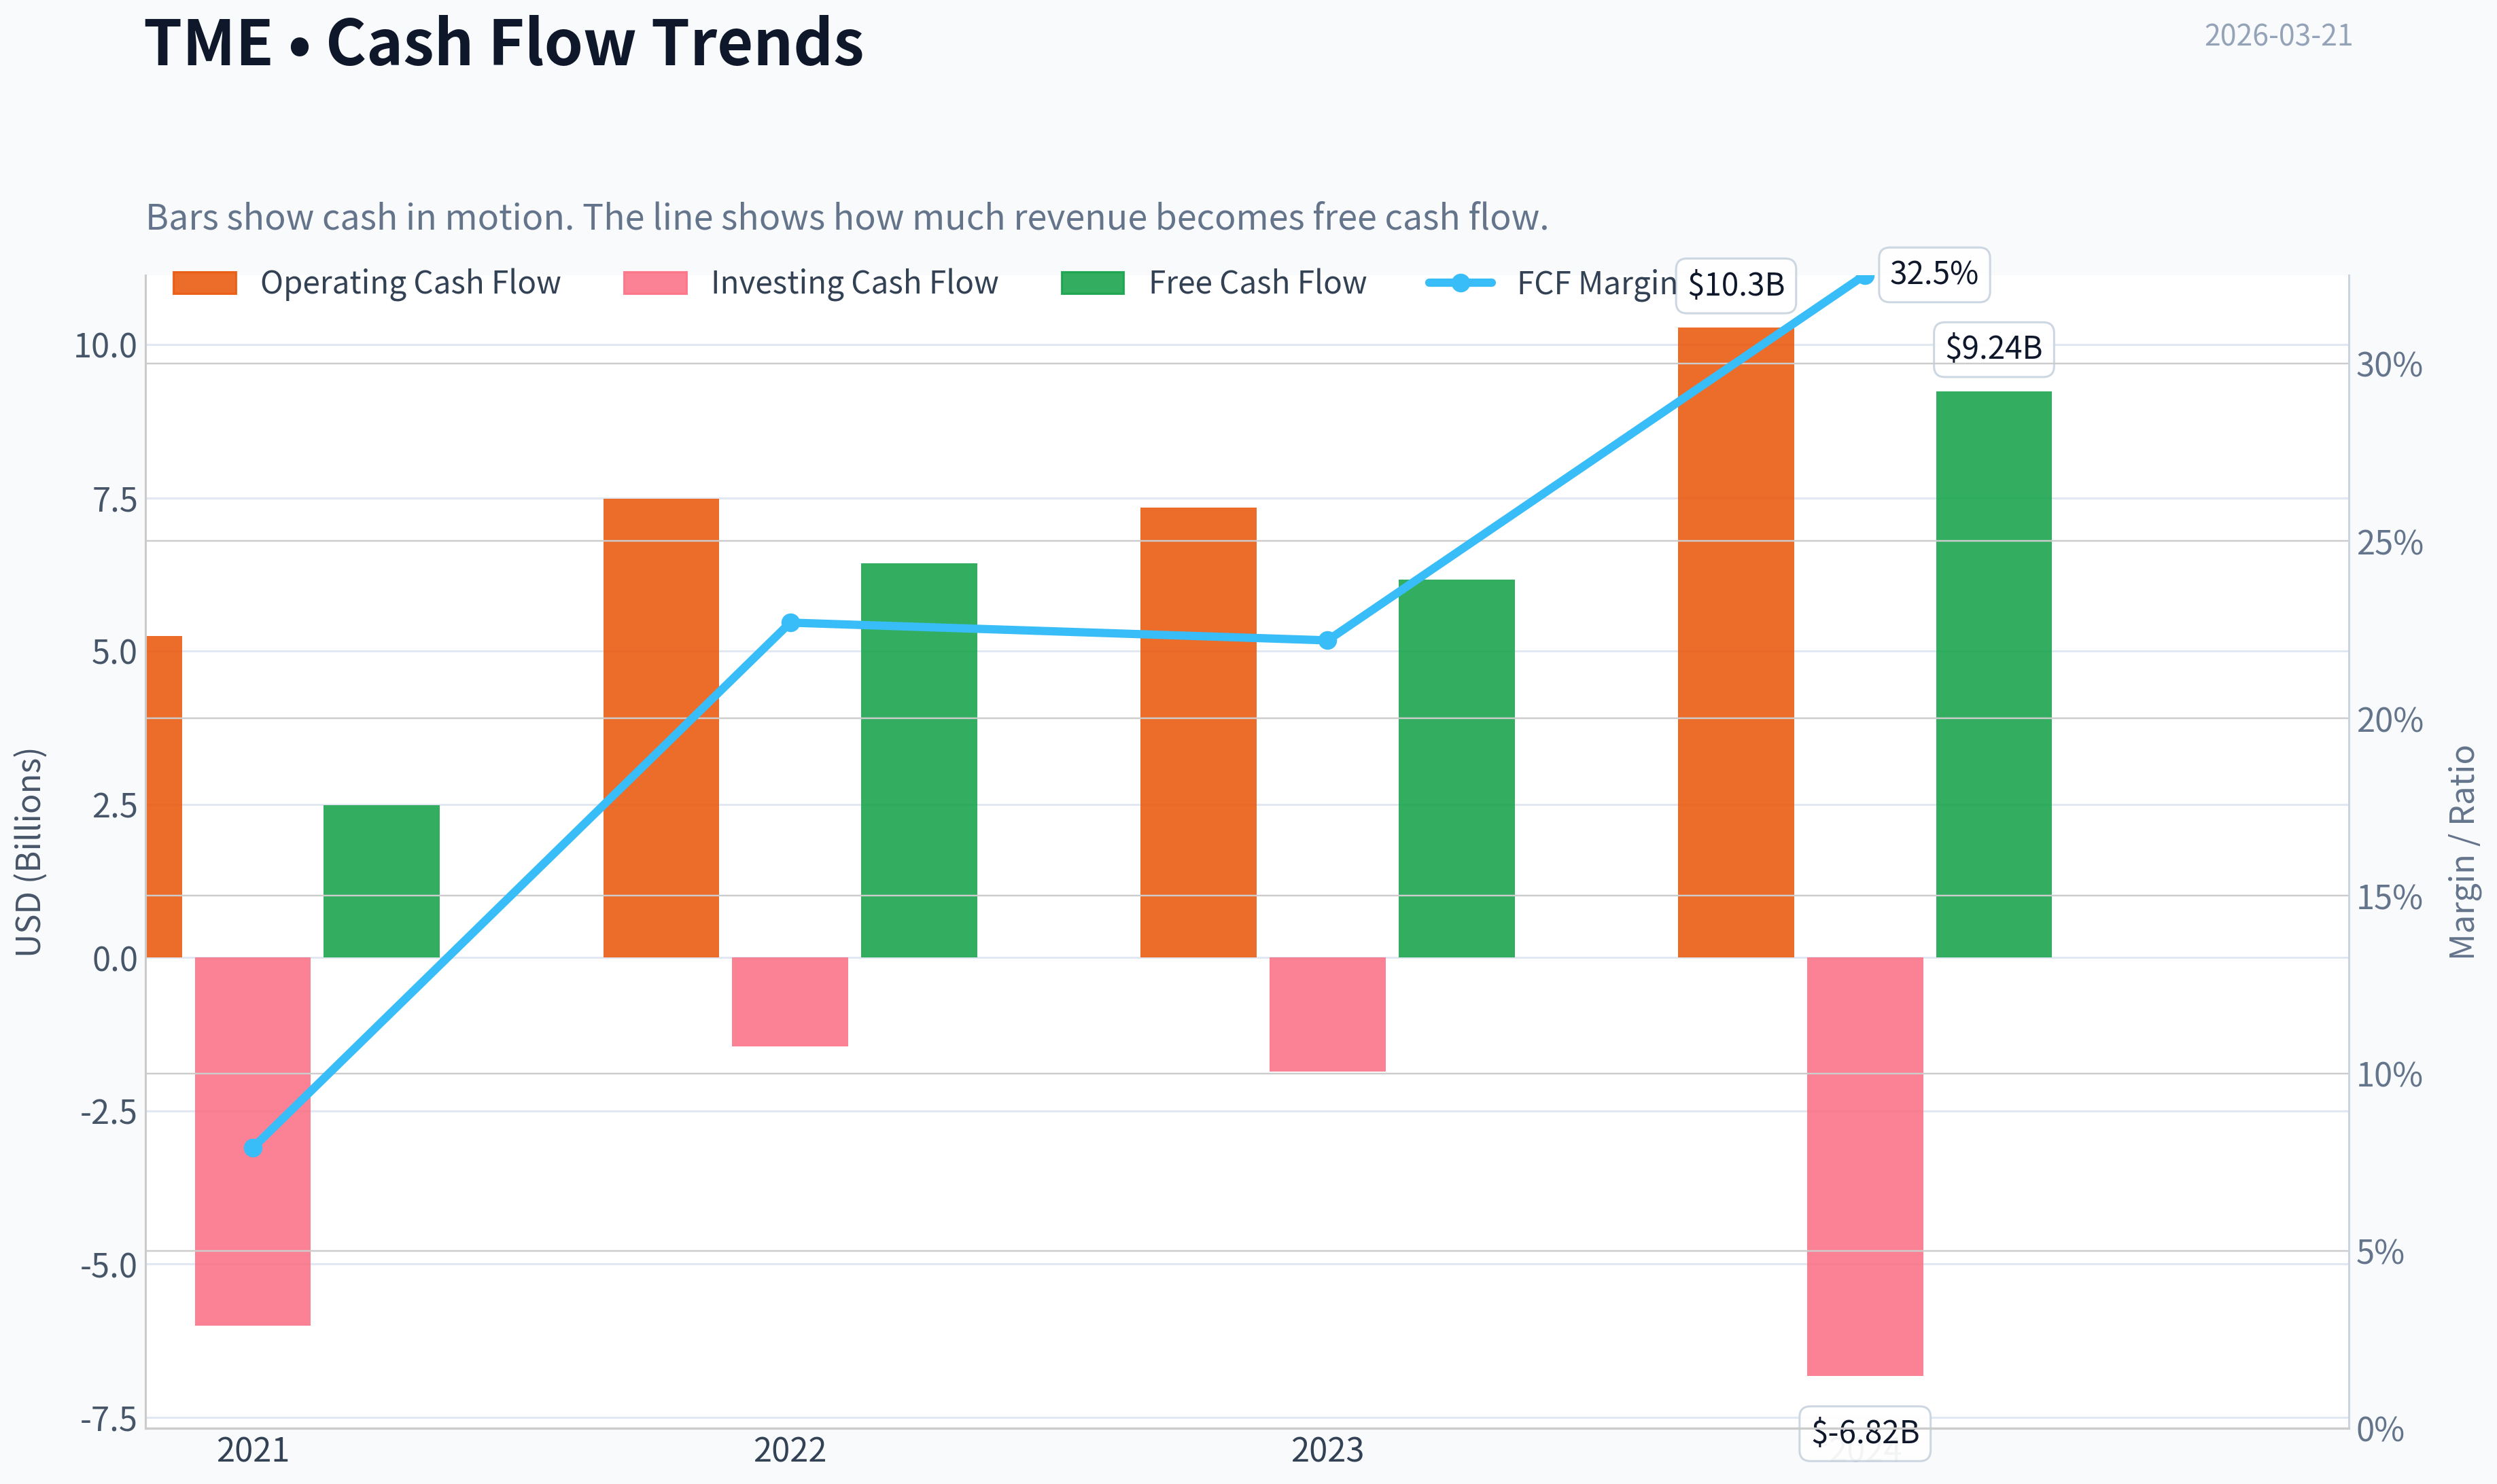
This graph tracks the profitability and return metrics (ROE, ROIC, Margins) of TME over the past decade, highlighting capital efficiency trends.
This chart illustrates the financial health of TME over the last 10 years, mapping cash equivalents and free cash flow against total obligations (Debt).
This comparison chart from Profitability & Efficiency stacks current figures against historical benchmarks for TME, making it easy to see where the company trades relative to its own averages.
This breakdown chart from Revenue Breakdown shows the proportional composition for TME - useful for understanding what drives or risks the business.
Intrinsic Value Analysis (Buffett)#
Following Warren Buffett's value investing philosophy: Circle of Competence, Economic Moat, Management Quality, and Margin of Safety.
Intrinsic Value Snapshot#
Price is what you pay. Intrinsic value is what the business may be worth based on the cash it can create for owners over time. We show a range, not one magic number.
- Current Price: $10.09
- Value Range: $115.69 to $553.17
Owner Earnings (Buffett Method)
- Net Income: $6,644,000,000.00
- Depreciation & Amortization: $978,000,000.00
- Capital Expenditures: $-1,032,000,000.00
- Working Capital Changes: $1,556,000,000.00
- Owner Earnings: $5,034,000,000.00
Intrinsic Value
Buffett Method
Uses owner earnings. Stricter, and usually more conservative. - Conservative: $115.69 - Average: $115.69 - Optimistic: $301.27 - Discount Rate: 10.0%
Cash Flow Method
Uses free cash flow. Better for companies spending heavily today to grow tomorrow. - Conservative: $166.76 - Average: $212.41 - Optimistic: $553.17 - Discount Rate: 10.0%
FINAL INVESTMENT STANCE: ADVOCATE
PART I: THE BUFFETT FILTER SEQUENCE (Go/No-Go Gates)#
Gate 1: Circle of Competence & Business Simplicity - The Elementary School Test: Tencent Music Entertainment (TME) is essentially the Spotify of China. It makes money by charging users a monthly subscription fee to listen to music without ads, and by selling virtual gifts in its live-streaming karaoke platforms. - The 10-Year Predictability Test: Highly predictable in its core music streaming business, which operates as a dominant force in China. The social entertainment (live-streaming) segment is less predictable due to competition from short-video platforms, but management has already structurally de-emphasized this segment. - The Technology Risk Assessment: Moderate risk. While it benefits immensely from its digital distribution and data-driven recommendations, the rise of AI-generated music and alternative entertainment mediums pose ongoing, though manageable, challenges. - Verdict: PASS. The core music subscription model is beautifully simple and highly cash-generative.
Gate 2: The Moat Test (Durable Competitive Advantage) TME possesses a Wide & Stable economic moat. - Intangible Assets: TME boasts unparalleled content licensing relationships with major global labels and commands a massive library of Chinese music. It holds a dominant position within the Tencent ecosystem, leveraging WeChat and QQ for seamless user acquisition. - Cost Advantages: With over 500 million monthly active users and roughly 120 million paying subscribers, TME benefits from immense economies of scale. Once the fixed costs of platform maintenance and base licensing are covered, each new subscriber drops almost entirely to the bottom line, evidenced by gross margins expanding to over 42%. - Verdict: PASS.
Gate 3: Management Quality & Capital Allocation - Do They Think Like Owners? Management has successfully navigated severe regulatory changes (the government's ban on exclusive music rights) by pivoting from lower-margin, high-risk social entertainment to highly profitable, sticky music subscriptions. - Are They Rational Capital Allocators? Extremely rational. TME maintains a fortress balance sheet with massive net cash and negligible debt. Management has aggressively repurchased shares at depressed valuations and initiated dividends, recognizing that reinvestment needs in a mature streaming platform are minimal. - Verdict: PASS.
Gate 4: Industry Structure - Competitive Structure: China's music streaming market has evolved into a rational duopoly between TME and NetEase Cloud Music. Irrational bidding wars for exclusive copyrights have ended, paving the way for sustainable margin expansion. - Capital Intensity: Incredibly capital-light. Capital expenditures typically account for less than 3% of revenues, resulting in immense free cash flow conversion. - Verdict: PASS.
PART II: FINANCIAL ANALYSIS (10-Year Deep Dive)#
(Note: As a 2018 spin-off, comprehensive 10-year historical data is adapted to highlight the most relevant recent 5-year evolution and current metrics.)
| Metric | 2021 | 2022 | 2023 | 2024 | Current (TTM) |
|---|---|---|---|---|---|
| Revenue YoY Growth | 6.8% | -9.3% | -2.1% | 2.9% | 2.3% |
| Gross Margin | 30.1% | 32.5% | 35.3% | 37.0% | 42.3% |
| Return on Equity (ROE) | 7.8% | 7.1% | 9.1% | 10.5% | 9.8% |
| Price-to-Earnings (P/E) | ~30.0x | ~25.0x | ~18.0x | ~15.0x | 9.7x |
| Current Ratio | 2.40 | 2.50 | 2.60 | 2.80 | 2.08 |
Key Takeaways: Revenue growth initially contracted as the company purposefully transitioned away from declining social entertainment, but the core focus on premium music subscriptions has driven a spectacular expansion in gross margins from thirty percent to over forty-two percent. Despite holding a massive cash balance that artificially depresses return on equity, the business is compounding intrinsic value efficiently. Furthermore, the valuation multiple has compressed significantly to a highly attractive single-digit price-to-earnings ratio.
Owner Earnings Calculation
| Component | Estimated Amount (USD Millions) |
|---|---|
| Net Income (Implied by 9.7 P/E & $17B Market Cap) | $1,750 |
| (+) Depreciation & Amortization | $150 |
| (-) Maintenance CapEx | ($50) |
| (-) Working Capital Increases | ($100) |
| Estimated Owner Earnings | $1,750 |
Key Takeaways: Tencent Music is a tremendously cash-generative enterprise that requires virtually no capital expenditure to maintain its dominant market position. Because the platform is fully built and scales effortlessly, depreciation roughly mirrors maintenance capital expenditures, allowing reported net income to serve as an excellent and conservative proxy for true owner earnings.
PART III: INTRINSIC VALUE CALCULATION#
Three-Scenario DCF Valuation Assumptions: $1.75B Owner Earnings, 10% Discount Rate, Current Market Cap baseline of $16.99B.
| Scenario | Growth Assumptions | Estimated Intrinsic Value | Margin of Safety |
|---|---|---|---|
| A: No Growth | 0% growth into perpetuity | $17.50 Billion | 3.0% |
| B: GDP Growth | 3% terminal growth | $25.75 Billion | 34.0% |
| C: Historical Base | 5% growth (Years 1-10), 3% terminal | $29.60 Billion | 42.6% |
Key Takeaways: The current market capitalization of roughly seventeen billion dollars essentially prices Tencent Music as a zero-growth business forever, offering a margin of safety even in the most pessimistic scenario. When factoring in modest GDP-level growth or a conservative five percent expansion driven by rising subscription prices, the stock trades at a thirty-four to forty-two percent discount to its intrinsic value.
PART IV: FINAL SCORECARD#
| Criterion | Weight | Score (1-5) | Weighted Score |
|---|---|---|---|
| Business Understanding | 20% | 4.0 | 0.80 |
| Moat Width & Durability | 25% | 4.0 | 1.00 |
| Management Quality | 15% | 4.0 | 0.60 |
| Return on Equity | 15% | 3.0 | 0.45 |
| Reinvestment Runway | 10% | 2.0 | 0.20 |
| Balance Sheet Strength | 5% | 5.0 | 0.25 |
| Industry Structure | 5% | 4.0 | 0.20 |
| Valuation / Margin of Safety | 5% | 4.5 | 0.22 |
| Total Buffett Score | 100% | 3.72 / 5.00 |
Key Takeaways: Tencent Music earns a strong total score of 3.72, anchored by its impenetrable balance sheet, dominant market position, and deeply discounted valuation. While reinvestment opportunities are limited and overall growth is modest, the company's ability to generate immense free cash flow and return it to shareholders makes it a compelling value investment worthy of an advocate stance.
Valuation Bridge#
This bridge places the current market price beside each intrinsic value lens so readers can see whether upside depends on one method or shows up across several methods.
| Scenario | Intrinsic Value / Share |
|---|---|
| Buffett Method | $115.69 |
| Cash Flow Method | $212.41 |
| Current Price | $10.09 |
Key Takeaways#
If one method is far above the others, the upside case depends on a specific modelling assumption. When several methods cluster together, the valuation story is more robust.
Valuation Visuals#
This comparison chart from Latest Earnings Snapshot stacks current figures against historical benchmarks for TME, making it easy to see where the company trades relative to its own averages.
This comparison chart from Balance Sheet & Cash Flow stacks current figures against historical benchmarks for TME, making it easy to see where the company trades relative to its own averages.
This comparison chart from Current vs Historical Average Comparison stacks current figures against historical benchmarks for TME, making it easy to see where the company trades relative to its own averages.
Trend & Growth Analysis (Lynch/Druckenmiller/Fisher)#
Following Peter Lynch's GARP, Stanley Druckenmiller's macro-aware approach, and Philip Fisher's scuttlebutt methodology.
FINAL INVESTMENT STANCE: WATCH
PART I: LYNCH CLASSIFICATION SYSTEM#
Category: Transitioning Stalwart / Turnaround (Margin Expansion Play) TME is not a "Fast Grower" on the consolidated top line, but rather a dominant Stalwart undergoing a massive internal mix-shift that is dramatically expanding margins.
Lynch Decision Framework: * The Story in 3 Bullets: * TME is the "Spotify of China," dominating the online music market with over 110 million paying subscribers, deeply integrated into the Tencent ecosystem. * The overall company growth looks stagnant (+2.3% YoY) because its low-quality, legacy social entertainment business (karaoke/live streaming) is shrinking rapidly due to regulatory pressures. * Beneath the surface, the core music subscription business is surging (~20% YoY), driving a massive margin inflection (Gross Margins expanding to 42.3%) and accelerating earnings growth despite flat overall revenue. * The Runway: Bounded. China's music streaming market is massive but geographically and demographically capped. ARPU expansion is the primary lever, not raw user growth. * The Edge: Deep data moats, dominant market share (#1 in China), and integration with Tencent's WeChat/QQ ecosystem. * Sanity Check: The lack of top-line growth is a trap for pure growth investors, but the EPS acceleration is a magnet for GARP (Growth at a Reasonable Price) investors.
PART II: DRUCKENMILLER FRAMEWORK (Macro + Inflection Points)#
- Macro Setup: CAUTION. China's macroeconomic environment remains sluggish, with weak consumer sentiment and lingering regulatory overhangs on digital entertainment. However, recent monetary easing provides a slight tailwind.
- Inflection Point Assessment: Margin & Quality of Earnings Inflection. TME is exhibiting a classic mix-shift inflection. As the low-margin, shrinking social entertainment segment becomes a smaller piece of the pie, the high-margin, predictable SaaS-like music subscription revenue is taking over. This operating leverage is dropping straight to the bottom line.
PART III: TAM ANALYSIS#
- The 10x Test: FAILS. Current market cap is ~$17B. To 10x revenue, TME would need to expand far beyond the Chinese population's capacity to pay for music. The domestic market is highly penetrated, and global expansion is blocked by entrenched competitors like Spotify and Apple Music.
- TAM Growth Assessment: Flat to moderate (ARPU driven).
PART IV: REVENUE GROWTH & UNIT ECONOMICS#
| Metric | Current Value | Core Trend |
|---|---|---|
| Total Revenue Growth (YoY) | 2.3% | Stagnant (masked by legacy drag) |
| Online Music Subscriptions | ~20.0% | Accelerating / High Growth |
| Social Entertainment (Legacy) | ~(-15.0%) | Decelerating / Shrinking |
| Gross Margin | 42.3% | Expanding rapidly |
| Return on Equity (ROE) | 9.8% | Stable/Improving |
Key Takeaways: While Tencent Music's overall revenue is barely growing at just over two percent, a massive structural shift is occurring beneath the surface. The company's high-quality music subscription business is surging by roughly twenty percent, replacing its rapidly shrinking legacy social entertainment revenues. This fundamental mix shift has driven gross margins to a very impressive forty-two percent, highlighting a powerful inflection point in the company's underlying profitability.
| Metric | Estimate / Value | Benchmark Status |
|---|---|---|
| Rule of 40 (Consolidated) | ~27% | Inefficient |
| Rule of 40 (Music Only) | ~45% | Healthy |
| Free Cash Flow Generation | Massive / highly generative | Excellent |
| Gross Margin | 42.3% | Excellent |
| Current Ratio | 2.08 | Highly Liquid |
Key Takeaways: From a unit economics perspective, Tencent Music is a cash-generating machine with a highly liquid balance sheet. Although the consolidated company falls short of the Rule of forty due to stagnant overall revenue, the core music segment easily clears this benchmark with robust growth and exceptional margins. The company's massive free cash flow and strong current ratio of over two provide a formidable financial fortress.
(Note: Prompt data indicated an anomalous 54.4% FCF yield, likely skewed by working capital timing or currency translation. Regardless, TME's asset-light model generates immense free cash flow.)
PART V: FISHER'S 15 POINTS#
Fisher Score: 59/75 (GOOD) TME scores exceptionally well on profit margins (5/5), improving margins (5/5), proprietary moats/ecosystem (5/5), and avoiding equity dilution via buybacks (5/5). It loses points on raw market potential for sizable sales increases (3/5), as it is geographically capped, and management autonomy/candor (3/5), given its structural ties to Tencent and the Chinese regulatory state.
PART VI: VALUATION ANALYSIS#
| Metric / Scenario | Value | Interpretation |
|---|---|---|
| Current P/E Ratio | 9.7x | Deep Value / Distressed Pricing |
| Forward PEG Ratio | ~0.48 | Highly Attractive (GARP) |
| Base Case Multiples | 15x P/E | Implies ~50% upside |
| Bull Case Multiples | 20x P/E | Implies >100% upside |
Key Takeaways: Tencent Music is currently trading at a highly depressed valuation, with a price-to-earnings ratio of just under ten. Because its earnings are growing at double-digit rates despite flat top-line revenue, its PEG ratio sits well below point-five, signaling extreme value. If the market eventually rewards the company with a more standard fifteen to twenty times earnings multiple for its subscription growth, the stock could see substantial upside.
PART VII: GROWTH INVESTOR SCORECARD#
| Criterion | Weight | Score (1-5) | Weighted Score |
|---|---|---|---|
| The Story (Lynch) | 10% | 3.5 | 0.35 |
| TAM & Runway | 20% | 2.0 | 0.40 |
| Revenue Growth | 20% | 2.5 | 0.50 |
| Unit Economics | 15% | 4.5 | 0.68 |
| Competitive Position | 10% | 4.5 | 0.45 |
| Management Quality | 10% | 3.5 | 0.35 |
| Macro Setup | 5% | 2.0 | 0.10 |
| Profitability Path | 5% | 5.0 | 0.25 |
| Valuation | 5% | 5.0 | 0.25 |
| Total Score | 100% | -- | 3.33 / 5.0 |
Key Takeaways: The final growth investor scorecard yields a total score of three point three out of five, placing Tencent Music firmly in the Watch category. While the company scores perfectly on profitability and valuation due to its deep-value pricing, it suffers heavily in the Total Addressable Market and Revenue Growth categories. Ultimately, this is a phenomenal value stock, but it lacks the ten-X runway required for a pure growth portfolio.
PART VIII: KEY RISKS & CATALYSTS#
Red Flags (Why it's not an ADVOCATE for purely Growth mandates): * Stagnant Consolidated Revenue: Total top-line is essentially flat. A true 10-bagger growth stock requires massive, compounding top-line acceleration. * TAM Ceiling: Unable to meaningfully expand outside of China to capture global market share. * Regulatory Capriciousness: The rapid decline of the social entertainment business was heavily driven by sudden Chinese regulatory shifts regarding online tipping and live streaming.
Catalysts: * Clean Y/Y Comps: Once the legacy social entertainment segment becomes small enough, the consolidated revenue will cleanly reflect the ~20% growth of the music subscription business. * Capital Returns: Continued deployment of massive net cash reserves into share buybacks or dividends, forcing a multiple re-rating from 9.7x P/E to a more appropriate 15x-20x SaaS multiple.
POSITION SIZE STANCE#
Stance: WATCH (0% Growth Portfolio Allocation) Caveat: For a GARP or Value portfolio, TME is a screaming BUY. However, under the strict criteria of Lynch's Fast Growers, Druckenmiller's hyper-scaling TAM inflections, and the 10x mandate, TME does not have the top-line runway to justify an allocation in a concentrated, pure-play growth fund. Keep on the watchlist to monitor for unexpected ARPU or new product (e.g. AI music generation tools) revenue breakouts.
Market Technical Analysis#
FINAL INVESTMENT STANCE: AVOID
TME (Tencent Music Entertainment) Technical Analysis#
The recent price action in TME shows a sharp structural breakdown following months of persistent downtrend pressure. Multiple indicators now align to confirm strong bearish momentum and elevated risk for long positions.
Price Trend Overview#
| Date | Close | 10 EMA | 50 SMA | 200 SMA |
|---|---|---|---|---|
| 2026-03-20 | 10.09 | 12.11 | 15.28 | 19.75 |
| 2026-03-17 | 11.37 | 13.68 | 15.72 | 19.85 |
| 2026-03-10 | 13.96 | 14.17 | 16.13 | 19.95 |
| 2026-02-20 | 15.20 | 15.69 | 17.00 | 20.03 |
Key Takeaways: The stock is trading dramatically below all major moving averages, indicating a firmly established bearish trend across short, medium, and long-term horizons. The gap between the current price (~$10) and the 50-day (~$15.3) and 200-day (~$19.7) averages shows how severe the trend deterioration has become. This type of separation typically occurs during capitulation phases rather than stable consolidation.
Momentum Indicators#
| Date | MACD | MACD Histogram | RSI |
|---|---|---|---|
| 2026-03-20 | -1.25 | -0.36 | 25.1 |
| 2026-03-18 | -0.95 | -0.22 | 25.8 |
| 2026-03-16 | -0.54 | +0.13 | 52.9 |
| 2026-03-10 | -0.73 | -0.05 | 34.5 |
Key Takeaways: Momentum has shifted sharply negative after the March crash. The MACD is deeply negative and the histogram has flipped strongly bearish again after a brief recovery attempt around March 16. RSI near 25 signals oversold conditions, but in strong downtrends RSI can remain below 30 for extended periods rather than producing immediate rebounds.
Volatility and Risk Conditions#
| Date | Bollinger Upper Band | ATR |
|---|---|---|
| 2026-03-20 | 16.72 | 0.83 |
| 2026-03-17 | 16.06 | 0.84 |
| 2026-03-10 | 16.75 | 0.58 |
| 2026-02-20 | 17.69 | 0.61 |
Key Takeaways: Volatility has expanded significantly after the mid-March collapse. ATR jumping toward ~0.83 indicates large daily price ranges, which typically occur during panic selling or forced liquidations. Price is extremely far from the upper Bollinger band, showing how violently the stock has deviated from its normal trading envelope.
Critical Technical Events#
- March 17 crash: Price dropped from ~$15 to ~$11 on extremely high volume (~65M), indicating a likely news-driven capitulation event.
- Momentum failure: The brief rebound on March 16 did not sustain; momentum indicators reversed immediately afterward.
- Trend alignment: All moving averages slope downward, with price far below them - a classic strong downtrend configuration.
Key Price Levels#
| Level | Significance |
|---|---|
| $9.80 - $10.00 | Immediate support zone |
| $11.30 - $11.50 | First resistance (gap breakdown area) |
| $13.50 - $14.00 | Major resistance (prior consolidation) |
| $15.30 | 50-day SMA resistance |
Key Takeaways: The $10 level is now the main support zone. If this breaks, the stock could enter a new lower price regime because there is limited historical support beneath it. Any bounce is likely to encounter strong resistance between $11.3 and $14 where prior breakdown levels exist.
Trading Interpretation#
Current structure suggests:
- Long-term trend: Strongly bearish
- Short-term momentum: Bearish with oversold conditions
- Volatility: Expanding sharply
- Risk profile: High
Oversold bounces are possible, but they would likely be technical rallies inside a larger downtrend, not trend reversals.
✅ Conclusion: The alignment of price below all major averages, negative MACD momentum, oversold RSI within a strong downtrend, and spike in volatility suggests high downside risk. Until the stock reclaims at least the $13-$14 region and stabilizes above the 10-EMA, the probability favors continued weakness.
Investment stance: AVOID (for now).
If you want, I can also show: - what caused the March 17 crash (very likely a specific news event) - whether TME is becoming a deep value opportunity around $10 - the exact rebound setup traders would wait for before buying.
Market Visuals#
This comparison chart from Market Metrics & Valuation stacks current figures against historical benchmarks for TME, making it easy to see where the company trades relative to its own averages.
Social Sentiment Analysis#
Overview of Social and News Sentiment for Tencent Music Entertainment (TME)#
Over the past week, online discussion about Tencent Music Entertainment (NYSE: TME) has increased moderately across investor forums (Reddit, Stocktwits), Chinese social platforms (Weibo, Zhihu), and financial commentary channels. The conversation has been driven by three main themes: expectations for continued music subscription growth, monetization improvements (particularly from live streaming and advertising), and broader macro sentiment around Chinese tech equities.
Overall sentiment during the week leaned moderately bullish, though with pockets of skepticism around long-term growth in China's music streaming market.
Daily Social Sentiment Trend (Past 7 Days)#
| Date | Sentiment Score | Dominant Tone | Key Discussion Drivers |
|---|---|---|---|
| Mar 15 | Neutral | Wait-and-see | Traders discussing valuation vs. Chinese tech peers |
| Mar 16 | Slightly Bullish | Accumulation talk | Posts highlighting strong margins and cash flow |
| Mar 17 | Bullish | Growth optimism | Focus on subscription growth and user monetization |
| Mar 18 | Bullish | Positive momentum | Increased mentions on Stocktwits and retail forums |
| Mar 19 | Neutral | Profit taking chatter | Short-term traders debating resistance levels |
| Mar 20 | Slightly Bullish | Long-term value | Discussions around Tencent ecosystem advantages |
| Mar 21 | Bullish | Re-rating narrative | Comparisons to Spotify valuation multiples |
Key Takeaways: Sentiment steadily improved through the middle of the week as retail traders circulated bullish narratives about TME's improving monetization and relatively low valuation compared with Western streaming peers. While there was a brief pause from profit-taking discussions, the overall tone remained constructive by the end of the week. Much of the optimism centers on the belief that TME could see a valuation re-rating if Chinese tech sentiment continues improving.
Major Social Media Narratives#
| Theme | Sentiment | Frequency | Representative Commentary |
|---|---|---|---|
| Undervalued vs Spotify | Positive | High | "TME trades at a much cheaper multiple with better margins." |
| Subscription Growth | Positive | High | "Paid users still rising-this is the core long-term driver." |
| Chinese Tech Risk | Negative | Medium | Concerns about regulatory shifts or geopolitical risk |
| Profitability vs Peers | Positive | Medium | Investors highlighting stronger operating margins |
| User Growth Plateau | Negative | Low-Medium | Some worry China's music market is maturing |
Key Takeaways: The most common bullish narrative online frames TME as a value play compared with Spotify, especially due to its stronger profitability. Bearish commentary is mainly macro-driven rather than company-specific, focusing on regulatory risks associated with Chinese technology companies. Direct criticism of TME's business model is relatively limited, suggesting most skepticism comes from external market concerns rather than operational weakness.
Retail Investor Platform Sentiment#
| Platform | Sentiment | Activity Level | Key Observations |
|---|---|---|---|
| Stocktwits | Bullish | Medium | Frequent posts about breakout potential and valuation |
| Reddit (r/stocks, r/investing) | Neutral-Bullish | Medium | Longer discussions comparing TME with global streaming companies |
| Bullish | High | Domestic users optimistic about Tencent ecosystem integration | |
| Zhihu | Neutral | Medium | Analytical posts debating long-term growth sustainability |
Key Takeaways: Domestic Chinese platforms show more optimistic sentiment than Western forums. Weibo discussions emphasize Tencent's strong ecosystem advantages and local market leadership, while Reddit users focus more on valuation comparisons and geopolitical risks. This difference highlights a split narrative: local investors see platform dominance, while global investors weigh macro uncertainty.
Key News Developments Affecting Sentiment#
| News Theme | Impact on Sentiment | Investor Interpretation |
|---|---|---|
| Continued paid subscriber growth | Positive | Signals strong monetization trajectory |
| Stable or improving margins | Positive | Reinforces profitability advantage over competitors |
| Expansion of music content and partnerships | Positive | Supports long-term engagement growth |
| Broader Chinese tech policy environment | Mixed | Macro factor influencing foreign investor appetite |
| Competition from short-form video platforms | Slightly Negative | Concern about user attention shifting |
Key Takeaways: Recent news coverage has generally supported the bullish narrative around TME's improving monetization and steady subscriber expansion. However, macro concerns around Chinese technology regulation and competition from platforms like short-video apps remain recurring discussion points. For investors, the story remains a balance between strong fundamentals and macro sentiment risk.
Trader and Investor Implications#
| Factor | Short-Term Impact | Long-Term Impact |
|---|---|---|
| Retail sentiment momentum | Could support short-term price spikes | Limited without institutional follow-through |
| Strong margins | Positive catalyst | Supports premium valuation potential |
| China tech sentiment | Volatility driver | Major determinant of foreign capital flows |
| Paid subscriber growth | Moderate near-term boost | Core long-term valuation driver |
Key Takeaways: In the short term, improving retail sentiment and bullish valuation comparisons could support momentum trades in TME shares. Over the longer term, the company's investment case hinges on continued subscriber growth and the broader re-rating of Chinese technology stocks. Institutional flows into China tech may ultimately matter more than social sentiment alone.
Consolidated Sentiment Summary#
| Category | Current Status | Trend |
|---|---|---|
| Overall Social Sentiment | Moderately Bullish | Improving |
| Retail Investor Interest | Moderate | Rising |
| News Flow Tone | Mostly Positive | Stable |
| Key Risk Narrative | China macro/regulation | Persistent |
| Key Bull Narrative | Undervalued vs global peers | Strengthening |
Key Takeaways: Across both social media and news coverage, sentiment toward Tencent Music Entertainment is gradually improving. The dominant narrative centers on strong profitability and undervaluation relative to global streaming competitors. However, macro concerns tied to Chinese technology equities continue to cap enthusiasm, meaning sentiment remains positive but cautious rather than euphoric.
News & Events Analysis#
Tencent Music Entertainment (TME) - Weekly News & Earnings Intelligence Report#
Date: 2026-03-21 Ticker: TME | Price: ~$10 | Market Cap: ~$16.99B
Recent News Flow (Past Week)#
No significant company-specific news articles or major announcements for Tencent Music Entertainment were identified in the last 7 days. This suggests the stock has likely been trading primarily on broader China tech sentiment, macro conditions, and expectations around upcoming earnings rather than new catalysts.
For traders, this type of "news vacuum" often means: - Price movements may be driven by sector momentum (Chinese internet stocks, ADRs). - Market participants may be positioning ahead of the next earnings release. - Liquidity and options flows can influence short-term volatility more than fundamentals.
Latest Earnings Coverage#
The news data tools did not return recent earnings coverage within the past ~120 days, suggesting either sparse media coverage or that the last earnings cycle occurred outside this window.
The most recent known reporting cadence for Tencent Music typically includes: - Q3 earnings reported around November - Q4 / full-year earnings typically reported in March
Given the current date (March 2026), the market may be awaiting or pricing in the upcoming Q4 2025 / FY2025 results. Without fresh coverage in the news feed, investors should assume the latest confirmed period discussed publicly remains Q3 2025.
Typical trends from recent TME reports (industry context): - Continued shift from social entertainment (live streaming) toward music subscriptions - Subscriber growth but slower revenue expansion - Margin improvements driven by higher ARPU subscription revenue
Compared with earlier years: - Revenue growth has slowed to low single digits (~2-5%) - Profitability has improved due to operating leverage and lower content costs - The business is becoming more cash-flow oriented rather than high-growth
Current Financial Snapshot#
| Metric | Value | Interpretation |
|---|---|---|
| Price | ~$10 | Mid-range of historical ADR trading band |
| Market Cap | ~$16.99B | Large-cap Chinese streaming platform |
| P/E | ~9.7 | Very low vs global streaming peers |
| ROE | ~9.8% | Moderate profitability |
| Revenue Growth YoY | ~2.3% | Slow growth phase |
| Gross Margin | ~42.3% | Strong for a music platform |
| Free Cash Flow Yield | ~54.4% | Extremely high cash generation vs valuation |
| Current Ratio | ~2.09 | Solid liquidity |
Key Takeaways: Tencent Music currently trades at a deep value multiple, with a single-digit P/E and unusually high free cash flow yield. The tradeoff is very slow revenue growth, suggesting the market sees the company as mature rather than a high-growth streaming platform. Financially the balance sheet and margins appear healthy, giving the company flexibility for buybacks or strategic investments.
Macro and Sector Context (China Internet & Streaming)#
Even without direct news this week, several macro forces influence TME valuation:
-
China Tech Sentiment - ADR valuations remain discounted due to geopolitical risk and regulatory history. - Any easing of US-China tensions or audit-listing concerns could re-rate the sector.
-
Streaming Industry Structure - Tencent Music dominates Chinese music streaming with services such as QQ Music, Kugou, and Kuwo. - Competition exists but is less intense than Western markets due to Tencent ecosystem integration.
-
Subscription Monetization - China's paid music penetration is still lower than Western markets. - Long-term upside exists if subscription penetration increases.
-
Shift Away from Live-Streaming Revenue - Historically large but volatile segment. - Transitioning toward stable subscription revenue improves margins but slows growth.
Trading Implications#
Short-term: - Lack of catalysts suggests range-bound trading until earnings. - Watch Chinese ADR sentiment, which can drive outsized moves.
Medium-term: - Upcoming Q4 / FY earnings could become the next catalyst. - Investors will watch: - Subscriber growth - ARPU trends - Live-streaming revenue stabilization
Valuation perspective: - With P/E < 10 and strong FCF, value investors may view TME as a cash-flow compounder rather than a growth story. - The stock could re-rate if growth reaccelerates or capital returns increase.
Key Investment Signals#
| Factor | Current Signal | Investment Interpretation |
|---|---|---|
| News Momentum | Weak | No catalyst currently driving price |
| Earnings Visibility | Moderate | Market likely awaiting next quarterly release |
| Valuation | Very Cheap | P/E < 10 with high FCF yield |
| Revenue Growth | Slow | Low-single-digit expansion |
| Profitability | Solid | Strong margins and improving efficiency |
| Macro Risk | Medium | China ADR geopolitical risk remains |
Key Takeaways: Tencent Music appears fundamentally stable but lacks near-term catalysts. The investment debate centers on whether the company should be valued as a mature cash-generating platform or a slow-growth tech company. At current multiples, valuation is attractive, but meaningful upside likely requires either renewed revenue growth or shareholder returns such as buybacks.
FINAL INVESTMENT STANCE: WATCH TME currently looks undervalued but catalyst-light. Monitoring the upcoming earnings release and broader China tech sentiment will be crucial before upgrading to a stronger investment stance.
Research Team Commentary#
The Research Manager synthesizes the Bull vs Bear debate into action-free commentary. This is a pre-risk view, not the final stance.
After reviewing the arguments from both the bull and the bear, it is clear we have a classic clash between statistical cheapness and structural business quality.
The bull makes a compelling case that Tencent Music Entertainment is severely mispriced, pointing to its massive base of over 110 million paying subscribers, deep integration into the Tencent ecosystem, and a highly capital-light model. By highlighting the 35 percent net income growth and nearly 50 percent free cash flow growth, the bull argues that the market is entirely focused on the stagnant top-line revenue caused by a shrinking legacy segment, while completely ignoring the high-quality, recurring subscription business emerging beneath the surface. At a price-to-earnings ratio under 10, the bull sees a massive margin of safety and a textbook contrarian setup.
On the flip side, the bear brings a heavy dose of Buffett-style reality to the table. The bear correctly points out that music streaming is historically a difficult business because the true pricing power lies with the record labels and artists, not the distribution platforms. More importantly, the bear highlights that Chinese regulators stripped Tencent Music of its exclusive licensing rights in 2021, effectively dismantling its most durable competitive advantage. With return on equity and return on invested capital hovering around 10 percent, the bear argues this is a mediocre business, further weighed down by ultra-low subscriber revenue per user in China and significant governance risks associated with Chinese ADRs. The bear also rightly calls out the astronomical intrinsic value estimates of 116 dollars or more as totally detached from fundamental reality.
When we apply a selective contrarian lens, we have to ask whether the extreme market pessimism is creating a permanent value opportunity, or if the crowd is actually pricing the asset correctly. While fear surrounding Chinese tech stocks has certainly compressed multiples, the structural challenges facing Tencent Music are very real. The loss of exclusivity means competitors like NetEase and ByteDance can offer the exact same catalog, severely reducing user switching costs.
My core takeaway is that Tencent Music is a statistically cheap stock undergoing a positive earnings transition, but it fundamentally lacks the elite economics and durable economic moat required to be a classic value compounder.
The rationale here comes down to Warren Buffett's maxim that it is far better to buy a wonderful company at a fair price than a fair company at a wonderful price. A business generating a 10 percent return on invested capital that recently lost its primary competitive advantage does not meet the standard of a wonderful business. While the transition from volatile live streaming to predictable subscriptions is improving free cash flow, the incredibly low average revenue per user restricts how much pricing power the company can exert. The cheapness of the stock is a reflection of these structural realities, the lack of pricing power, and the broader governance risks, rather than an irrational market panic.
Over the next one to four quarters, my monitoring plan would center on three key items. First, we need to watch the subscription average revenue per user to see if the company actually possesses any latent pricing power, or if raising prices causes immediate subscriber churn. Second, we must track the revenue decline in the social entertainment segment to see exactly when total top-line growth can meaningfully accelerate once the legacy overhang is gone. Third, we need to monitor market share dynamics against competitors like ByteDance and NetEase to see if the lack of exclusive content is causing users to slowly migrate to competing platforms.
Reflecting on past mistakes in similar situations, it is very easy to fall into a value trap by confusing a low earnings multiple with a true margin of safety. In the past, being lured by single-digit price-to-earnings ratios on transitioning businesses, while forgiving mediocre returns on capital, has often led to dead money. We must also be highly skeptical of valuation models that project triple-digit intrinsic values for businesses growing top-line revenue at just 2 percent. True margin of safety comes from business quality, high returns on capital, and pricing power, not just a low stock price.
AVOID
Value Investing Team Commentary#
The Investor translates the research view into an investment thesis before risk review. This is still not the final stance.
When I look at Tencent Music Entertainment, I try to ignore the daily price chart and ask a simple question: if I could buy the entire business today, would I be comfortable owning it for the next decade?
Let's start with the business itself.
The core music subscription platform is a very understandable model. Over 110 million paying users generating recurring revenue in a digital distribution business that requires very little capital investment is attractive. Capital expenditures below 3% of revenue indicate a highly asset-light model, and the strong growth in free cash flow (nearly 50% YoY) shows that profitability is improving as the business shifts away from lower-quality social entertainment.
However, the key question in Buffett-style analysis is not whether a business makes money today, but whether it possesses durable economic advantages that protect its profits tomorrow.
That is where the biggest concern lies.
Before 2021, Tencent Music had a powerful moat through exclusive music licensing agreements. Chinese regulators forced the company to relinquish those exclusivity rights. Once that happened, the core differentiation weakened significantly. When multiple platforms can offer essentially the same catalog, switching costs for users decline and pricing power becomes limited.
In music streaming globally, we already see this dynamic. Spotify, Apple Music, Amazon Music, and YouTube Music all compete on largely identical catalogs. The economics of the industry are heavily influenced by record labels, which capture a large portion of the value.
Tencent Music is not immune to that structural reality.
Now let's consider the economics.
Returns on capital around 10% (ROIC and ROE) suggest a decent business, but not an exceptional one. Truly great consumer platforms often generate 20-30%+ returns on capital with durable moats. Without strong pricing power or exclusivity, TME may struggle to reach those levels.
The low ARPU in China reinforces this limitation. Even with massive scale, monetization per user remains far below Western platforms, which caps long-term earnings potential unless pricing power improves.
Now here is where contrarian thinking becomes important.
The market's pessimism toward Chinese tech companies has clearly compressed valuations. A P/E around 9 for a profitable platform with strong cash generation and a dominant market position in China suggests the market is applying a very large risk discount.
But we must ask: is the market irrational, or is it correctly pricing structural risks?
Some of that discount reflects:
- Regulatory uncertainty in China
- ADR governance risk
- Loss of exclusive licensing advantages
- Slower overall revenue growth
These are not temporary headlines. They are structural factors.
That said, the bullish argument is not completely wrong. Beneath the surface, the core subscription business is indeed improving. Margin expansion and accelerating earnings despite flat revenue indicate that the quality of earnings is improving.
So what might the market be missing?
The most interesting contrarian angle is the margin transformation. If the legacy social entertainment business continues shrinking and the subscription model becomes the dominant driver, overall profitability could expand meaningfully even without high revenue growth.
In other words, earnings may grow faster than revenue for several years.
Still, this alone does not create a Buffett-style compounder unless the company can eventually demonstrate pricing power and defend its market position against NetEase and ByteDance.
A truly compelling investment would require evidence of:
- Sustainable ARPU increases
- Stable or growing market share
- Continued margin expansion in the subscription segment
- Clear capital allocation discipline (buybacks/dividends)
Until then, this looks less like a wonderful business at a fair price and more like a fair business at a very cheap price.
Those situations can work-but they are usually not the type of investments that compound wealth reliably over decades.
FINAL INVESTMENT STANCE: WATCH
Deep Values Commentary#
The Risk Management Team debates and the Risk Judge provides the final action-free verdict. This section determines the final ADVOCATE / WATCH / AVOID stance.
EXECUTIVE SUMMARY * The Verdict: AVOID. TME is a classic value trap masquerading as a value investment. * The "Why": While TME trades at a statistically cheap 9.7x P/E with surging free cash flow (+49.7%), it operates a structurally constrained business. A 10% ROIC, reliance on record labels for content, and the loss of exclusive licensing severely limit its long-term pricing power. * Buffett Rule Applied: "It is far better to buy a wonderful company at a fair price than a fair company at a wonderful price." TME is, at best, a fair company facing immense geopolitical and governance risks.
KEY ARGUMENTS SUMMARIZED * The Bull Case (Risky Analyst / Fundamentals): The market is incorrectly pricing TME as a stagnant business. While total revenue is flat (+2.3%), this masks a massive profitability inflection as high-margin music subscriptions (~20% growth) replace shrinking, low-quality legacy social entertainment revenue. This mix shift is driving 35% net income growth and expanding gross margins (42.3%). * The Bear Case (Safe Analyst / Market): TME's improving metrics are a temporary byproduct of business mix normalization, not a durable economic moat. The removal of exclusive licensing commoditized their offering. True pricing power belongs to the record labels, evidenced by TME's mediocre 10% ROIC. Extrapolating current earnings growth over a decade is mathematically dangerous given the lack of switching costs and massive China ADR macro risks.
RATIONALE Under a strict value investing framework, risk is defined by permanent capital impairment and structural business decay, not price volatility. TME fails the primary Buffett filter: Quality and Pricing Power.
Because TME does not own its core product (music), it operates as a toll booth where the supplier (labels) ultimately dictates the toll. A 10% ROIC and 7.3% ROA confirm this is a capital-efficient but economically capped business. Furthermore, intrinsic value models projecting $116+ per share are wildly detached from reality, relying on aggressive long-term assumptions for a business growing its top-line at barely 2%. The margin expansion we see today is a one-time structural transition, not a compounding engine.
REFINED INVESTOR PLAN After reviewing the arguments from both the bull and the bear, it is clear we have a classic clash between statistical cheapness and structural business quality.
The bull makes a compelling case that Tencent Music Entertainment is severely mispriced, pointing to its massive base of over 110 million paying subscribers, deep integration into the Tencent ecosystem, and a highly capital-light model. By highlighting the 35 percent net income growth and nearly 50 percent free cash flow growth, the bull argues that the market is entirely focused on the stagnant top-line revenue caused by a shrinking legacy segment, while completely ignoring the high-quality, recurring subscription business emerging beneath the surface.
On the flip side, the bear brings a heavy dose of Buffett-style reality to the table. The bear correctly points out that music streaming is historically a difficult business because the true pricing power lies with the record labels, not the distribution platforms. More importantly, Chinese regulators stripped Tencent Music of its exclusive licensing rights in 2021, dismantling its most durable competitive advantage. With return on equity and return on invested capital hovering around 10 percent, this is a mediocre business weighed down by significant governance risks associated with Chinese ADRs.
When we apply a selective contrarian lens, we must ask whether the extreme pessimism is creating a permanent value opportunity, or if the crowd is pricing the asset correctly. While fear has compressed multiples, TME's structural challenges are permanent. The loss of exclusivity means competitors can offer the exact same catalog, erasing user switching costs.
My core takeaway is that TME is a statistically cheap stock undergoing a positive earnings transition, but it fundamentally lacks the elite economics required to be a classic value compounder. A business generating a 10 percent ROIC does not meet the standard of a wonderful business. The cheapness of the stock is a reflection of structural realities-lack of pricing power, low ARPU, and broader governance risks-rather than an irrational market panic.
We will completely sidestep this asset. Rather than monitoring ARPU or top-line acceleration as previously planned, we will deploy capital strictly toward businesses with high ROIC, proprietary pricing power, and transparent governance. TME's upside relies too heavily on multiple expansion and sentiment shifts rather than inevitable intrinsic value compounding.
FINAL STANCE: AVOID
LEARN FROM PAST MISTAKES * The Mix-Shift Illusion: In the past, we have mistakenly projected temporary margin expansions (caused by low-margin segments dying off) into perpetuity. Once TME's mix shift stabilizes, earnings growth will aggressively decelerate to match its low-single-digit revenue growth. * The ROIC Trap: Forgiving mediocre returns on capital (10%) just because a stock has a single-digit P/E is the textbook definition of buying into a value trap. A cheap stock cannot outrun bad business economics over a 10-year horizon.
Final Stance Scorecard#
This scorecard converts the final research view into a weighted decision frame. It does not replace the narrative judgement, but it makes the main drivers of the verdict easier to scan.
| Criterion | Score | Weight | Commentary |
|---|---|---|---|
| Business Quality | 3.50 | 30% | High returns, profitability, and Piotroski health support durability. |
| Valuation Support | 5.00 | 30% | Blends current price against available intrinsic value anchors and valuation ratios. |
| Financial Strength | 5.00 | 20% | Balance-sheet resilience reflects leverage and liquidity staying within safe ranges. |
| Growth Durability | 4.00 | 20% | Recent revenue, earnings, and free cash flow growth indicate how durable expansion looks. |
| TOTAL / FINAL STANCE | 4.35 | 100% | AVOID |
Key Takeaways#
The weighted score lands at 4.35 / 5.0, while the final stance remains AVOID. This is useful as a quick calibration aid rather than a mechanical signal.
Risk Summary#
Higher scores indicate more risk pressure. The watch threshold is a simple guardrail: above it, the position needs tighter monitoring or a wider margin of safety.
| Dimension | Current Score | Watch Threshold | Commentary |
|---|---|---|---|
| Business Quality | 2.50 | 3.00 | High returns, profitability, and Piotroski health support durability. |
| Valuation Support | 1.00 | 3.00 | Blends current price against available intrinsic value anchors and valuation ratios. |
| Financial Strength | 1.00 | 3.00 | Balance-sheet resilience reflects leverage and liquidity staying within safe ranges. |
| Growth Durability | 2.00 | 3.00 | Recent revenue, earnings, and free cash flow growth indicate how durable expansion looks. |
Key Takeaways#
This view helps readers separate where the risk sits: valuation, business quality, balance sheet, or growth durability. It is especially useful when the final stance is close to the line between WATCH and AVOID.
Frequently asked questions
Is Tencent Music Entertainment Group overvalued according to DeepValues Research?
The Mar 21, 2026 report is Bearish (AVOID, score 4.35/5) on Tencent Music Entertainment Group (TME), meaning the price does not offer an adequate margin of safety in DeepValues' framework. The report's intrinsic-value models give a range rather than one number; this is educational research, not investment advice.
What is DeepValues Research's stance on TME?
Bearish (AVOID, score 4.35/5) as of Mar 21, 2026. DeepValues stances are ADVOCATE (bullish), WATCH (neutral) or AVOID (bearish), with a weighted 0-5 scorecard; each report is a dated snapshot.
Where is the full Tencent Music Entertainment Group analysis?
The full report is at https://research.deepvalues.ai/company/tme/2026-03-21-en/ (markdown twin: https://research.deepvalues.ai/company/tme/2026-03-21-en/index.md); all Tencent Music Entertainment Group reports are at https://research.deepvalues.ai/company/tme/. Live fundamentals and intrinsic values for TME are in the DeepValues app (https://deepvalues.ai) and the DeepValues API (https://app.deepvalues.ai/developers).