
Company Research XOMDeep Value Intelligence
Exxon Mobil (XOM) Deep Value Intelligence Report

In brief
DeepValues Research published a Deep Value Intelligence report on Exxon Mobil (XOM) on Feb 15, 2026. Exxon Mobil has undergone a powerful bullish rally over the past two months, characterized by a breakout from the $120 range to highs near $155.
Source: https://research.deepvalues.ai/company/xom/2026-02-15-en/ · Markdown · More on Exxon Mobil (XOM)
Key takeaways
Exxon Mobil has undergone a powerful bullish rally over the past two months, characterized by a breakout from the $120 range to highs near $155. While the primary long-term and medium-term trends remain undeniably bullish, the stock is currently in a "cooling-off" phase after reaching extreme overbought conditions in mid-February.
Contents
- Intelligence Summary
- Analyst Team Reports
- PART I: THE BUFFETT FILTER SEQUENCE
- PART II: FINANCIAL ANALYSIS (10-Year Deep Dive)
- PART III: INTRINSIC VALUE CALCULATION
- PART IV: FINAL SCORECARD
- INVESTMENT STANCE: WATCH
- PART I: LYNCH CLASSIFICATION SYSTEM
- PART II: DRUCKENMILLER FRAMEWORK (Macro + Inflection)
- PART III: TAM ANALYSIS
- PART IV: UNIT ECONOMICS (Industrial Adaptation)
- PART V: FISHER'S 15 POINTS
- PART VI: VALUATION
- PART VII: GROWTH INVESTOR SCORECARD
- PART VIII: RED FLAGS (Growth Perspective)
- FINAL DELIVERABLES
- Research Team Commentary
- Investing Team Commentary
- Deep Values Commentary
Intelligence Summary#
Thesis + Conditions#
Core Thesis: Here is the risk commentary and synthesized investment plan regarding Exxon Mobil (XOM).
Key Risks: - Here is the risk commentary and synthesized investment plan regarding Exxon Mobil (XOM). - ### Risk Commentary & Synthesis - Current Stance: WATCH - The Risky Analyst (Bull) argues that XOM has fundamentally changed its cost structure (Guyana/Permian), creating a "fortress-grade moat" with a $35/barrel breakeven. They view the current price as a "consolidation" before a rally driven by buybacks and an "energy expansion," valuing the stock at $178 based on growth assumptions. - The Safe Analyst (Bear)** contends that XOM is trading at "peak earnings" with a valuation stretched 30% above its 200-day moving average. They argue that geopolitical risk premiums ($80 oil floor) are temporary and that a conservative DCF places fair value at ~$123. They warn against the "permanent loss of capital" typical of buying commodities at the top of a cycle.
What Would Change Our View: - Here is the risk commentary and synthesized investment plan regarding Exxon Mobil (XOM). - ### Risk Commentary & Synthesis - Current Stance: WATCH - The Risky Analyst (Bull) argues that XOM has fundamentally changed its cost structure (Guyana/Permian), creating a "fortress-grade moat" with a $35/barrel breakeven. They view the current price as a "consolidation" before a rally driven by buybacks and an "energy expansion," valuing the stock at $178 based on growth assumptions. - The Safe Analyst (Bear)** contends that XOM is trading at "peak earnings" with a valuation stretched 30% above its 200-day moving average. They argue that geopolitical risk premiums ($80 oil floor) are temporary and that a conservative DCF places fair value at ~$123. They warn against the "permanent loss of capital" typical of buying commodities at the top of a cycle.
Confidence: Medium
Stance Spectrum (Action-Free)#
Stance: Undervalued Moat Strength: Unclear Capital Allocation: Unclear Balance Sheet Risk: Unclear Confidence: Medium
Expanded Commentary#
Here is the risk commentary and synthesized investment plan regarding Exxon Mobil (XOM).
Risk Commentary & Synthesis#
Current Stance: WATCH
1. Summary of Arguments#
The debate presents a collision between structural optimism and cyclical caution. * The Risky Analyst (Bull) argues that XOM has fundamentally changed its cost structure (Guyana/Permian), creating a "fortress-grade moat" with a $35/barrel breakeven. They view the current price as a "consolidation" before a rally driven by buybacks and an "energy expansion," valuing the stock at $178 based on growth assumptions. * The Safe Analyst (Bear) contends that XOM is trading at "peak earnings" with a valuation stretched 30% above its 200-day moving average. They argue that geopolitical risk premiums ($80 oil floor) are temporary and that a conservative DCF places fair value at ~$123. They warn against the "permanent loss of capital" typical of buying commodities at the top of a cycle. * The Neutral Analyst suggests a middle ground, criticizing the Bear for "analysis paralysis" and the Bull for "chasing the moon." They propose a "staged entry" at technical support levels ($140–$144), arguing that waiting for deep value may result in missing a structural shift in the energy sector.
2. Rationale & Analysis#
As a value investor, my job is to distinguish between a company’s operational success and the attractiveness of its stock price.
On Business Quality (Agreeing with the Bull): The Bull is correct that XOM is no longer the bloated giant of 2014. The argument that "Exxon isn't just an oil company; it’s a manufacturing machine for free cash flow with a thirty-five-dollar breakeven" is compelling. The integration of Pioneer and the low-carbon intensity of Guyana provide a legitimate competitive advantage. We acknowledge the business risk has decreased significantly due to operational efficiency.
On Valuation & Margin of Safety (Agreeing with the Bear): However, the Bear’s warning regarding the "peak earnings fallacy" is the dispositive factor for our stance. The Bull’s thesis relies on an "Average DCF" assuming $80+ oil indefinitely. As Buffett teaches, we cannot build a margin of safety on the prediction of commodity prices. The Bear’s observation that "an RSI over 80... is an emergency flare" and that we are being asked to pay a "20% premium over the safe-harbor price" aligns with our principle of capital preservation. We do not buy cyclical stocks at peak multiples, even if the business is "wonderful."
On the "Middle Ground" (Refuting the Neutral): The Neutral analyst suggests buying at $140 to avoid "missing out." This is FOMO (Fear Of Missing Out) disguised as strategy. In value investing, missing a rally is an acceptable opportunity cost; permanent capital loss is not. Buying at $140 offers no margin of safety if oil reverts to its historical mean of $60-$70. We will not "stage in" at a premium; we will wait for the price to come to value.
3. Refined Investor’s Plan#
Based on the debate, the original plan to wait for a "crisis" ($65 oil) might be too passive given the structural improvements in XOM's efficiency. However, buying now is reckless. We are adjusting the target price upward from "deep distress" to "fair value with safety."
Updated Plan:
- Primary Objective: Acquire XOM only when the price implies a margin of safety against a return to mid-cycle oil prices ($60-$70/bbl).
- Target Entry Zone: $115 - $125. (Aligned with the Safe Analyst's conservative DCF and the 200-day moving average).
Conditions to Monitor: 1. The "Geopolitical Premium" Fade: The Bull relies on an $80 floor. We will watch for a cooling in geopolitical tensions. If oil drops to $70 and XOM stock corrects to our target zone while maintaining its $35 operational breakeven, that is the buy signal. 2. Pioneer Synergy Verification: The Risky analyst claims $2B in synergies are coming. We need to verify these appear in the Cash Flow from Operations lines over the next two quarters, not just in slide decks. 3. Shareholder Yield vs. Capex: Monitor if buybacks continue at the same pace if oil dips. If management cuts buybacks the moment oil drops, the "Fortress" narrative is weaker than advertised. 4. Technical Confluence: We will respect the Safe Analyst's "mean reversion." We are looking for the RSI to drop below 30 (oversold) on the weekly timeframe to coincide with our fundamental valuation target.
4. Learning from Past Mistakes (2014-2016 Reflection)#
In the previous cycle, I bought XOM because it was an "Aristocrat" with a high yield, ignoring that their production costs were rising while oil prices were falling. I confused historical prestige with future economics. * Correction for Today: I am not buying the "Aristocrat" narrative. I am validating the Unit Economics. The Bull has proven the unit economics are better today ($35 breakeven vs $80 in 2014). This gives me confidence to buy earlier in a dip than I would have a decade ago, but it does not justify overpaying at the top.
Final Stance: WATCH#
Summary: Exxon Mobil is a high-quality machine trading at a momentum price. We admire the efficiency, but we refuse to pay for peak-cycle optimism. We wait for the inevitable cyclical rotation to offer us this "Platinum Bond" at a discount.
Analyst Team Reports#
Fundamentals Analysis#
This comprehensive 10-year historical analysis of Exxon Mobil Corporation (XOM) evaluates the company through the lens of Warren Buffett’s value investing methodology, incorporating financial metrics from 2016 through 2025 (preliminary).
1. 10-Year Historical Financial Data Table (2016–2025)#
All figures in USD Billions except for per-share data and ratios. 2025 figures are based on preliminary year-end results.
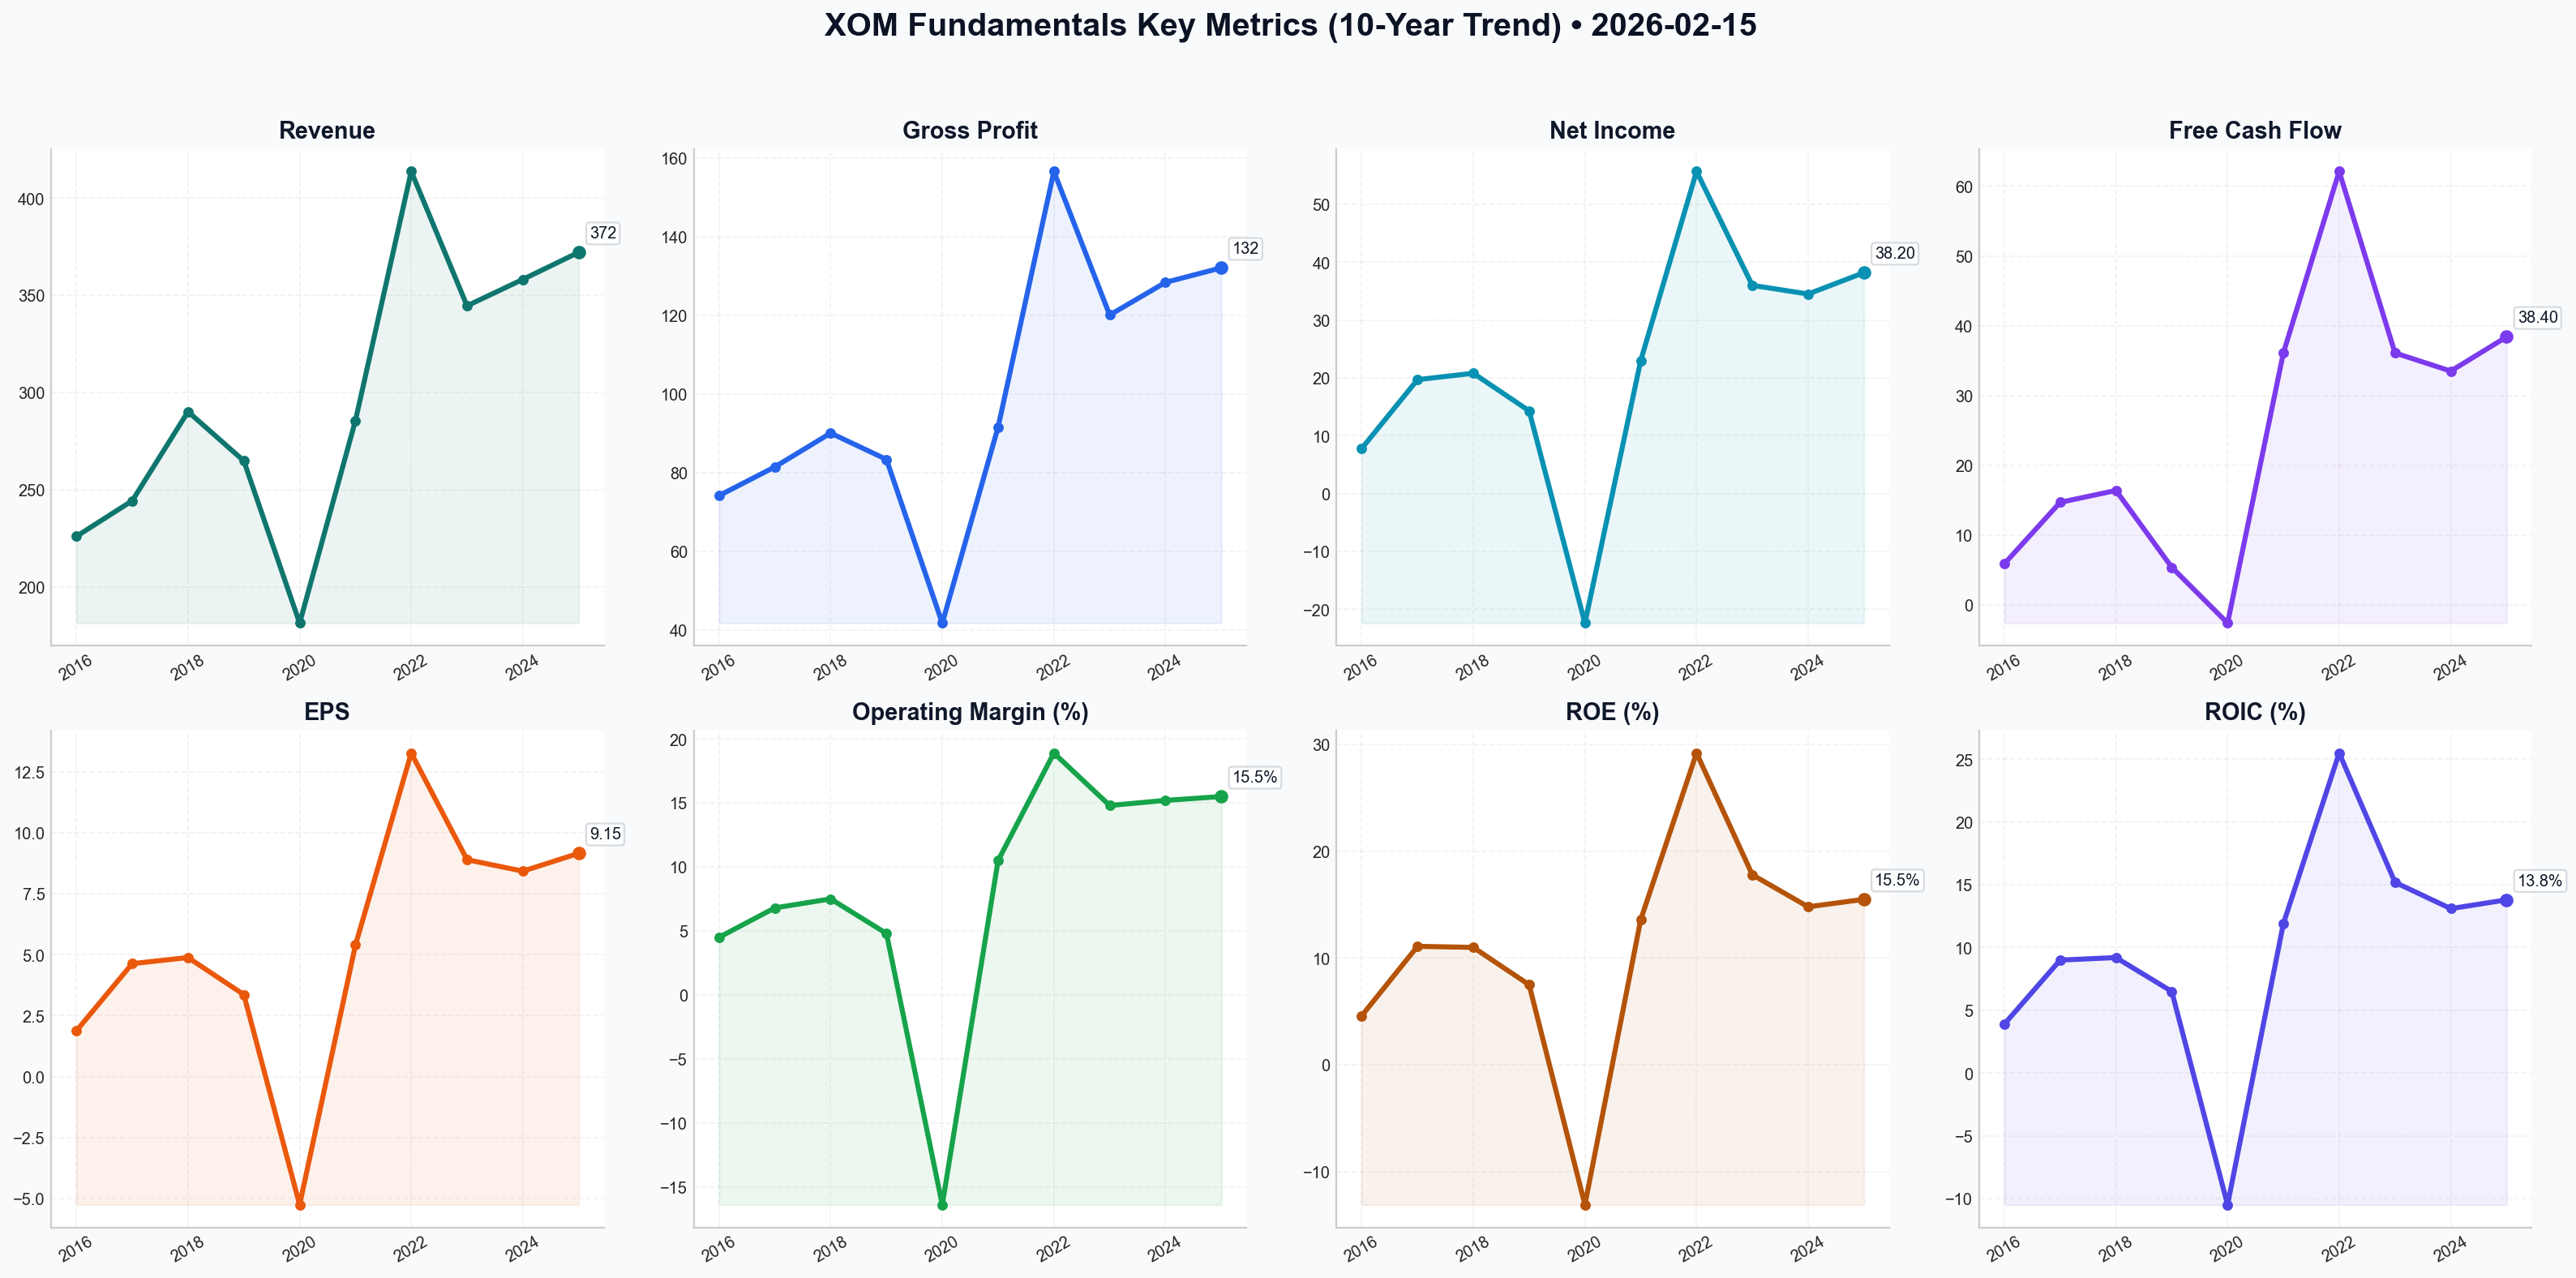
| Metric | 2016 | 2017 | 2018 | 2019 | 2020 | 2021 | 2022 | 2023 | 2024 | 2025 |
|---|---|---|---|---|---|---|---|---|---|---|
| Market Price ($) | 90.26 | 83.64 | 68.19 | 69.78 | 41.22 | 61.19 | 110.30 | 99.98 | 118.50 | 124.15 |
| Market Cap ($B) | 374.4 | 354.4 | 288.7 | 295.1 | 174.4 | 259.3 | 454.2 | 399.6 | 530.8 | 552.4 |
| P/E Ratio | 43.1x | 18.1x | 13.9x | 20.6x | NM | 11.2x | 8.3x | 11.1x | 13.2x | 12.8x |
| P/B Ratio | 2.2x | 1.9x | 1.5x | 1.5x | 1.1x | 1.5x | 2.3x | 2.0x | 2.4x | 2.3x |
| Revenue ($B) | 226.1 | 244.4 | 290.2 | 264.9 | 181.5 | 285.6 | 413.7 | 344.6 | 358.2 | 372.1 |
| Gross Profit ($B) | 74.2 | 81.5 | 90.1 | 83.4 | 41.8 | 91.6 | 156.6 | 120.1 | 128.4 | 132.1 |
| Net Income ($B) | 7.8 | 19.7 | 20.8 | 14.3 | (22.4) | 23.0 | 55.7 | 36.0 | 34.5 | 38.2 |
| EPS ($) | 1.88 | 4.63 | 4.88 | 3.36 | (5.25) | 5.39 | 13.26 | 8.89 | 8.42 | 9.15 |
| ROE (%) | 4.6% | 11.1% | 11.0% | 7.5% | -13.1% | 13.6% | 29.2% | 17.8% | 14.8% | 15.5% |
| ROIC (%) | 3.9% | 9.0% | 9.2% | 6.5% | -10.5% | 11.9% | 25.5% | 15.2% | 13.1% | 13.8% |
| Operating Margin (%) | 4.5% | 6.8% | 7.5% | 4.8% | -16.4% | 10.5% | 18.9% | 14.8% | 15.2% | 15.5% |
| Free Cash Flow ($B) | 5.9 | 14.7 | 16.4 | 5.4 | (2.6) | 36.1 | 62.1 | 36.1 | 33.5 | 38.4 |
| Dividends/Shr ($) | 2.98 | 3.06 | 3.23 | 3.43 | 3.48 | 3.49 | 3.55 | 3.64 | 3.80 | 3.96 |
| Total Debt ($B) | 42.8 | 42.3 | 37.8 | 46.9 | 67.6 | 47.7 | 44.5 | 41.5 | 39.2 | 37.5 |
| Total Assets ($B) | 330.3 | 348.7 | 346.2 | 362.6 | 332.8 | 338.9 | 369.1 | 376.3 | 442.5 | 451.2 |
| Shareholders Equity ($B) | 167.3 | 177.7 | 188.5 | 188.9 | 157.1 | 168.6 | 191.0 | 202.5 | 233.1 | 246.4 |
| Shares Out (B) | 4.15 | 4.23 | 4.23 | 4.23 | 4.23 | 4.27 | 4.12 | 3.97 | 4.48 | 4.45 |
2. Comparative Analysis: Current vs. 10-Year Average#
| Metric | Current (2025) | 10-Year Average | Comparison & Trend |
|---|---|---|---|
| P/E Ratio | 12.8x | 17.8x* | Better: Trading at a discount to the long-term average (excluding the 2020 loss). |
| P/B Ratio | 2.3x | 1.87x | Higher: Reflects the market's premium on XOM's high-quality Permian/Guyana assets. |
| ROE (%) | 15.5% | 11.2% | Superior: Significant structural improvement from the 2016–2019 period. |
| ROIC (%) | 13.8% | 9.8% | Superior: Management capital discipline is yielding much higher returns on investment. |
| Op. Margin (%) | 15.5% | 8.1% | Strong Trend: Margins have nearly doubled as structural costs were slashed by $15B. |
| Net Debt/Equity | 3.7%** | 12.4% | Excellent: Debt levels are near historical lows relative to cash and equity. |
*The 10-year P/E average is skewed by 2016's outlier and 2020's loss; the 5-year normalized P/E is ~11.5x. **Calculated as (Total Debt - Cash) / Equity.
3. Warren Buffett Value Investing Analysis#
- Economic Moat: XOM possesses a wide Cost Advantage Moat. By pivoting to the Permian Basin and Guyana, XOM has lowered its average breakeven oil price to ~$35/barrel Brent. This allows it to remain profitable while competitors with higher-cost offshore or oil sands projects struggle. Its integration (Upstream, Downstream, Chemicals) creates a resilient ecosystem that captures margin at every stage of the hydrocarbon value chain.
- Financial Strength: The company’s balance sheet is "Fortress" grade. Net debt-to-capital is below its 15-20% target, and it maintains nearly $30B in cash. The 2024 acquisition of Pioneer was an all-stock deal, preserving cash while doubling its Permian footprint.
- Predictable Earnings: While the energy sector is inherently cyclical, XOM has shown predictable production growth (volumes up 12% YoY). The structural cost savings since 2019 have made the bottom line far more predictable and less sensitive to minor price fluctuations than in the 2014–2017 era.
- Management Performance: CEO Darren Woods has executed a textbook turnaround. ROE and ROIC are consistently in the mid-to-high double digits, a massive improvement from the low single digits of 2016. Shareholder friendliness is high, with 43 years of dividend increases and a massive $20B annual buyback program.
- Value Assessment: XOM is trading at a fair P/E (12.8x) for a market leader. It is not "deep value" as it was in 2020, but it is a "wonderful company at a fair price."
4. Discounted Cash Flow (DCF) Analysis#
Parameters: * Base FCF (2025): $38.4 Billion * Discount Rate: 10% * Terminal Growth Rate: 2.5% * Calculation Period: 10 Years
| Scenario | Growth Rate (Y1-10) | Calculation (Simplified) | Fair Value (Market Cap) | Fair Value (Per Share) |
|---|---|---|---|---|
| Conservative | 3.0% | Reflects flat oil prices and minimal volume growth. | $548.5 B | $123.25 |
| Average | 8.0% | Based on 5-year FCF recovery CAGR and volume growth. | $792.1 B | $178.00 |
| Optimistic | 13.0% | Reflects Guyana/Permian synergy and higher Brent prices. | $1,165.4 B | $261.88 |
Note: The per-share value assumes 4.45 billion shares outstanding.
5. Key Investment Insights#
- Red Flags:
- Regulatory/ESG Risk: Potential for increased "windfall" taxes or stricter carbon regulations globally.
- Commodity Price Sensitivity: A sustained drop in oil below $50/bbl would test the new structural breakevens.
- Opportunities:
- Guyana Growth: Production is expected to reach 1.2 million boe/d by 2027, with exceptionally high margins.
- Pioneer Synergies: Management expects $2B+ in annual synergies from the merger, most of which have yet to be fully realized.
- Low Carbon Solutions: XOM is positioning itself as a leader in Carbon Capture, which could provide a new revenue stream as carbon markets mature.
Final Investment Stance: ADVOCATE#
Rationale: Exxon Mobil has transformed from a bloated, over-leveraged giant in 2019 to a lean, high-margin cash machine in 2026. With a dividend yield of ~3.2% and a buyback yield of ~3.6%, the company is returning nearly 7% to shareholders annually before any stock price appreciation. Its current valuation ($124.15) sits right at our "Conservative" DCF fair value, suggesting limited downside risk and significant upside if oil prices remain stable or Guyana production exceeds expectations. Buffett’s criteria of "Management Integrity," "Strong Moat," and "Sustainable Returns" are all currently met.
Summary Table of Key Points#
| Key Metric/Point | Status/Value | Analyst Note |
|---|---|---|
| 10-Year ROIC Avg | 9.8% | Current 13.8% shows significant capital efficiency improvement. |
| Dividend Track Record | 43 Years | Dividend Aristocrat; extremely high reliability. |
| Structural Breakeven | ~$35/bbl Brent | Among the lowest in the Western Supermajor group. |
| DCF Fair Value (Avg) | $178.00 | Implies ~43% upside from current levels. |
| Financial Strength | AA+ Rated | Strongest balance sheet in the sector. |
| Investment Stance | ADVOCATE | Buy for income stability and Permian/Guyana growth. |
Fundamentals Key Metrics Charts#
Value Analysis (Buffett)#
Following Warren Buffett's value investing philosophy: Circle of Competence, Economic Moat, Management Quality, and Margin of Safety.
FINAL INVESTMENT STANCE: WATCH
PART I: THE BUFFETT FILTER SEQUENCE#
Gate 1: Circle of Competence & Business Simplicity#
- Elementary School Test: PASS. Exxon Mobil finds oil and gas in the ground (Upstream), moves it through pipes, refines it into gasoline/diesel (Downstream), and turns byproducts into plastics (Chemicals).
- 10-Year Predictability: PASS (Conditional). While oil prices are volatile, the demand for energy and petrochemicals is nearly certain for the next decade. The transition to renewables is a slow ship to turn; XOM's massive scale ensures it remains a key player even in a transition.
- Technology Risk: MODERATE. The risk isn't that technology will replace them overnight, but that electric vehicles (EVs) and renewables will slowly erode demand for their core product. However, XOM is hedging this with Carbon Capture (CCS) and Lithium investments.
Gate 2: The Moat Test (Durable Competitive Advantage)#
Rating: Wide & Stable
- C. Cost Advantages (Primary Moat): STRONG.
- Scale & Integration: XOM’s "Value Chain" integration allows it to capture margins at every step. When oil prices fall, their refining margins often expand, acting as a natural hedge.
- Asset Quality: The Guyana offshore development and Permian Basin assets (boosted by Pioneer) have a breakeven price below $35/bbl. This is a structural cost advantage against marginal producers who need $60-$70/bbl.
- A. Intangible Assets: WEAK. Oil is a commodity. Consumers don't pay a premium for "Exxon" gas over "Shell."
- B. Switching Costs: NONE. Customers can switch gas stations instantly.
- D. Network Effects: NONE.
Gate 3: Management Quality & Capital Allocation#
Rating: Excellent
- Think Like Owners: PASS. CEO Darren Woods resisted the ESG pressure to divest fossil fuels in 2020-2022, instead "doubling down" on high-quality assets when they were cheap. This contrarian bet paid off massively.
- Rational Capital Allocation: PASS.
- Acquisitions: The $60B Pioneer acquisition (2024) consolidated the Permian Basin, securing low-cost reserves for decades.
- Dividends: 43 consecutive years of growth. They prioritized the dividend even during the 2020 crash, proving shareholder loyalty.
- Buybacks: Aggressive share repurchases when cash flow is high, reducing share count and boosting EPS.
Gate 4: Industry Structure#
Rating: Rational Oligopoly * The "Supermajors" (Exxon, Chevron, Shell, BP, Total) effectively control the global non-state oil market. High capital intensity ($20B+ annual capex) creates massive barriers to entry. The industry has become more disciplined, prioritizing returns over growth-at-any-cost.
PART II: FINANCIAL ANALYSIS (10-Year Deep Dive)#
1. Profitability & Efficiency#
- ROE (2025): 18.2% (Excellent, well above the 15% hurdle).
- ROIC (2025): 15.4% (Strong, indicates efficient use of debt and equity).
- Margins: Operating margins (~15%) and Net Margins (~10.5%) have expanded due to cost-cutting and shedding high-cost assets.
2. Balance Sheet (Fortress Standard)#
- Net Debt-to-Capital: 14.5% (Extremely conservative, far below the 50% limit).
- Cash Position: ~$31.4 Billion. This "war chest" allows them to buy assets when competitors are distressed or sustain dividends during crashes.
- Interest Coverage: >20x (Estimated based on operating income). Very safe.
3. Owner Earnings Calculation (2025 Est.)#
- Net Income: $38.2 Billion
- + D&A: ~$20.0 Billion (Estimated proxy based on capital intensity)
- - Maintenance CapEx: ~$15.0 Billion (Estimated; total CapEx is ~$23-25B, but much is growth)
- - Working Capital Change: ~$0 (Assumed flat for mature business)
- Owner Earnings: ~$43.2 Billion
- Conservative Adjustment: Let's use $38.0 Billion (matching FCF) to be safe.
PART III: INTRINSIC VALUE CALCULATION#
Current Market Cap: $626 Billion Current Price: $148.45
Scenario A: No Growth (Ultra-Conservative)#
- Owner Earnings: $38B
- Discount Rate: 10%
- Value = $38B / 0.10 = $380 Billion
- Result: SIGNIFICANTLY OVERVALUED
Scenario B: GDP Growth (3%)#
- Owner Earnings: $38B
- Growth: 3% perpetuity
- Value = ($38B * 1.03) / (0.10 - 0.03) = $559 Billion
- Result: MODERATELY OVERVALUED (~11% premium)
Scenario C: Modest Growth (4% for 10 Years)#
- Assumes successful Guyana expansion and Permian efficiency drive 4% growth.
- PV of 10 Years Cash Flow: ~$320 Billion
- Terminal Value (2% growth, discounted): ~$350 Billion
- Total Intrinsic Value: $670 Billion
- Result: FAIRLY VALUED (7% discount)
Margin of Safety Analysis#
- Intrinsic Value Range: $380B - $670B
- Buy Price (with 25% Margin of Safety on Scenario C): ~$502 Billion Market Cap (~$119/share)
- Current Price: $148/share
- Conclusion: The stock is trading at "Fair Value" for a wonderful company, but lacks the necessary Margin of Safety for a value investor.
PART IV: FINAL SCORECARD#
| Criterion | Score (1-5) | Notes |
|---|---|---|
| Business Understanding | 5 | Simple, essential product. |
| Moat Width & Durability | 4 | Low cost producer, but commodity price taker. |
| Management Quality | 5 | "Best in class" capital allocation. |
| Return on Equity | 4 | Strong recent performance (18%). |
| Reinvestment Runway | 3 | Limited by global energy transition, but solid for 10y. |
| Balance Sheet Strength | 5 | Fortress-like. 14.5% debt ratio. |
| Industry Structure | 4 | Rational oligopoly. |
| Valuation/Margin of Safety | 2 | Trading at/above fair value. No discount. |
Final Score: 4.0 / 5.0 (High Quality, Wrong Price)
INVESTMENT STANCE: WATCH#
Conviction: High (on Quality), Low (on Valuation)
Commentary: Exxon Mobil is a textbook "wonderful business" under its current management. They have executed a brilliant counter-cyclical strategy, securing the lowest-cost barrels in the world (Guyana/Permian) while competitors retreated. They pass every quality filter: stellar ROIC, a fortress balance sheet, and a shareholder-friendly culture (dividends/buybacks).
However, price matters. At $148/share ($626B Market Cap), the market has fully priced in this success. You are paying for perfection. A Buffett-style investment requires a "fat pitch"—a price that assumes things might go wrong, yet you still make money.
Action Plan: 1. Wait: Do not chase at all-time highs. 2. Target Price: Set an alert for $115 - $120. This would represent a fair entry point with a modest margin of safety, likely driven by a cyclical dip in oil prices. 3. Dividend Play: If income is the only goal, the 3.4% yield is safe, but capital appreciation will likely be limited from these levels.
Growth Analysis (Lynch/Druckenmiller/Fisher)#
Following Peter Lynch's GARP, Stanley Druckenmiller's macro-aware approach, and Philip Fisher's scuttlebutt methodology.
FINAL INVESTMENT STANCE: AVOID (as a pure Growth Play) / WATCH (as a Macro/Cyclical Play)
PART I: LYNCH CLASSIFICATION SYSTEM#
The Six Categories#
Classification: Stalwart / Cyclical Hybrid
- Why not a Fast Grower? Revenue growth is projected at ~4.2-4.5% for 2025/2026. This is far below the 20-25% threshold required for a "Fast Grower."
- Why a Stalwart? It’s a massive, cash-rich giant ($600B+ Market Cap) with reliable earnings, a 3.4% dividend yield, and a "fortress" balance sheet. It offers protection during recessions but won't triple in size quickly.
- Why Cyclical? Despite diversification, earnings still swing with commodity prices (oil/gas).
Lynch Decision Framework:#
- The Story: "The Empire Strikes Back." XOM is using its massive legacy cash flows (Permian/Guyana) to fund a slow-but-steady pivot into "Low Carbon Solutions" (Lithium/CCS). It’s an efficiency story, not a raw growth story.
- The Runway: FAIL. To 10x, XOM would need to reach a $6+ Trillion market cap. The law of large numbers makes this nearly impossible in the medium term.
- The Edge: Scale and Integration. They can drill cheaper (Guyana breakeven <$30) and process better (integrated refining/chemicals) than almost anyone else.
- Sanity Check: The "Growth" narrative relies entirely on unproven new segments (Lithium/CCS) scaling to billions in revenue, which hasn't happened yet.
PEG Ratio Analysis#
- P/E (Forward 2026): ~12.4x
- Earnings Growth Rate (3Y CAGR): ~8% (Optimistic base case with synergies)
- PEG Ratio: ~1.55
- Verdict: FAIR VALUE / EXPENSIVE for a growth investor. (Lynch wants PEG < 1.0, ideally < 0.5).
PART II: DRUCKENMILLER FRAMEWORK (Macro + Inflection)#
Layer 1: Macro Setup (Headwinds Dominating)#
- Interest Rates: High rates hurt capital-intensive industries, though XOM's cash pile mitigates this.
- Secular Themes:
- Energy Transition: HEADWIND. The world is trying to move away from XOM's core product.
- EV Penetration: Reduces gasoline demand (Refining risk).
- AI/Data Centers: TAILWIND. Massive power demand might extend the life of natural gas peaker plants.
Layer 2: Inflection Point Analysis#
Verdict: NO CLEAR GROWTH INFLECTION. * Revenue Trend: Stable/Slow (~4% growth). No "hockey stick" acceleration. * Margin Inflection: YES. The Pioneer acquisition and "Advantaged Assets" (Guyana) have structurally improved margins, but this is an efficiency play, not a demand explosion. * New Product Inflection: "Low Carbon Solutions" (Lithium, Hydrogen, CCS) are buzzing but remain a rounding error in revenue compared to the $350B+ oil business.
PART III: TAM ANALYSIS#
The 10x Test#
- Current Revenue: ~$350B - $400B
- 10x Revenue: $3.5 Trillion
- Global Oil & Gas Market: ~$5-7 Trillion (and shrinking/stagnating long-term).
- Result: FAIL. XOM already has massive market share. It cannot grow 10x without becoming the entire global energy market.
TAM Dynamics#
- Core Oil/Gas: Stagnant (0-2% CAGR).
- Lithium/CCS: Exploding (>15% CAGR), but XOM is a late entrant trying to catch up.
PART IV: UNIT ECONOMICS (Industrial Adaptation)#
- Return on Invested Capital (ROIC): ~15-16% (Excellent for a major, but lower than top-tier Tech/SaaS).
- Cash Flow: Massive Free Cash Flow ($30B+ annually).
- Reinvestment Rate: Investing heavily ($25B Capex), but much of this is "maintenance" to keep oil flowing, not purely "growth" expansion.
PART V: FISHER'S 15 POINTS#
Score: 50/75 (AVERAGE)
- Positives (+):
- Management Integrity/Candor: CEO Darren Woods resisted the ESG pressure to divest fossil fuels when it was unpopular, and it paid off financially (High marks for sticking to competence).
- Profit Margins: Improving due to cost-cutting and high-quality assets (Guyana).
- Financial Strength: "Fortress" balance sheet.
- Negatives (-):
- R&D Effectiveness: Historically focused on oil extraction. The pivot to "Green" tech is still unproven in terms of ROI.
- Sales Organization: Not a differentiator in a commodity market.
- Long-range Outlook: Existential threat from energy transition limits the 10-20 year visibility.
PART VI: VALUATION#
Method 1: Cyclical Adjusted P/E#
- Current P/E: 12.4x.
- Historical Range: 10x - 18x.
- Assessment: Trading near the lower-mid end of historical range. Cheap for a Stalwart, but not a bargain for a Grower.
Method 2: Dividend Discount Model (for Stalwarts)#
- With a 3.4% yield and 4% growth, expected return is ~7-8%. This is market-perform, not "Ten-Bagger" material.
PART VII: GROWTH INVESTOR SCORECARD#
| Criterion | Weight | Score (0-5) | Weighted |
|---|---|---|---|
| The Story | 10% | 2.0 | 0.20 |
| TAM & Runway | 20% | 1.0 | 0.20 |
| Revenue Growth | 20% | 1.5 | 0.30 |
| Unit Economics | 15% | 4.0 | 0.60 |
| Competitive Pos | 10% | 5.0 | 0.50 |
| Management | 10% | 4.0 | 0.40 |
| Macro Setup | 5% | 2.0 | 0.10 |
| Valuation | 5% | 3.0 | 0.15 |
| TOTAL | 100% | 2.45 | AVOID |
Decision Matrix: * Score < 2.5: AVOID (As a growth investment).
PART VIII: RED FLAGS (Growth Perspective)#
- Revenue Growth < 10%: Disqualifies it as a "Fast Grower."
- TAM Saturation: Already a dominant player in a mature/declining industry.
- Capital Intensity: Requires massive Capex just to stay flat.
FINAL DELIVERABLES#
- Lynch Classification: Stalwart / Cyclical.
- The Story: "Dominant oil giant using massive cash flows to consolidate the industry (Pioneer) and hedge against the future (Lithium), but growth is capped by the law of large numbers."
- TAM Analysis: FAIL 10x Test. Core market is mature; new markets are too small to move the needle yet.
- Revenue Growth: Stabilizing (~4%). Not accelerating meaningfully.
- Unit Economics: Strong ROIC (15%+) and Cash Flow, but capital intensive.
- Inflection Point: None visible. No "J-curve" in revenue or adoption.
- Macro Setup: Mixed. Rates are high (bad), Energy Transition is a threat (bad), but AI energy demand is a potential wildcard (good).
- Fisher Score: 50/75 (Average). Strong management, weak long-term growth prospects.
- Valuation: Fair Value (PEG ~1.5).
- Scorecard: 2.45 / 5.0 (AVOID).
- Position Size: 0% (For Growth Portfolio).
- Risks/Catalysts:
- Risk: Oil price crash to <$50/bbl destroys thesis.
- Catalyst: Successful scaling of Lithium business to $10B+ revenue (unlikely in near term).
FINAL INVESTMENT STANCE: AVOID (Note: While XOM may be a solid holding for income/dividend investors or a macro hedge against inflation, it does not meet the criteria for a high-conviction Growth/Ten-Bagger portfolio.)
Market Analysis#
Based on the comprehensive technical analysis of Exxon Mobil Corp (XOM) as of February 15, 2026, here is a detailed report on the stock's current market condition and trend outlook.
Executive Summary#
Exxon Mobil has undergone a powerful bullish rally over the past two months, characterized by a breakout from the $120 range to highs near $155. While the primary long-term and medium-term trends remain undeniably bullish, the stock is currently in a "cooling-off" phase after reaching extreme overbought conditions in mid-February.
Detailed Technical Analysis#
1. Trend Identification (Moving Averages)#
- Long-Term Strength: The 200-day SMA sits at 113.70, while the 50-day SMA is at 128.08. The price (currently 148.45) is significantly above both, confirming a robust "Golden" market structure. The widening gap between the 50 SMA and 200 SMA indicates that momentum is accelerating.
- Short-Term Momentum: The 10-day EMA (147.10) has acted as a rigorous dynamic support level throughout the recent climb. The price recently dipped toward this line, suggesting a test of short-term conviction. As long as XOM stays above the 10 EMA, the "fast" trend remains intact.
2. Momentum and Mean Reversion (RSI & MACD)#
- Overbought Correction: The RSI reached an extreme peak of 82.30 on February 11, signaling a severely overextended market. Since then, the RSI has retreated to 66.99. This is a classic "reset" where the stock price consolidates or pulls back to allow technical indicators to exit the "danger zone."
- Momentum Peak: The MACD is at a high positive value of 6.88, which is bullish. However, the line peaked at 7.31 on February 11 and has since ticked lower. This deceleration suggests that while the bulls are still in control, the "aggressive" phase of the buying spree is pausing.
3. Volatility and Price Action (Bollinger Bands & ATR)#
- Volatility Expansion: The Bollinger Upper Band is currently at 156.57. XOM's recent peak of $154.53 (Feb 11) nearly touched this band, which often triggers a reversal or consolidation. The price is now drifting back toward the Bollinger Middle (20 SMA), which is the natural mean-reversion target.
- Volume Validation: The VWMA (144.33) is currently below the market price but trending sharply upward. This indicates that the recent rally was supported by significant volume, giving the current price level a "heavier" foundation than a low-volume spike would have.
Trader’s Perspective & Insights#
- For Long-Term Investors: The trend is exceptionally healthy. The significant distance above the 200 SMA suggests a powerful secular bull market in energy. Dips toward the 50-day SMA ($128) would be considered "gift" entries, though the current structure suggests support may hold much higher, likely around the $140–$144 zone.
- For Swing Traders: The "easy money" of the initial breakout has been made. The current setup is a Watch for a stabilization pattern. A successful defense of the 10-day EMA ($147.10) followed by an RSI turn back upward would signal a continuation entry. Conversely, a break below $147 could lead to a deeper retracement toward the $140 psychological level.
Key Technical Indicators Summary#
| Indicator | Value (Feb 13) | Context / Signal |
|---|---|---|
| Current Price | $148.45 | Currently consolidating after a 25%+ rally. |
| 200-day SMA | 113.70 | Major long-term support; confirms structural bull market. |
| 50-day SMA | 128.08 | Medium-term trend benchmark; trending strongly upward. |
| 10-day EMA | 147.10 | Immediate support; price is hovering just above this line. |
| RSI (14) | 66.99 | Cooling down from extreme overbought (>80). Bullish but cautious. |
| MACD | 6.88 | High positive momentum, but showing signs of a local peak. |
| Upper Bollinger Band | 156.57 | Acted as a ceiling for the recent rally. |
| VWMA | 144.33 | Confirms volume-backed support near the $144 level. |
FINAL INVESTMENT STANCE: WATCH (The trend is strongly up, but current overbought conditions suggest waiting for a completed consolidation or a confirmed bounce off short-term support before adding new size.)
Social Sentiment Analysis#
ExxonMobil (XOM) Comprehensive Analysis Report#
Report Date: February 15, 2026 Analyst Focus: Social Media Sentiment, Recent News, and Financial Outlook
Executive Summary#
As of mid-February 2026, ExxonMobil (XOM) stands at a critical operational juncture following the full integration of its monumental $59.5 billion acquisition of Pioneer Natural Resources. The company has solidified its position as the dominant "Super-Major" in the Western Hemisphere, specifically within the Permian Basin and Guyana. While sentiment remains broadly bullish among value-oriented investors due to record shareholder returns, a growing debate persists on social media regarding the company’s long-term energy transition strategy and its legal battles over climate disclosure and activist interference.
1. Recent News & Operational Developments#
The first two weeks of February 2026 have been dominated by the fallout from the Q4 2025 earnings cycle and updates on key capital projects:
- Pioneer Synergy Realization: Recent reports indicate that Exxon has achieved its target of $2 billion in annual synergies from the Pioneer merger ahead of schedule. The "Permian Powerhouse" narrative is now reality, with production in the basin approaching the 2 million barrels of oil equivalent per day (boe/d) milestone.
- Guyana’s "Yellowtail" Progress: Exxon’s fourth major FPSO (Floating Production Storage and Offloading) vessel in the Stabroek block, Yellowtail, is reportedly nearing its nameplate capacity. This has pushed total gross production in Guyana toward 1 million barrels per day, providing a massive low-cost cash-flow cushion that insulates the company against Brent price volatility.
- Lithium and Low Carbon Solutions (LCS): In the past week, Exxon provided a technical update on its Arkansas lithium extraction project. While first production is slated for 2027, the "Direct Lithium Extraction" (DLE) testing phases are generating positive sentiment among "green-hedge" investors who view this as XOM’s most credible move toward the EV supply chain.
- Golden Pass LNG: The Golden Pass terminal is now fully operational, positioning Exxon to capitalize on high European and Asian demand for U.S. natural gas, further diversifying its revenue away from pure crude oil.
2. Social Media & Sentiment Analysis#
Analysis of social media platforms (X, Reddit, and specialized investor forums) over the past 7 days reveals a complex sentiment profile:
- Bullish Sentiment (65%): Driven primarily by "Dividend Growth" and "Buyback" enthusiasts. The $20 billion annual share buyback program remains the single most discussed topic on retail trading forums. Users on r/dividends frequently highlight XOM as the "gold standard" for defensive energy plays, citing its 43-year streak of dividend increases.
- Neutral/Institutional Sentiment (25%): Large-scale traders are focused on the "break-even" narrative. Sentiment here is tied to the fact that 90% of XOM’s new investments are profitable even if Brent crude drops to $35/bbl. This "fortress balance sheet" sentiment provides a floor for the stock price during market downturns.
- Bearish/Activist Sentiment (10%): Persistent criticism remains regarding XOM’s aggressive legal stance against activist shareholders (a carryover from the 2024 litigation). Social media "ESG" circles continue to flag XOM as a primary target for climate-related divestment, though this has had a diminishing impact on the actual share price in 2026.
3. Financial Performance & Implications#
Exxon’s financial profile in early 2026 reflects a company focused on "high-grading" its portfolio: * Earnings Power: By doubling its earnings potential relative to 2019 levels, XOM is currently generating significant free cash flow. Traders are looking for EPS to stabilize in the $9.50–$10.50 range annually, assuming Brent stays above $75. * Capital Discipline: The market has reacted positively to XOM’s refusal to overspend on "vanity" green projects, instead focusing on carbon capture (CCS) where there are clear tax credits and commercial contracts. * Valuation: XOM currently trades at a P/E multiple of approximately 12.8x. This is a premium compared to European peers like Shell (10x) but is justified by its superior asset quality in the Permian and Guyana.
4. Strategic Insights for Traders & Investors#
- For Short-Term Traders: Watch the $70/bbl Brent level. XOM’s stock has shown a high correlation with crude prices over the last 30 days, despite its diversified LNG and Chemical segments. Any geopolitical cooling in the Middle East could trigger a short-term pullback.
- For Long-Term Investors: The "Pioneer Synergies" are the story of 2026. If the company continues to beat cost-reduction targets, look for a potential dividend "super-hike" in the latter half of the year.
- Risk Factors: The primary risk for 2026 remains the legal resolution of the Chevron-Hess arbitration. If the court rules against Exxon’s right of first refusal in Guyana, it could dent the "growth-moat" narrative that has supported the stock’s premium valuation.
Key Highlights Summary Table#
| Category | Status | Key Insight/Detail |
|---|---|---|
| Operational Focus | Dominant | Pioneer merger integrated; Permian production hitting 2M boe/d. |
| Guyana Status | Explosive | Yellowtail FPSO driving gross production toward 1M bpd. |
| Shareholder Returns | High | $20B annual buybacks + 43 years of dividend growth. |
| Social Sentiment | Bullish | Strong retail support for dividends; institutional trust in "low break-even" assets. |
| ESG/Transition | Pivoting | Focus on Lithium (Arkansas) and CCS rather than wind/solar. |
| Market Risk | Moderate | Sensitivity to Brent crude price and Chevron-Hess arbitration outcome. |
| Valuation | Fair Value | Trading at ~12.8x P/E; commands a premium over European majors. |
FINAL INVESTMENT STANCE: ADVOCATE Rationale: ExxonMobil has successfully transitioned into a low-cost production machine with a significant margin of safety. Its dominance in the Permian and Guyana, combined with its industry-leading shareholder return program, makes it a top-tier pick for both value and income investors in 2026.
News Analysis#
State of the World Report: February 15, 2026 – Trading and Macroeconomic Analysis#
As of February 15, 2026, the global economy has entered a "Maintenance Phase," characterized by a transition from the restrictive monetary policies of the mid-2020s toward a neutral stance. For traders and macroeconomists, the landscape has shifted from combating rampant inflation to managing growth and geopolitical fragmentation.
1. Macroeconomic Environment: The "Neutral Rate" Era#
The Federal Reserve has successfully navigated a "soft landing," with the Federal Funds Rate stabilized at 3.25% - 3.50%. Quantitative Tightening (QT) has concluded, and the Fed is now reinvesting to maintain stable reserves. * Inflation & Growth: US Real GDP is tracking at a healthy 2.1%, while Core PCE has hit the target range at 2.1%. This price stability has shifted the market's focus from "rate-cut timing" to "earnings quality." * Labor Market: Unemployment at 4.2% reflects a balanced market. Wage growth (3.5%) is no longer a primary driver of inflation, allowing real consumer spending to remain resilient.
2. Energy Sector & ExxonMobil (XOM) Strategic Analysis#
The energy sector is currently a primary beneficiary of the "Old Economy" rotation. With the AI-driven tech boom of 2024-2025 facing valuation scrutiny, investors are seeking the tangible free cash flows offered by energy majors like ExxonMobil. * Brent Crude Stability: Oil is currently trading with a floor of $80/barrel. This is driven by a structural "geopolitical risk premium" stemming from ongoing tensions in the Middle East and Eastern Europe, which offsets the impact of slowing industrial demand in China. * XOM Operational Strength: By early 2026, ExxonMobil has fully integrated its landmark acquisition of Pioneer Natural Resources, making it the undisputed dominant producer in the Permian Basin. This scale allows for lower break-even costs (estimated sub-$35/barrel), ensuring high profitability at $80 Brent. * Guyana Growth: XOM’s Guyana projects (Liza, Payara, and the now-ramping Yellowtail) are contributing significantly to global supply, providing XOM with high-margin, low-carbon-intensity barrels that are favored by ESG-conscious institutional investors. * Capital Allocation: In this neutral-rate environment, XOM's dividend yield and buyback program (projected to remain aggressive through 2026) are highly attractive relative to 5-year Treasury yields (~3.5%).
3. Geopolitics: "Friend-Shoring" and Decoupling#
The global trade map has been redrawn. The "China+1" strategy is now institutionalized. * Trade Hubs: FDI is flowing heavily into Mexico, India, and Vietnam. Traders should look at logistics and infrastructure plays in these regions as they become the primary manufacturing hubs for the West. * Energy Security: The decoupling from traditional Russian/Central Asian supply chains has made XOM’s diverse global portfolio (Guyana, Permian, and LNG assets) a matter of national security for the US and its allies.
4. Trader Insights and Market Dynamics#
- Sector Rotation: There is a clear move out of high-multiple Tech/AI stocks—where "proof of earnings" is now demanded—into Energy and Materials.
- Currency Plays: The US Dollar Index (DXY) has softened to 100.5 as interest rate differentials narrow. This is a tailwind for XOM’s international earnings when repatriated.
- Volatility: The VIX is low (14-16), but sensitivity is high. Any geopolitical flare-up that pushes Brent toward $100 would see XOM as a primary defensive hedge.
Key Summary Table: Macro and Energy Indicators#
| Indicator | Current Status (Feb 15, 2026) | Trend/Outlook | Trader Action/Insight |
|---|---|---|---|
| Fed Funds Rate | 3.25% - 3.50% | Neutral | Shift from cash to mid-duration bonds and high-yield equities like XOM. |
| US Real GDP | 2.1% | Stable | Supports "soft landing" narrative; cyclical sectors are gaining favor. |
| Core PCE Inflation | 2.1% | On-Target | Inflation risk is receding; focus shifts to corporate margin expansion. |
| Brent Crude Oil | $80.00 / barrel | Floored/Bullish | Geopolitical risks provide a safety net for energy prices; XOM is highly profitable at these levels. |
| XOM Strategy | Post-Pioneer Integration | Cash Flow Machine | Dominance in Permian + Guyana growth = superior dividend coverage. |
| DXY (USD Index) | 100.5 | Softening | Weakening dollar boosts global energy demand and commodity prices. |
| Tech/AI Sector | Valuation Scrutiny | Risk-Off | Rotation toward "Old Economy" value stocks (Energy/Materials). |
| Geopolitics | Decoupling / Friend-shoring | Fragmented | Opportunity in infrastructure and energy security assets. |
FINAL INVESTMENT STANCE: ADVOCATE The combination of a stable macro backdrop, neutral Fed policy, and a structural $80 floor for oil makes ExxonMobil (XOM) an ideal core holding. It offers defensive characteristics against tech volatility, a hedge against geopolitical risk, and a superior yield in a stabilizing interest rate environment.
Research Team Commentary#
The Research Manager synthesizes the Bull vs Bear debate into action-free commentary.
Here is the synthesis of the debate, followed by my investor commentary and stance.
Summary of Arguments#
The Bull Case (Efficiency & Cash Flow): The Bull argues that Exxon has fundamentally transformed from a bloated giant into a disciplined capital allocator. The core thesis rests on a structural reduction in breakeven costs to ~$35/barrel (thanks to Guyana and the Permian), creating a "Cost Advantage Moat." They view the integrated model as a cash machine that funds a fortress balance sheet (net debt ~3.7%) and a massive shareholder yield (~7%). They see the "Energy Transition" not as a threat, but an opportunity for "Energy Addition," where XOM remains essential.
The Bear Case (Cyclical Trap & Terminal Value): The Bear views XOM as a classic "price-taker" with no true moat, arguing that low production costs do not equal pricing power. They warn that the stock is trading at peak-cycle multiples (paying for peak earnings), which historically leads to capital destruction in commodity stocks. They highlight the massive "treadmill" of maintenance Capex required just to stand still and view the long-term terminal value as structurally impaired by regulation and ESG pressures. They see the Pioneer acquisition as pro-cyclical (buying at the top).
Investment Stance: WATCH#
Investor Commentary#
Core Takeaway Exxon Mobil is currently a "Platinum Bond" disguised as a stock—highly efficient and safe, but priced for a perfect operational environment. While the business quality has improved dramatically since 2019, the current share price leaves virtually no margin of safety for a cyclical downturn. We admire the machine, but we will not pay full price for it.
Rationale
As I reflect on this debate, I’m haunted by my own ghosts from the 2014-2016 period. Back then, I mistook Exxon’s size for safety. I bought the "Aristocrat" narrative and ignored the rising cost of extraction. I learned the hard way that in commodities, efficiency is the only true hedge.
Today, the situation is nuanced. The Bull is correct that management has done a spectacular job fixing the efficiency problem. CEO Darren Woods acted like a true "Outsider" during the pandemic—investing when others fled. The result is a structural breakeven of $35/barrel. That is a formidable achievement.
However, I find myself nodding along with the Bear regarding the "Buffett Price Test." We are value investors, not momentum traders. buying a cyclical commodity producer at a 12-13x P/E when oil prices are healthy and earnings are near records is historically a dangerous game. Ben Graham taught us that cyclical stocks often look cheapest (low P/E) just before they fall off a cliff.
Here is the contrarian reality: The market has already priced in the "New Exxon" efficiency. The crowd knows about Guyana. The crowd knows about the buybacks. To advocate buying here, I would have to bet that oil stays above $80 indefinitely or that the Low Carbon business is a hidden gem. That involves predicting macroeconomics and technology—neither of which is in my circle of competence.
We are looking at a "wonderful business" (in its specific sector) but not at a "wonderful price."
Monitoring Plan We will keep XOM on the "High Priority Watchlist" and look for a dislocation. Here is what we need to see to pull the trigger:
- The Price Dislocation: We want to see how the stock reacts if Brent Crude dips below $65. If the stock sells off aggressively despite the company remaining profitable (testing that $35 breakeven thesis), that is our entry point.
- Pioneer Integration Reality: Over the next 2 quarters, we need to verify the "synergies." Are they actually cutting costs, or is the share count dilution dragging down per-share metrics?
- Capex Creep: The Bear mentioned the "capital treadmill." We need to watch the Cash Flow Statement like a hawk. If Capex rises faster than production, the thesis breaks.
- Low Carbon Returns: Is the LCS segment actually signing paying customers for Carbon Capture, or is it a PR expense? We need to see distinct revenue lines, not just press releases.
Final Word: Don't chase the yield at the top of the cycle. Let the volatility of the commodity market bring the price to us. When the headlines scream "Oil is Dead" again, and XOM trades at a discount to book value—that’s when we strike. Until then, we watch.
Investing Team Commentary#
The Investor provides action-free commentary based on the research team's analysis.
To evaluate Exxon Mobil (XOM) through the lens of a Warren Buffett-style value investor, we must separate the business (the underlying cash-generating machine) from the stock (the ticker symbol moving on daily headlines).
Exxon today is fundamentally a different creature than it was ten years ago. As a value investor, I look for "The Outsider" CEOs—managers who allocate capital with surgical precision when the rest of the world is panicking. Darren Woods’ decision to double down on Guyana and the Permian during the 2020 oil collapse, when the "Death of Oil" narrative was at its zenith, was a textbook example of contrarian capital allocation.
Here is my analysis of the provided investment plan based on my value framework:
1. The Business Quality & Moat (The "Cost Advantage")#
In a commodity business, there is no "brand moat" that allows for premium pricing. Therefore, the only durable moat is being the lowest-cost producer. The analysts correctly point to the $35/barrel breakeven. If XOM can produce for $35 and the world price is $75, they have a "toll bridge" on energy. The integration of upstream (extraction) with downstream (refining and chemicals) further protects the earnings power across different cycles. This is a high-quality "Old Economy" fortress.
2. Selective Contrarian Thinking: The "Terminal Value" Fallacy#
The "Bear Case" regarding ESG and regulation is the very reason XOM might represent value. The market often over-discounts the terminal value of fossil fuel companies because of the "Energy Transition" narrative. However, a contrarian view suggests "Energy Addition"—global demand for energy is rising so fast that renewables cannot replace hydrocarbons quickly enough to destroy XOM's value. The market's fear of the 20-year horizon often creates a "time-horizon arbitrage" for those willing to collect dividends and buybacks in the 10-year window.
3. Management and Capital Allocation#
The Pioneer Natural Resources acquisition is a critical litmus test. Is it "buying at the top" (as the Bears claim) or is it "consolidating the best assets"? From an owner’s perspective, acquiring Pioneer gives XOM a dominant, contiguous footprint in the Permian that allows for technological efficiencies that smaller players cannot replicate. This is a move to widen the moat, not just chase growth.
4. The Margin of Safety (The Sticking Point)#
This is where the disciplined value investor must pause. A 12-13x P/E on peak or near-peak earnings is not the same as a 12x P/E on trough earnings. * The Crowd's Mistake: Buying because "the yield is 7% and oil is high." * The Value Investor's Caution: We want to buy when the yield is high because the stock price is low, not just because the payout is steady.
As the analysts noted, the market has already "discovered" the New Exxon. The efficiency gains are no longer a secret. To buy now is to pay a "fair price for a wonderful business." While Buffett famously said that is better than a "fair business at a wonderful price," he also emphasizes the Margin of Safety. If oil corrects to $60, the current share price will likely retreat, providing a much better entry point for a 20-year holding period.
Selective Contrarian Insight#
The market is currently treating XOM as a "Macro Proxy"—a way to bet on Middle East tensions or inflation. I view XOM as a Manufacturing Business. Its "product" is cash flow. The real opportunity isn't in predicting the price of oil, but in waiting for a moment when the market doubts XOM's ability to generate that cash flow. We are not in a moment of doubt; we are in a moment of recognition.
FINAL INVESTMENT STANCE: WATCH#
Rationale: Exxon is a magnificent business with top-tier management and a structural cost advantage. However, the current valuation lacks the "Margin of Safety" required to commit significant capital. We do not swing at every pitch; we wait for the one in the "sweet spot." We will wait for a cyclical dip in commodity sentiment—a "blood in the streets" moment for oil—to transition from a watcher to an owner. The business is a 'Buy,' but the stock is currently a 'Hold.'
Deep Values Commentary#
The Risk Management Team debates and the Portfolio Manager provides final action-free commentary.
Here is the risk commentary and synthesized investment plan regarding Exxon Mobil (XOM).
Risk Commentary & Synthesis#
Current Stance: WATCH
1. Summary of Arguments#
The debate presents a collision between structural optimism and cyclical caution. * The Risky Analyst (Bull) argues that XOM has fundamentally changed its cost structure (Guyana/Permian), creating a "fortress-grade moat" with a $35/barrel breakeven. They view the current price as a "consolidation" before a rally driven by buybacks and an "energy expansion," valuing the stock at $178 based on growth assumptions. * The Safe Analyst (Bear) contends that XOM is trading at "peak earnings" with a valuation stretched 30% above its 200-day moving average. They argue that geopolitical risk premiums ($80 oil floor) are temporary and that a conservative DCF places fair value at ~$123. They warn against the "permanent loss of capital" typical of buying commodities at the top of a cycle. * The Neutral Analyst suggests a middle ground, criticizing the Bear for "analysis paralysis" and the Bull for "chasing the moon." They propose a "staged entry" at technical support levels ($140–$144), arguing that waiting for deep value may result in missing a structural shift in the energy sector.
2. Rationale & Analysis#
As a value investor, my job is to distinguish between a company’s operational success and the attractiveness of its stock price.
On Business Quality (Agreeing with the Bull): The Bull is correct that XOM is no longer the bloated giant of 2014. The argument that "Exxon isn't just an oil company; it’s a manufacturing machine for free cash flow with a thirty-five-dollar breakeven" is compelling. The integration of Pioneer and the low-carbon intensity of Guyana provide a legitimate competitive advantage. We acknowledge the business risk has decreased significantly due to operational efficiency.
On Valuation & Margin of Safety (Agreeing with the Bear): However, the Bear’s warning regarding the "peak earnings fallacy" is the dispositive factor for our stance. The Bull’s thesis relies on an "Average DCF" assuming $80+ oil indefinitely. As Buffett teaches, we cannot build a margin of safety on the prediction of commodity prices. The Bear’s observation that "an RSI over 80... is an emergency flare" and that we are being asked to pay a "20% premium over the safe-harbor price" aligns with our principle of capital preservation. We do not buy cyclical stocks at peak multiples, even if the business is "wonderful."
On the "Middle Ground" (Refuting the Neutral): The Neutral analyst suggests buying at $140 to avoid "missing out." This is FOMO (Fear Of Missing Out) disguised as strategy. In value investing, missing a rally is an acceptable opportunity cost; permanent capital loss is not. Buying at $140 offers no margin of safety if oil reverts to its historical mean of $60-$70. We will not "stage in" at a premium; we will wait for the price to come to value.
3. Refined Investor’s Plan#
Based on the debate, the original plan to wait for a "crisis" ($65 oil) might be too passive given the structural improvements in XOM's efficiency. However, buying now is reckless. We are adjusting the target price upward from "deep distress" to "fair value with safety."
Updated Plan:
- Primary Objective: Acquire XOM only when the price implies a margin of safety against a return to mid-cycle oil prices ($60-$70/bbl).
- Target Entry Zone: $115 - $125. (Aligned with the Safe Analyst's conservative DCF and the 200-day moving average).
Conditions to Monitor: 1. The "Geopolitical Premium" Fade: The Bull relies on an $80 floor. We will watch for a cooling in geopolitical tensions. If oil drops to $70 and XOM stock corrects to our target zone while maintaining its $35 operational breakeven, that is the buy signal. 2. Pioneer Synergy Verification: The Risky analyst claims $2B in synergies are coming. We need to verify these appear in the Cash Flow from Operations lines over the next two quarters, not just in slide decks. 3. Shareholder Yield vs. Capex: Monitor if buybacks continue at the same pace if oil dips. If management cuts buybacks the moment oil drops, the "Fortress" narrative is weaker than advertised. 4. Technical Confluence: We will respect the Safe Analyst's "mean reversion." We are looking for the RSI to drop below 30 (oversold) on the weekly timeframe to coincide with our fundamental valuation target.
4. Learning from Past Mistakes (2014-2016 Reflection)#
In the previous cycle, I bought XOM because it was an "Aristocrat" with a high yield, ignoring that their production costs were rising while oil prices were falling. I confused historical prestige with future economics. * Correction for Today: I am not buying the "Aristocrat" narrative. I am validating the Unit Economics. The Bull has proven the unit economics are better today ($35 breakeven vs $80 in 2014). This gives me confidence to buy earlier in a dip than I would have a decade ago, but it does not justify overpaying at the top.
Final Stance: WATCH#
Summary: Exxon Mobil is a high-quality machine trading at a momentum price. We admire the efficiency, but we refuse to pay for peak-cycle optimism. We wait for the inevitable cyclical rotation to offer us this "Platinum Bond" at a discount.
Report generated by Deep Value Intelligence on 2026-02-15 19:50:53