
Insights Investing
Palantir Technologies (PLTR) Q3 2026 Intrinsic Value Analysis: Operational Excellence Meets Demanding Valuation
Podcast · Listen (45 min)
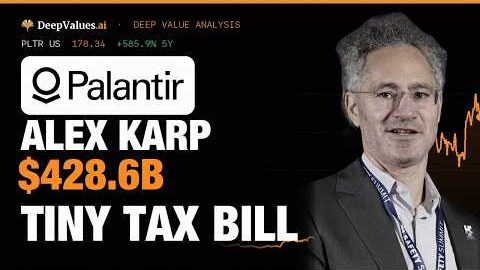
Palantir Technologies (PLTR) — Bearish? Palantir at $428.6B: The Risks Hidden in Footnotes
In brief
DeepValues Research, “Palantir Technologies (PLTR) Q3 2026 Intrinsic Value Analysis: Operational Excellence Meets Demanding Valuation” (Nov 3, 2026): During the third quarter of 2026, Palantir Technologies Inc. achieved a critical operational milestone: U.S. commercial revenue surged 148% year-over-year to $984 million, surpassing U.S. government revenue ($953 million) for the first time in corporate history.
Source: https://research.deepvalues.ai/insights/2026-11-03-palantir-q3-2026-earnings-financial-research/ · Markdown
Contents
- Owner Earnings and Free Cash Flow over Adjusted EPS
- Durability of the Economic Moat
- Return on Capital versus Its Cost and Sources of ROE
- Management's Capital Allocation and Candour
- Intrinsic Value versus Market Price and the Margin of Safety
- Footnotes and Items Worth Watching
- Key Numbers
- What Would Change Our View
- Our Stance
- Sources
During the third quarter of 2026, Palantir Technologies Inc. achieved a critical operational milestone: U.S. commercial revenue surged 148% year-over-year to $984 million, surpassing U.S. government revenue ($953 million) for the first time in corporate history. This commercial acceleration propelled total quarterly revenue up 96% year-over-year to $2.313 billion, generating $1.128 billion in GAAP net income (a 49% net profit margin) and $1.205 billion in operating cash flow. For a long-term business owner, these results demonstrate that Palantir's Artificial Intelligence Platform (AIP) and proprietary Ontology architecture are successfully transitioning commercial and public sector clients from experimental artificial intelligence pilots to mission-critical, high-return operational workflows. However, framing this operational execution against market pricing data sourced from Yahoo Finance as of November 2, 2026—where Palantir trades at $178.34 per share, representing a market capitalization of approximately $428.6 billion—presents the central dilemma in fundamental value analysis: an extraordinary enterprise with widening economic moats selling at a market price that leaves no traditional margin of safety.
Owner Earnings and Free Cash Flow over Adjusted EPS#
A rigorous application of value investing principles requires evaluating a business through an uncompromised owner earnings lens, explicitly rejecting management’s reliance on non-GAAP constructs such as "Adjusted EPS" ($0.44 in Q3 2026) and "Adjusted Income from Operations" ($1.427 billion). These non-GAAP figures routinely add back real, ongoing economic costs—most notably stock-based compensation (SBC)—creating an inflated baseline of economic profitability.
Stock-based compensation represents a genuine expense to equity holders through the dilution of corporate ownership. Per Exhibit 99.1 to the press release dated November 2, 2026, Palantir recognized SBC expenses of $318.9 million for the three months ended September 30, 2026, and $785.7 million for the nine-month period then ended. Under standard accounting rules, SBC is correctly categorized as an operating expense in the Condensed Consolidated Statements of Operations, reducing GAAP Net Income to $1.128 billion for the quarter.
Because stock-based compensation is a non-cash expense, management re-adds SBC when calculating Cash Flow from Operations ($1.205 billion in Q3 2026) and Adjusted Free Cash Flow ($1.216 billion, which adjusts for $19.5 million in employer payroll taxes on SBC and $8.0 million in capital expenditures). However, in evaluating fundamental owner earnings—the true cash return generated by business operations attributable to equity holders—SBC must never be added back to GAAP net income, as doing so treats equity dilution as if it were costless.
To evaluate Palantir's true quarter-operational cash generation from an owner's standpoint, we derive True Owner Earnings by adjusting GAAP Net Income for non-operating investment returns and capital reinvestment requirements:
- GAAP Net Income Attributable to Common Stockholders: $1,128.0 million
- Less Non-Operating Interest Income: -$88.9 million (interest income from cash and U.S. Treasuries per Exhibit 99.1)
- Less Capital Expenditures: -$8.0 million (purchases of property and equipment per Exhibit 99.1)
- True Baseline Owner Earnings: $1,031.1 million
This calculation establishes that Palantir generated over $1.03 billion in true net operational owner returns during Q3 2026. The table below contrasts Palantir's reported GAAP metrics against management's non-GAAP adjustments for the quarter ended September 30, 2026 (data sourced from Exhibit 99.1):
| Financial Metric (Q3 2026) | GAAP Reported Value | Non-GAAP Metric / Adjustment |
|---|---|---|
| Operating Income / Margin | $1.085 Billion (47%) | $1.426 Billion (62%) |
| Net Income Attributable to Common Stockholders | $1.128 Billion (49%) | $1.142 Billion |
| Diluted Earnings Per Share (EPS) | $0.44 | $0.44 |
| Operating Cash Flow / Free Cash Flow | $1.205 Billion | $1.216 Billion (Adj. FCF) |
Because Palantir's GAAP operating margin expanded to 47% and GAAP net margin reached 49% in Q3 2026, the underlying cash generation power of the business has grown sufficiently large to absorb ongoing stock-based compensation expenses while delivering expanding cash profitability to the balance sheet.
Durability of the Economic Moat#
Palantir’s widening economic moat rests upon exceptional switching costs and high installation barriers across its four core software platforms: Foundry, Gotham, Apollo, and AIP. As detailed in the Form 10-K for the fiscal year ended December 31, 2025, Palantir provides foundational data infrastructure. The architectural core of these platforms is the Palantir Ontology—a dynamic software layer that maps disparate enterprise data sources into operational contexts, binding business logic, algorithms, automated action triggers, and artificial intelligence models into a unified system.
When an enterprise integrates its core operational workflows into the Palantir Ontology, replacing the software becomes operationally disruptive and financially prohibitive. On the Q3 2026 earnings call transcript, Chief Technology Officer Sham Sankar emphasized that the fundamental unit of an enterprise is not the individual knowledge worker, but the workflow itself. By utilizing AIP as an enterprise harness, clients deploy AI models directly into production pipelines to generate measurable operational return on investment (ROI).
Technical disclosures from management demonstrate how customer switching costs are expanding beyond basic enterprise software lock-in into proprietary AI model weights. CTO Sham Sankar highlighted that post-training open-weight models on operational data within the Ontology enables superior, domain-specific performance at lower cost. For example: * L3Harris fine-tuned open-source models on its proprietary Ontology data, producing a sovereign model that outperformed its prior frontier model in under 48 hours while reducing execution costs by 95%. * McCarthy Building Companies implemented post-trained Neatron on 4-billion parameter models to automate contract risk review and request-for-information (RFI) classification, saving an estimated 30,000 hours annually.
This architectural integration is accelerating commercial adoption. Per Exhibit 99.1, U.S. commercial revenue grew 148% year-over-year and 29% sequentially to $984 million in Q3 2026. On the earnings call, Chief Revenue Officer Ryan Taylor illustrated how AIP Bootcamps compress sales cycles into rapid contract conversions: * An industrial materials company converted a $3 million pilot from Q2 2026 into a $29 million annual contract value (ACV) deal in Q3 2026. * A global athletic brand converted a $1.66 million pilot into an estimated $21 million ACV contract. * A home appliance manufacturer converted a $1 million pilot into a $3 million ACV deal in Q2 2026, expanding to a $15 million ACV contract by Q3 2026.
In the public sector, defense integration provides a durable baseline. U.S. government revenue expanded 96% year-over-year to $953 million in Q3 2026. Key government programs—such as the U.S. Army awarding Palantir a prime agreement to produce eight TITAN (Tactical Intelligence Targeting Access Node) ground station systems and the expansion of the Maven program past 100,000 active users—reflect deep defense anchoring. Customer retention across all segments remains robust, with net dollar retention reaching 165% in Q3 2026 (up 800 basis points sequentially per Exhibit 99.1).
Return on Capital versus Its Cost and Sources of ROE#
Palantir maintains a debt-free balance sheet fortress. As reported in the Condensed Consolidated Balance Sheets in Exhibit 99.1, the company held $10.4 billion in cash, cash equivalents, and marketable U.S. Treasury securities as of September 30, 2026, with zero funded long-term debt (maintaining an undrawn $500 million revolving credit facility described in the FY 2025 Form 10-K).
A DuPont framework decomposes Return on Equity (ROE) into net profit margin, asset turnover, and financial leverage. Palantir’s high equity returns are generated entirely through operating margin expansion and asset productivity rather than balance sheet leverage:
- Operating Profit Margin Expansion: GAAP operating income reached $1.085 billion in Q3 2026 (a 47% GAAP operating margin), while GAAP net income expanded to $1.128 billion (a 49% GAAP net margin). CFO Dave Glazer noted on the earnings call that quarterly net income has expanded nearly eightfold from $144 million in Q3 2024.
- Asset Productivity: Quarterly revenue of $2.313 billion was generated against a total asset base of $13.413 billion as of September 30, 2026, representing strong asset utilization for a software company carrying over $10.4 billion in cash and low-yielding U.S. Treasuries.
- Zero Financial Leverage: Total stockholders' equity stood at $11.228 billion against total liabilities of $2.068 billion at quarter-end, leaving the company entirely equity-funded.
In corporate finance theory, returns on invested capital driven by widening operating profit margins and unlevered balance sheets represent the highest quality form of earnings power achievable.
Management's Capital Allocation and Candour#
Value investing principles assess management on capital allocation discipline and transparent communication with business owners. CEO Alex Karp and CFO Dave Glazer have consistently directed capital toward internal software R&D and liquid reserves rather than debt-financed share repurchases or speculative corporate acquisitions at elevated valuation multiples.
Rather than allocating funds to non-core mergers, management maintained a $10.4 billion treasury while expanding investments in engineering talent. In Q3 2026, non-GAAP adjusted operating expenses rose to $887 million (up 53% year-over-year) as Palantir onboarded its latest cohort of technical graduates to scale AIP and Sovereign AI platforms.
Management's commentary during the Q3 2026 earnings call transcript reflected a direct focus on mission alignment and economic returns. Addressing corporate strategy and national defense support, CEO Alex Karp stated:
"We support your alpha, we support your sovereignty, we've done this for over 20 years, we support the war fighter, we are delighted that we can support the war fighter even more because we're making so much money, but we believe we have a moral imperative to be the dominant player in our industry."
This explicit focus on client ROI, mission execution, and software dominance contrasts with routine corporate public relations rhetoric. CFO Dave Glazer reinforced this operational discipline, emphasizing that management intends to continuously reinvest in technical talent and R&D while delivering GAAP operating profitability every quarter.
Intrinsic Value versus Market Price and the Margin of Safety#
While Palantir exhibits elite business characteristics—96% revenue growth, expanding switching costs, net profit margins near 50%, and $10.4 billion in net liquidity—a great company is not automatically a great investment. Benjamin Graham’s intrinsic value framework requires purchasing an equity security at a significant discount to its conservatively appraised value to secure a margin of safety.
According to market data from Yahoo Finance as of November 2, 2026, Palantir traded at $178.34 per share, translating to a total market capitalization of approximately $428.6 billion. To contextualize this valuation against updated full-year 2026 guidance provided in Exhibit 99.1: * Raised Full-Year 2026 Revenue Guidance: $8.530 billion to $8.534 billion (representing 91% year-over-year growth). * Raised Full-Year 2026 Adjusted Free Cash Flow Guidance: $4.8 billion to $5.0 billion.
At a market capitalization of $428.6 billion, Palantir trades at approximately 50.2 times full-year 2026 expected revenue ($8.532 billion midpoint) and 87.5 times full-year 2026 expected adjusted free cash flow ($4.9 billion midpoint). Enterprise Value (EV) multiples reflect similar pricing given net liquidity of $10.4 billion.
Paying ~87 times forward free cash flow requires assuming that Palantir will compound its top-line revenue at 40%+ annually for nearly a decade without encountering margin degradation, regulatory friction, or macroeconomic headwinds. Purchasing equity at over 80 times cash generation leaves zero margin of safety for potential execution missteps or valuation multiple compression. Therefore, while Palantir's operational performance is exceptional, the current market price reflects a demanding valuation that precludes a value-investing purchase recommendation.
Footnotes and Items Worth Watching#
Because Palantir's Quarterly Report on Form 10-Q for the period ended September 30, 2026, was not yet filed at the time of source gathering, this forensic review relies on prior SEC filings—specifically the Form 10-Q for the quarterly period ended June 30, 2026, and the Form 10-K for the year ended December 31, 2025—in conjunction with the Q3 2026 earnings release (Exhibit 99.1).
A detailed inspection of disclosures across these filings highlights several items for ongoing monitoring:
- Non-GAAP Add-Back Dynamics: Per Exhibit 99.1, Q3 2026 non-GAAP adjusted income from operations adds back $318.9 million in stock-based compensation and $23.1 million in related employer payroll taxes. For the nine months ended September 30, 2026, cumulative SBC add-backs reached $785.7 million alongside $68.3 million in stock-related employer payroll taxes.
- Revenue Recognition and RPO Terms: Under ASC 606 practices outlined in the FY 2025 Form 10-K, remaining performance obligations (RPO) exclude contracts with original terms of 12 months or less and contract values subject to termination-for-convenience clauses. In Exhibit 99.1, total RPO reached $4.9 billion (up 88% Y/Y), while total contract value (TCV) closed in Q3 2026 was $2.918 billion. Investors should monitor termination provisions, which are standard across public sector awards and commercial agreements.
- Working Capital Cash Drag via Accounts Receivable: In the Condensed Consolidated Balance Sheets (Exhibit 99.1), Accounts Receivable, net increased to $1.883 billion as of September 30, 2026, up from $1.042 billion at December 31, 2025. Per the Condensed Consolidated Statements of Cash Flows in Exhibit 99.1, this operational expansion resulted in an $843.4 million cash drain from Accounts Receivable over the nine-month period ended September 30, 2026 (compared to a $423.0 million drain in 9M 2025). Accounts receivable expanded 80.8% over nine months, tying up substantial liquidity in working capital as top-line revenue scaled.
- Customer Concentration Disclosures: Item 1A of the Form 10-K for FY 2025 notes that Palantir's top three customers accounted for 16% of total 2025 revenue (down from 17% in 2024), reflecting improving diversification alongside ongoing concentration.
- Leases and Capital Expenditures: Balance sheet disclosures in Exhibit 99.1 report Operating Lease Right-of-Use Assets of $244.9 million against Noncurrent Operating Lease Liabilities of $225.3 million as of September 30, 2026. Capital expenditures remained low at $8.0 million for the quarter ($30.0 million for 9M 2026).
- Tax Effective Rates: Reconciliations in Exhibit 99.1 incorporate an estimated long-term non-GAAP annual effective tax rate of 23.0%. GAAP provision for income taxes stood at $13.6 million in Q3 2026 on pre-tax GAAP income of $1.148 billion.
- Corporate Governance and Voting Structure: As disclosed in Item 1A and Item 5 of the FY 2025 Form 10-K, Palantir maintains a multi-class stock structure comprising Class A common stock (1 vote per share), Class B common stock (10 votes per share), and Class F common stock. The Founder Voting Trust Agreement concentrates voting power among Founders Stephen Cohen, Alexander Karp, and Peter Thiel, establishing governance control independent of public equity ownership levels.
Key Numbers#
The primary quantitative metrics defining Palantir’s operating performance include:
- Q3 2026 Total Revenue: $2.313 billion, up 96% year-over-year (Source: Exhibit 99.1, Q3 2026 Earnings Release)
- Q3 2026 U.S. Commercial Revenue: $984 million, up 148% year-over-year (Source: Exhibit 99.1, Q3 2026 Earnings Release)
- Q3 2026 U.S. Government Revenue: $953 million, up 96% year-over-year (Source: Exhibit 99.1, Q3 2026 Earnings Release)
- Q3 2026 GAAP Net Income: $1.128 billion (49% net profit margin) (Source: Exhibit 99.1, Q3 2026 Earnings Release)
- Q3 2026 GAAP Operating Income: $1.085 billion (47% operating margin) (Source: Exhibit 99.1, Q3 2026 Earnings Release)
- Q3 2026 Operating Cash Flow: $1.205 billion (Source: Exhibit 99.1, Q3 2026 Earnings Release)
- Q3 2026 Adjusted Free Cash Flow: $1.216 billion (Source: Exhibit 99.1, Q3 2026 Earnings Release)
- Cash, Cash Equivalents & Marketable U.S. Treasuries: $10.4 billion as of September 30, 2026, with zero funded long-term debt (Source: Exhibit 99.1, Q3 2026 Earnings Release)
- FY 2026 Full-Year Revenue Guidance: Raised to between $8.530 billion and $8.534 billion (Source: Exhibit 99.1, Q3 2026 Earnings Release)
- Market Share Price & Market Cap: $178.34 per share and ~$428.6 billion market capitalization on November 2, 2026 (Source: Yahoo Finance)
What Would Change Our View#
Four observable operational or structural developments would invalidate this fundamental assessment:
- Deceleration in U.S. Commercial Growth: A material slowdown in U.S. commercial revenue expansion below 50% year-over-year, or a failure to convert AIP Bootcamp pilot programs into binding Annual Contract Value (ACV) extensions.
- Margin Compression from SBC Dilution: Reversal of GAAP operating margin expansion such that stock-based compensation again exceeds net cash generation, resulting in persistent dilution without commensurate operational cash flow growth.
- Government Contract Cancellations or Downscopes: Material non-renewals, budget reductions, or exercise failures across core defense programs—such as Maven or TITAN—under federal termination-for-convenience provisions.
- Valuation Compression Toward Historical Norms: A structural market repricing of enterprise software multiples that brings Palantir's share price into closer alignment with conservative intrinsic value calculations.
Our Stance#
Neutral. Palantir demonstrates outstanding operational performance, expanding competitive moats across commercial and government software sectors, GAAP net profit margins approaching 50%, and an unassailable balance sheet holding $10.4 billion in net liquid assets. However, with market pricing at $178.34 per share—valuing the firm at over 50 times 2026 expected sales and 87 times expected free cash flow—the current share price leaves no traditional value-investing margin of safety. We invite you to read the full open-source report on Palantir on the DeepValues Research site or to evaluate the business's intrinsic value directly within the DeepValues app.
Sources#
- Exhibit 99.1: Palantir Reports Q3 2026 U.S. Comm Revenue Growth of 148% Y/Y and Revenue Growth of 96% Y/Y, Palantir Technologies Inc. / Business Wire
- Palantir Technologies Q3 FY26 Earnings Call Transcript, Benzinga / Palantir Technologies Inc.
- Form 10-K for the Fiscal Year Ended December 31, 2025, Palantir Technologies Inc. / U.S. Securities and Exchange Commission
- Form 10-Q for the Quarterly Period Ended June 30, 2026, Palantir Technologies Inc. / U.S. Securities and Exchange Commission
- Palantir Technologies Inc. (PLTR) Market Data (November 2, 2026), Yahoo Finance

Watch
Source links
Watch & listen
- Palantir at $428.6B: The Risks Hidden in Footnotes YouTube · EN
- Palantir Technologies (PLTR) — Bearish? Palantir at $428.6B: The Risks Hidden in Footnotes Podcast · EN
- Palantir本益比近百倍:營收暴增96%,為何安全邊際是零 YouTube · 中文
- Palantir Technologies(PLTR)看空?Palantir本益比近百倍… Podcast · 中文