
Insights Investing
Tom Russo’s Q3 2026 13F Filing: Gardner Russo & Quinn Portfolio Breakdown and Valuations
Podcast · Listen (20 min)
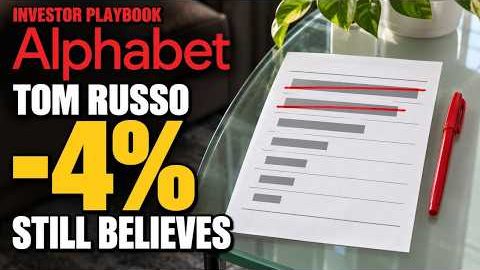
Why Tom Russo Trimmed Alphabet and Mastercard by 4% | Investor Playbook
In brief
DeepValues Research, “Tom Russo’s Q3 2026 13F Filing: Gardner Russo & Quinn Portfolio Breakdown and Valuations” (Nov 12, 2026): During the third quarter of 2026, Gardner Russo & Quinn executed a systematic, broad-based trimming across its major equity holdings, generating net sales of $332.3M by harvesting capital from core positions including Alphabet Inc.
Source: https://research.deepvalues.ai/insights/2026-11-12-tom-russo-q3-2026-13f-portfolio-research/ · Markdown
Contents
- 1. The Investor: Philosophy, Fund, and Lifetime Work
- 2. The Portfolio at Quarter End: Size, Concentration, Core Holdings
- 3. What Changed: New, Added, Trimmed, and Sold-Out Positions
- 4. The Biggest Moves, Valued
- Valuation Methodology & Mechanics:
- 4.1 Alphabet Inc. (GOOG) Valuation Walkthrough
- 4.2 Mastercard Incorporated (MA) Valuation Walkthrough
- 4.3 Philip Morris International Inc. (PM) Valuation Walkthrough
- 5. Track Record: The Ten-Year 13F Clone Against the S&P 500
- Clone Methodology & Structural Context:
- 10-Year Performance Summary (2016–2026):
- Cyclical Behavior & Downside Protection:
- Annual Return Comparison Table:
- Critical 13F Clone Methodology Caveats:
- 6. What a Patient Investor Can Learn
- 1. Patience & Ultra-Low Turnover
- 2. Valuation Discipline in Mature Holdings
- 3. Evaluating the "Capacity to Suffer"
- 7. Key Numbers
- Institutional 13F Limitations
- Compliance & Regulatory Disclosures
During the third quarter of 2026, Gardner Russo & Quinn executed a systematic, broad-based trimming across its major equity holdings, generating net sales of $332.3M by harvesting capital from core positions including Alphabet Inc. (GOOG), Mastercard Incorporated (MA), and Berkshire Hathaway Inc. (BRK.A), even while maintaining an overall quarterly portfolio turnover rate near 0.0%. For long-term value investors, this quarter's filing reflects disciplined ongoing portfolio maintenance and intrinsic valuation adjustments rather than a thematic macro shift. By trimming positions whose market prices have gravitated toward or exceeded their base intrinsic value estimates, the firm continues to practice prudent risk management and capital allocation without compromising its multi-decade commitment to dominant global compounders.
1. The Investor: Philosophy, Fund, and Lifetime Work#
Gardner Russo & Quinn is an institutional investment manager headquartered in Lancaster, Pennsylvania, overseeing approximately $10B in assets under management (AUM). Categorized by DeepValues Research under the value investment style, the firm is led by Tom Russo, whose long career and distinct analytical framework have made him a seminal figure within value investing circles. Russo’s academic and industry standing is anchored by his tenure as a longtime adjunct professor at Columbia Business School, where his lectures on global equity selection, capital allocation, and brand longevity are widely studied and circulated.
The cornerstone of Russo’s investment philosophy is his signature concept known as the "capacity to suffer." This concept defines a management team's structural and psychological willingness to absorb severe, short-term margin pressure or temporary earnings declines in order to deploy heavy capital expenditures behind long-term brand equity, distribution networks, and global competitive moats. In Russo's framework, executive teams lacking the capacity to suffer often capitulate to Wall Street's quarterly earnings demands, curtailing vital reinvestments and ultimately degrading their business moats over time.
Consequently, Gardner Russo & Quinn's portfolio profile is dominated by world-class, global consumer-brand enterprises and compounding platforms—such as Nestlé S.A., Heineken Holding N.V., Pernod Ricard SA, and Berkshire Hathaway Inc.—that possess multi-decade reinvestment runways. The firm is known for maintaining an exceptionally long investment horizon, frequently holding core franchises for decades to let tax-deferred enterprise compounding generate long-term equity growth.
2. The Portfolio at Quarter End: Size, Concentration, Core Holdings#
For the third quarter ended September 30, 2026 (filed via Form 13F-HR on November 12, 2026), Gardner Russo & Quinn reported a total US-listed long equity value of $8.42B distributed across 83 positions. This represents a modest decline from the previous quarter (Q2 2026), when reported long equity assets stood at $8.92B across the same 83 positions.
The portfolio exhibits an exceptionally high degree of capital concentration, reflecting firm conviction in its core holdings. The top 10 positions account for 80.6% of the total reported portfolio value. Below is the complete overview of the portfolio’s core holdings at the close of Q3 2026:
| Holding Name | Ticker | Portfolio Value ($) | Portfolio Weight (%) | Q3 Share Count Change (%) |
|---|---|---|---|---|
| Berkshire Hathaway Inc. (Class A) | BRK.A | $1.04B | 12.3% | -3% |
| Alphabet Inc. | GOOG | $993.2M | 11.8% | -4% |
| Philip Morris International Inc. | PM | $836.9M | 9.9% | -3% |
| Mastercard Incorporated | MA | $806.3M | 9.6% | -4% |
| Cie Financiere Richemont SA | CFRHF | $688.9M | 8.2% | -4% |
| Heineken Holding N.V. | HKHHF | $635.0M | 7.5% | -4% |
| Berkshire Hathaway Inc. (Class B) | BRK.B | $515.5M | 6.1% | -4% |
| Nestlé S.A. (ADR) | NSRGY | $463.6M | 5.5% | -4% |
| Sunbelt Rentals Holdings, Inc. | SUNB | $412.0M | 4.9% | -5% |
| Netflix Inc. | NFLX | $387.7M | 4.6% | -2% |
| Uber Technologies, Inc. | UBER | $337.1M | 4.0% | -3% |
| Eurofins Scientific SE | ERFSF | $336.4M | 4.0% | -4% |
| Martin Marietta Materials, Inc. | MLM | $328.1M | 3.9% | -3% |
| DoorDash, Inc. | DASH | $209.7M | 2.5% | -4% |
| Pernod Ricard SA | PDRDF | $153.5M | 1.8% | -5% |
3. What Changed: New, Added, Trimmed, and Sold-Out Positions#
During the third quarter of 2026, portfolio transaction statistics were characterized by broad-based trimming across existing positions with minimal new buying. Overall activity encompassed: * New Positions: 2 * Positions Added To: 9 * Positions Trimmed: 37 * Positions Sold Out: 2
In total, Gardner Russo & Quinn deployed approximately $1.2M toward buys while realizing approximately $333.5M in proceeds from share reductions (measured at quarter-end prices). Consequently, the fund was a net seller by ~$332.3M. Despite these sales, because the capital realignments were executed uniformly across dozens of holdings, the firm's overall quarterly portfolio turnover rate remained at approximately 0.0%.
Note: Commentary on managerial motives represents inference based on trading patterns and fundamental valuations (such as systematic rebalancing or cash harvesting across mature holdings).
The detailed breakdown of major trimmed positions, ordered by estimated total dollar reduction from largest to smallest, includes:
- Alphabet Inc. (GOOG): Trimmed share count by 4% (estimated ~$45.4M reduction). Ending position value stands at $993.2M, representing 11.8% of the equity portfolio.
- Mastercard Incorporated (MA): Trimmed share count by 4% (estimated ~$33.3M reduction). Ending position value stands at $806.3M, representing 9.6% of the equity portfolio.
- Berkshire Hathaway Inc. (Class A) (BRK.A): Trimmed share count by 3% (estimated ~$29.9M reduction). Ending position value stands at $1.04B, representing 12.3% of the equity portfolio.
- Cie Financiere Richemont SA (CFRHF): Trimmed share count by 4% (estimated ~$28.7M reduction). Ending position value stands at $688.9M, representing 8.2% of the equity portfolio.
- Philip Morris International Inc. (PM): Trimmed share count by 3% (estimated ~$27.7M reduction). Ending position value stands at $836.9M, representing 9.9% of the equity portfolio.
- Heineken Holding N.V. (HKHHF): Trimmed share count by 4% (estimated ~$26.0M reduction). Ending position value stands at $635.0M, representing 7.5% of the equity portfolio.
- Berkshire Hathaway Inc. (Class B) (BRK.B): Trimmed share count by 4% (estimated ~$22.0M reduction). Ending position value stands at $515.5M, representing 6.1% of the equity portfolio.
- Sunbelt Rentals Holdings, Inc. (SUNB): Trimmed share count by 5% (estimated ~$19.8M reduction). Ending position value stands at $412.0M, representing 4.9% of the equity portfolio.
- Nestlé S.A. (ADR) (NSRGY): Trimmed share count by 4% (estimated ~$18.9M reduction). Ending position value stands at $463.6M, representing 5.5% of the equity portfolio.
- Eurofins Scientific SE (ERFSF): Trimmed share count by 4% (estimated ~$12.4M reduction). Ending position value stands at $336.4M, representing 4.0% of the equity portfolio.
- Uber Technologies, Inc. (UBER): Trimmed share count by 3% (estimated ~$11.2M reduction). Ending position value stands at $337.1M, representing 4.0% of the equity portfolio.
- Martin Marietta Materials, Inc. (MLM): Trimmed share count by 3% (estimated ~$10.4M reduction). Ending position value stands at $328.1M, representing 3.9% of the equity portfolio.
- Netflix Inc. (NFLX): Trimmed share count by 2% (estimated ~$9.6M reduction). Ending position value stands at $387.7M, representing 4.6% of the equity portfolio.
- Pernod Ricard SA (PDRDF): Trimmed share count by 5% (estimated ~$8.5M reduction). Ending position value stands at $153.5M, representing 1.8% of the equity portfolio.
- DoorDash, Inc. (DASH): Trimmed share count by 4% (estimated ~$8.0M reduction). Ending position value stands at $209.7M, representing 2.5% of the equity portfolio.
4. The Biggest Moves, Valued#
To evaluate whether Tom Russo’s Q3 trimming actions align with fundamental value metrics, DeepValues Research applies Warren Buffett–style Owner Earnings Discounted Cash Flow (DCF) and Reverse DCF models derived from ten years of SEC XBRL filings (Form 10-K and 10-Q).
Valuation Methodology & Mechanics:#
- Starting TTM Owner Earnings Formula: Calculated as
Operating Cash Flow - Maintenance Capex - Stock-Based Compensation. - Stock-Based Compensation (SBC) Dilution: In DeepValues DCF modeling, SBC is explicitly deducted as an operating cash outflow. Although non-cash on the cash flow statement, issuing stock to employees dilutes existing shareholders just as directly as cash compensation. Treating SBC as a free cash expense prevents artificial overstatement of owner earnings.
- Maintenance Capex vs. Growth Capex: Maintenance capex is defined as the smaller of total Capital Expenditures (Capex) and Depreciation & Amortization (D&A), representing the baseline capital required to maintain current operational capacity. Any capex spent above D&A is classified as growth investment intended to expand future earnings. If growth capex fails to generate returns above the cost of capital, the stricter valuation model subtracting all capex reflects true free cash generation.
- Discount Rate & Terminal Parameters: All models utilize a standard 10.0% discount rate. Years 1–5 project owner earnings growth at rate $g$, years 6–10 linearly fade to a perpetual growth rate of 2.5%, followed by a terminal value capitalized at 2.5%.
- Reverse DCF (Implied Growth Rate): Solves for the exact annual owner earnings growth rate required over the next 5 years to justify the current market price under standard DCF parameters.
- Verification Status: Evaluates data integrity across independent sources. "Double Verified" indicates independent secondary database runs match primary SEC filing runs within 0.0% to 3.0% tolerance.
4.1 Alphabet Inc. (GOOG) Valuation Walkthrough#
- Q3 Activity: Trimmed 4% of shares (~$45.4M reduction). Position remains 11.8% of portfolio ($993.2M).
- Market Price (as of valuation date 2026-11-12): $296.25 per share (Market Cap: $3,642.0B across 12.294B shares).
- TTM Owner Earnings Derivation:
- Operating Cash Flow: $179.6B
- Total Capex: $159.8B (D&A: $28.0B)
- Maintenance Capex: $28.0B (leaving $131.8B of capital expenditures treated as growth investment)
- Stock Compensation: $30.4B
- Starting TTM Owner Earnings: $121.1B ($179.6B - $28.0B - $30.4B).
The AI Capex Cycle and "Capacity to Suffer":#
Alphabet presents a dramatic divergence between maintenance owner earnings ($121.1B) and owner earnings post-all capex (-$10.7B). Out of $159.8B in TTM capex, $131.8B is deployed above depreciation as aggressive growth investment in AI servers, custom silicon, and data center infrastructure. In Russo's analytical framework, this unprecedented spending represents the ultimate manifestation of the "capacity to suffer"—management willingly converts positive net cash flow into massive capital projects to secure dominant AI capability and defend its Search and Cloud moats over the next decade.
DCF Intrinsic Value Estimates (10.0% Discount Rate):#
- Conservative Case ($99.98 per share): Assumes $g = 7.5%$ and starting owner earnings of $60.6B (counting half of growth capex above depreciation as necessary upkeep). Market price of $296.25 is 196.3% above conservative value.
- Base Case ($277.40 per share): Assumes $g = 15.0%$ (matching 10-year historical owner earnings growth) and starting owner earnings of $121.1B. Adjusted for net cash of $139.0B ($265.1B cash/securities less $126.1B debt). Margin of Safety is -6.8% (price is 6.8% above base intrinsic value).
- Optimistic Case ($340.25 per share): Assumes $g = 19.0%$. Provides a positive Margin of Safety of +12.9% (price is 12.9% below optimistic value).
Scenario Summary: Alphabet Inc. (GOOG)#
- Market Price: $296.25
- Conservative Value: $99.98 (Price +196.3% above value)
- Base Value: $277.40 (Price +6.8% above value | Margin of Safety: -6.8%)
-
Optimistic Value: $340.25 (Margin of Safety: +12.9%)
-
Reverse DCF Implied Growth: The market price of $296.25 implies that Alphabet must grow its owner earnings at 16.3% annually for the next 5 years, slightly exceeding its 10-year historical compound growth rate of 15.0%.
- Verification Status: NOT VERIFIED. Run B could not be completed because second-source data is missing for select earlier historical periods (specifically depreciation and cash flow line items from FY2016 through FY2021). The value is presented as a single-source SEC XBRL estimate.
- Investor Action Context: Tom Russo trimmed GOOG at a market price ($296.25) slightly above its base intrinsic value ($277.40), taking profits where market growth expectations (16.3% implied growth) outpace historical compounding rates.
4.2 Mastercard Incorporated (MA) Valuation Walkthrough#
- Q3 Activity: Trimmed 4% of shares (~$33.3M reduction). Position remains 9.6% of portfolio ($806.3M).
- Market Price (as of valuation date 2026-11-12): $654.31 per share (Market Cap: $570.0B across 0.871B shares).
- TTM Owner Earnings Derivation:
- Operating Cash Flow: $16.9B
- Total Capex: $0.8B (D&A: $1.2B)
- Maintenance Capex: $0.8B (smaller of capex and D&A)
- Stock Compensation: $0.6B
- Starting TTM Owner Earnings: $15.4B ($16.9B - $0.8B - $0.6B).
DCF Intrinsic Value Estimates (10.0% Discount Rate):#
- Conservative Case ($301.68 per share): Assumes $g = 7.4%$. Market price of $654.31 is 116.9% above conservative value.
- Base Case ($458.29 per share): Assumes $g = 14.8%$ (matching 10-year historical growth) and starting owner earnings of $15.4B. Adjusted for net debt of -$13.8B ($10.1B cash less $23.9B debt). Margin of Safety is -42.8% (price is 42.8% above base intrinsic value).
- Optimistic Case ($570.37 per share): Assumes $g = 18.8%$. Market price is 14.7% above optimistic value.
Scenario Summary: Mastercard Incorporated (MA)#
- Market Price: $654.31
- Conservative Value: $301.68 (Price +116.9% above value)
- Base Value: $458.29 (Price +42.8% above value | Margin of Safety: -42.8%)
-
Optimistic Value: $570.37 (Price +14.7% above value)
-
Reverse DCF Implied Growth: The prevailing market price of $654.31 implies an aggressive owner earnings growth rate of 21.4% annually for the next 5 years, compared to Mastercard’s historical 10-year owner earnings growth rate of 14.8%.
- Verification Status: DOUBLE VERIFIED. Run A (SEC filings) and Run B (independent database) match with a 0.0% difference across inputs and final valuation.
- Investor Action Context: Russo trimmed MA while the stock traded significantly above its base intrinsic value ($458.29), locking in gains as market sentiment demanded growth rates (21.4%) that detached from historical compounding norms.
4.3 Philip Morris International Inc. (PM) Valuation Walkthrough#
- Q3 Activity: Trimmed 3% of shares (~$27.7M reduction). Position remains 9.9% of portfolio ($836.9M).
- Market Price (as of valuation date 2026-11-12): $198.33 per share (Market Cap: $309.1B across 1.559B shares).
- TTM Owner Earnings Derivation:
- Operating Cash Flow: $15.2B
- Total Capex: $1.6B (D&A: $2.1B)
- Maintenance Capex: $1.6B
- Stock Compensation: negligible / under 10% of cash flow (no second source)
- Starting TTM Owner Earnings: $13.6B ($15.2B - $1.6B).
DCF Intrinsic Value Estimates (10.0% Discount Rate):#
- Conservative Case ($121.60 per share): Assumes $g = 2.5%$. Market price of $198.33 is 63.1% above conservative value.
- Base Case ($138.90 per share): Assumes $g = 4.9%$ (matching 10-year historical growth) and starting owner earnings of $13.6B. Adjusted for net cash of $4.2B ($6.7B cash less $2.5B debt). Margin of Safety is -42.8% (price is 42.8% above base intrinsic value).
- Optimistic Case ($172.29 per share): Assumes $g = 8.9%$. Market price is 15.1% above optimistic value.
Scenario Summary: Philip Morris International Inc. (PM)#
- Market Price: $198.33
- Conservative Value: $121.60 (Price +63.1% above value)
- Base Value: $138.90 (Price +42.8% above value | Margin of Safety: -42.8%)
-
Optimistic Value: $172.29 (Price +15.1% above value)
-
Reverse DCF Implied Growth: Market pricing at $198.33 requires owner earnings growth of 11.5% annually over 5 years, more than double its historical 10-year rate of 4.9%.
- Verification Status: DOUBLE VERIFIED. Run A and Run B match with 0.0% difference.
- Investor Action Context: Russo trimmed PM as the market price ($198.33) expanded well beyond its base intrinsic valuation ($138.90), harvesting capital from a mature consumer franchise.
5. Track Record: The Ten-Year 13F Clone Against the S&P 500#
To evaluate the public tracking performance of Gardner Russo & Quinn's investment selections, DeepValues Research maintains a 10-year "13F Clone" portfolio model.
Clone Methodology & Structural Context:#
- Execution Rule: Disclosed common stock holdings are bought at the market close of the first trading day following the SEC filing date (when positions become public knowledge) and held until the subsequent 13F filing.
- Pricing & Benchmark: Position weights are proportional to reported 13F values, using dividend-adjusted share prices compared directly against the S&P 500 Total Return Index (SPY).
- Evaluation Window: November 14, 2016 through November 12, 2026 (10.0 years across 41 quarterly filings).
- Historical Portfolio Profile: Across the 10-year period, the clone portfolio averaged 90 positions, with an average top 10 concentration of 77.9% of reported value, an average quarterly turnover rate of 4.7%, and an average price coverage of 94.4% (positions lacking public price data were dropped and reweighted across remaining holdings).
10-Year Performance Summary (2016–2026):#
- Gardner Russo & Quinn 13F Clone: 11.4% CAGR | Total Return: +193.2% | Max Drawdown: -22.3%
- S&P 500 Index (SPY): 15.1% CAGR | Total Return: +309.2% | Max Drawdown: -23.9%
- Annual Performance Gap: -3.8 percentage points per year
Cyclical Behavior & Downside Protection:#
Russo’s value-driven selection exhibits strong defensive resilience during major market drawdowns, while underperforming during speculative or mega-cap technology rallies. For instance, during the bear market of 2022, the 13F Clone fell by only -11.8%, outperforming SPY’s -18.2% decline by 6.4 percentage points. Conversely, during aggressive tech-led bull markets (such as 2020, 2023, and 2024), the clone lagged SPY due to its structural tilt toward traditional global consumer brands and European holdings, while holding lower weights in mega-cap software and semiconductor companies.
Annual Return Comparison Table:#
| Year | Gardner Russo & Quinn 13F Clone (%) | SPY Total Return (%) | Performance Differential |
|---|---|---|---|
| 2016* (partial) | +3.3% | +3.8% | -0.5% |
| 2017 | +27.9% | +21.7% | +6.2% |
| 2018 | -11.1% | -4.6% | -6.5% |
| 2019 | +27.6% | +31.2% | -3.6% |
| 2020 | +5.7% | +18.3% | -12.6% |
| 2021 | +20.8% | +28.7% | -7.9% |
| 2022 | -11.8% | -18.2% | +6.4% |
| 2023 | +17.1% | +26.2% | -9.1% |
| 2024 | +12.3% | +24.9% | -12.6% |
| 2025 | +22.5% | +17.7% | +4.8% |
| 2026* (partial) | +7.8% | +11.9% | -4.1% |
Critical 13F Clone Methodology Caveats:#
- Does Not Equal Actual Net Fund Returns: A 13F clone model does not equal Gardner Russo & Quinn’s actual client account performance.
- Exclusion of Non-US Listings & Cash: Form 13F filings omit foreign listings traded directly on European or overseas exchanges (such as primary shares of Nestlé SA in Switzerland or Heineken NV in Europe), cash allocations, fixed income, short positions, and derivatives.
- Omission of Intra-Quarter Activity: The model cannot capture purchases or sales initiated and liquidated within a single calendar quarter.
- 45-Day Reporting Delay: Filings are subject to a 45-day delay between the quarter end and public disclosure.
6. What a Patient Investor Can Learn#
Analyzing Tom Russo’s Q3 2026 13F filing and fundamental valuation context offers vital takeaways for long-term investors:
1. Patience & Ultra-Low Turnover#
Operating with a quarterly portfolio turnover rate near ~0.0% highlights the power of compounding high-quality global franchises over decades rather than constantly trading. Minimizing portfolio churn reduces transaction friction, eliminates unnecessary capital gains taxation drag, and allows high-return business models to compound intrinsic equity value over multi-decade horizons.
2. Valuation Discipline in Mature Holdings#
Even elite global businesses can experience market price expansion that outpaces underlying intrinsic business growth. Russo’s decision to trim core holdings like Alphabet, Mastercard, and Philip Morris demonstrates disciplined risk management. When stock prices trade significantly above base intrinsic valuations—requiring implied growth rates well beyond historical norms—trimming share counts serves as a prudent mechanism to control position sizing and harvest capital.
3. Evaluating the "Capacity to Suffer"#
Understanding that corporate compounding requires periodic cash flow sacrifice is central to long-term equity analysis. Companies like Alphabet undergoing massive capex cycles ($159.8B in total TTM capex, with $131.8B dedicated to growth and AI infrastructure) demonstrate executive teams willing to suppress short-term free cash flow to preserve multi-decade competitive moats. Value investors must differentiate between structural business deterioration and deliberate capital investment that strengthens competitive moats.
7. Key Numbers#
For fast reference, the vital statistics from Gardner Russo & Quinn's Q3 2026 filing and DeepValues valuation models include:
- Reported Q3 2026 Equity Portfolio Value: $8.42B (across 83 positions).
- Portfolio Concentration: 80.6% of value in top 10 positions.
- Q3 Activity Net Cash Movement: Net seller of $332.3M ($1.2M bought vs. $333.5M sold).
- Quarterly Portfolio Turnover: Approximately 0.0%.
- Alphabet (GOOG) Base Intrinsic Value vs. Price: $277.40 vs. $296.25 (Margin of Safety: -6.8% | Implied Growth: 16.3%).
- Mastercard (MA) Base Intrinsic Value vs. Price: $458.29 vs. $654.31 (Margin of Safety: -42.8% | Implied Growth: 21.4%).
- Philip Morris (PM) Base Intrinsic Value vs. Price: $138.90 vs. $198.33 (Margin of Safety: -42.8% | Implied Growth: 11.5%).
- 10-Year 13F Clone CAGR: 11.4% (vs. S&P 500 Total Return of 15.1%).
8. Closing Note & Mandatory Disclaimers#
Institutional 13F Limitations#
Form 13F disclosures provide valuable insight into institutional equity management, but investors must recognize their statutory limitations: * Filings reflect positions as of the quarter end and are submitted up to 45 days late. * Filings include only US-listed long equity positions, completely omitting cash allocations, fixed income, short positions, non-US listings traded directly on international exchanges, options, and intra-quarter activity.
Compliance & Regulatory Disclosures#
- Exclusivity Statement: This document focuses exclusively on Gardner Russo & Quinn LLC and does not reference or analyze any other external investment management firms.
- Disclaimer: This document is published strictly for educational, research, and informational purposes by DeepValues Research and LuLu Ventures LLC. It does not constitute financial, investment, legal, or tax advice, nor is it a solicitation to buy or sell any security. All valuation estimates, DCF models, and performance metrics are derived from public regulatory filings and historical market data subject to analytical assumptions. Investors must perform independent due diligence and consult with licensed investment advisors prior to executing financial transactions.

Watch
Source links
- Alphabet (GOOG) Stock Analysis & Intrinsic Value: Neutral
- DEEPVALUES 13F WORKSHEET: Tom Russo (Gardner Russ…
- EDGAR Filing Documents for 0000860643-26-000006
- MasterCard (MA) Stock Analysis & Intrinsic Value: Neutral
Watch & listen
- Why Tom Russo Trimmed Alphabet and Mastercard by 4% YouTube · EN
- Why Tom Russo Trimmed Alphabet and Mastercard by 4% | Investor Playbook Podcast · EN
- Tom Russo賣出3.3億美元:為何減碼Google與萬事達卡 YouTube · 中文
- Tom Russo賣出3.3億美元:為何減碼Google與萬事達卡|投資大師心法 Podcast · 中文