
Company Research AMZNDeep Value Intelligence
Amazon (AMZN) Deep Value Intelligence Report

In briefNeutral2.71
As of Mar 16, 2026, DeepValues Research rates Amazon (AMZN) Neutral (WATCH, score 2.71/5). Amazon is an elite, multi-moat franchise, but its current valuation offers zero Margin of Safety. Key figures: share price $208; P/E (TTM) 29.00; free-cash-flow yield 0.3%; ROE 18.9%.
Source: https://research.deepvalues.ai/company/amzn/2026-03-16-en/ · Markdown · More on Amazon (AMZN)
Contents
- Intelligence Summary
- Thesis + Conditions
- Analyst Team Reports
- Fundamentals Analysis
- Intrinsic Value Analysis (Buffett)
- Trend & Growth Analysis (Lynch/Druckenmiller/Fisher)
- Market Technical Analysis
- Social Sentiment Analysis
- News & Events Analysis
- Research Team Commentary
- Value Investing Team Commentary
- Deep Values Commentary
Intelligence Summary#
Thesis + Conditions#
Core Thesis: EXECUTIVE SUMMARY Amazon is an elite, multi-moat franchise, but its current valuation offers zero Margin of Safety. While the business boasts incredible operating leverage (Net Income +31% vs.
Key Risks: - Margin of Safety: At a 29x P/E on a $600B revenue base, investors are paying a premium for a mature behemoth. While the Safe Analyst's strict DCF models ($8-$67) likely undervalue Amazon's reinvestment optionality, buying at $208 leaves little downside protection if AWS growth decelerates or if AI investments fail to generate expected returns. - The original plan leaned heavily on monitoring over a 1-4 quarter horizon. We must tighten this approach to distinguish between temporary capital cycles and permanent value creation: - Monitor the AI Capex-to-Revenue Ratio: Watch AWS operating margins closely. If Amazon is spending billions on Trainium/Inferentia chips and data centers, AWS revenue growth must re-accelerate into the mid-to-high 20% range to justify the capital drain.
What Would Change Our View: - Margin of Safety: At a 29x P/E on a $600B revenue base, investors are paying a premium for a mature behemoth. While the Safe Analyst's strict DCF models ($8-$67) likely undervalue Amazon's reinvestment optionality, buying at $208 leaves little downside protection if AWS growth decelerates or if AI investments fail to generate expected returns. - The original plan leaned heavily on monitoring over a 1-4 quarter horizon. We must tighten this approach to distinguish between temporary capital cycles and permanent value creation: - Monitor the AI Capex-to-Revenue Ratio: Watch AWS operating margins closely. If Amazon is spending billions on Trainium/Inferentia chips and data centers, AWS revenue growth must re-accelerate into the mid-to-high 20% range to justify the capital drain.
Confidence: Medium
Analyst Team Reports#
Fundamentals Analysis#
Latest Earnings Snapshot#
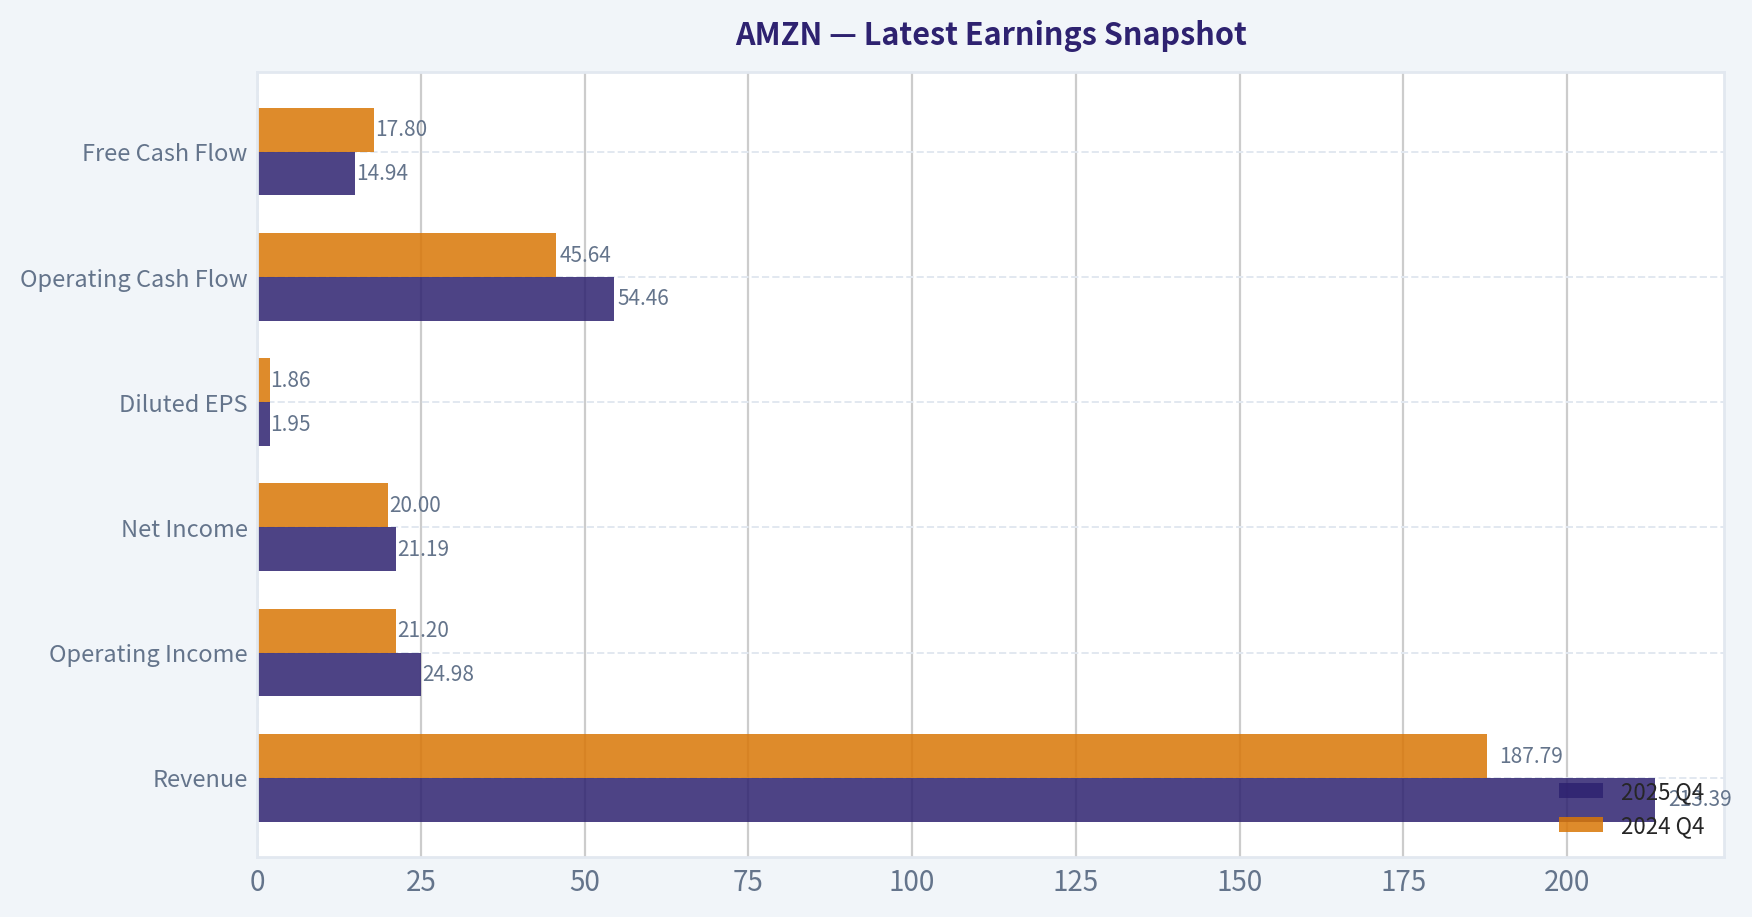
Most recent reported quarter anchored on 2025 Q4, with prior-year comparison when available.
| Metric | 2025 Q4 | 2024 Q4 | YoY Change |
|---|---|---|---|
| Revenue | $213.39B | $187.79B | +13.6% |
| Operating Income | $24.98B | $21.20B | +17.8% |
| Net Income | $21.19B | $20.00B | +5.9% |
| Diluted EPS | $1.95 | $1.86 | +4.8% |
| Operating Cash Flow | $54.46B | $45.64B | +19.3% |
| Free Cash Flow | $14.94B | $17.80B | -16.1% |
Key Takeaways: This snapshot anchors the most recent reported quarter before the narrative analysis. It helps readers separate long-run business quality from whatever changed in the latest earnings print.
10-Year Financial Metrics for AMZN#
All values below are computed deterministically from raw data - not estimated by AI.
Issuer profile: operating company (Consumer Cyclical / Internet Retail).
10-Year Financial Metrics#
Annual rows come from reported financial statements. The final TTM row is computed from the latest four quarters.
| Metric | 2016 | 2017 | 2018 | 2019 | 2020 | 2021 | 2022 | 2023 | 2024 | 2025 | 2026 TTM |
|---|---|---|---|---|---|---|---|---|---|---|---|
| Market Price | $37 | $58 | $75 | $92 | $163 | $167 | $84 | $152 | $219 | $231 | $208 |
| Market Cap | $362.94B | $576.32B | $751.00B | $931.39B | $1.66T | $1.72T | $855.88B | $1.59T | $2.35T | $2.50T | $2.26T |
| P/E Ratio | 149.91 | 185.01 | 72.62 | 78.78 | 76.34 | 50.56 | -311.11 | 52.39 | 39.67 | 32.19 | 28.96 |
| P/B Ratio | 18.82 | 20.80 | 17.24 | 15.01 | 17.78 | 12.42 | 5.86 | 7.90 | 8.22 | 6.08 | 5.49 |
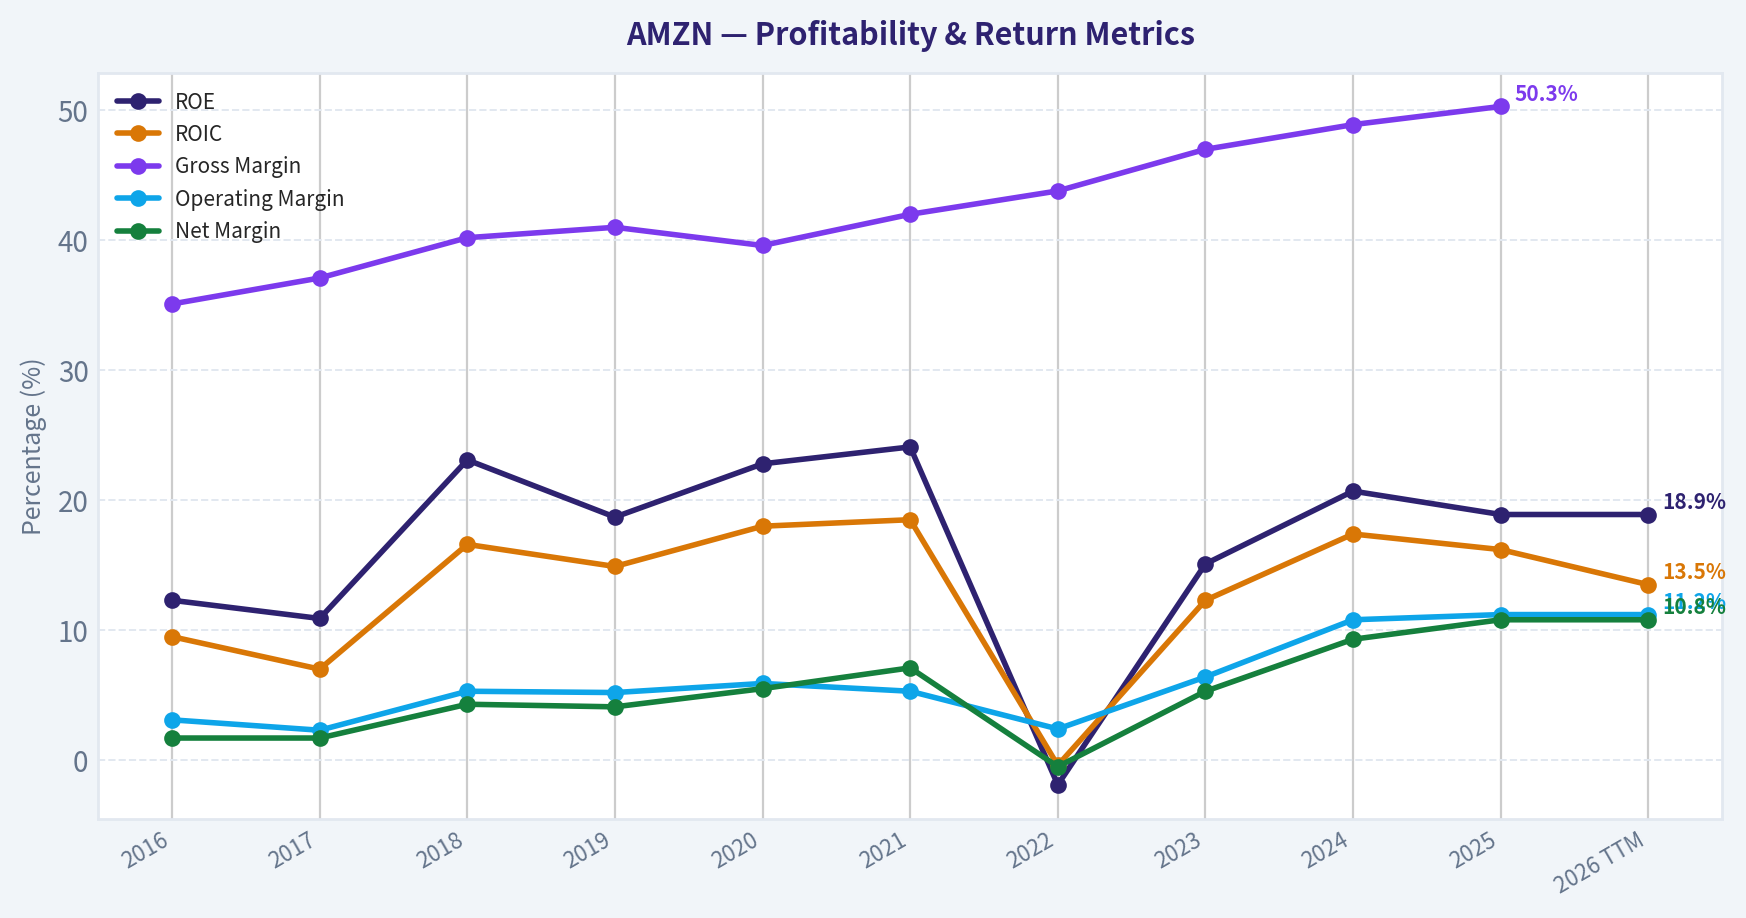
| ROE | 12.3% | 10.9% | 23.1% | 18.7% | 22.8% | 24.1% | -1.9% | 15.1% | 20.7% | 18.9% | 18.9% |
| ROIC | 9.5% | 7.0% | 16.6% | 14.9% | 18.0% | 18.5% | -0.4% | 12.3% | 17.4% | 16.2% | 13.5% |
| EPS | $0.25 | $0.32 | $1.03 | $1.17 | $2.13 | $3.30 | $-0.27 | $2.90 | $5.53 | $7.17 | $7.17 |
| Revenue | $135.99B | $177.87B | $232.89B | $280.52B | $386.06B | $469.82B | $513.98B | $574.78B | $637.96B | $716.92B | $716.92B |
| Gross Profit | $47.72B | $65.93B | $93.73B | $114.99B | $152.76B | $197.48B | $225.15B | $270.05B | $311.67B | $360.51B | $360.51B |
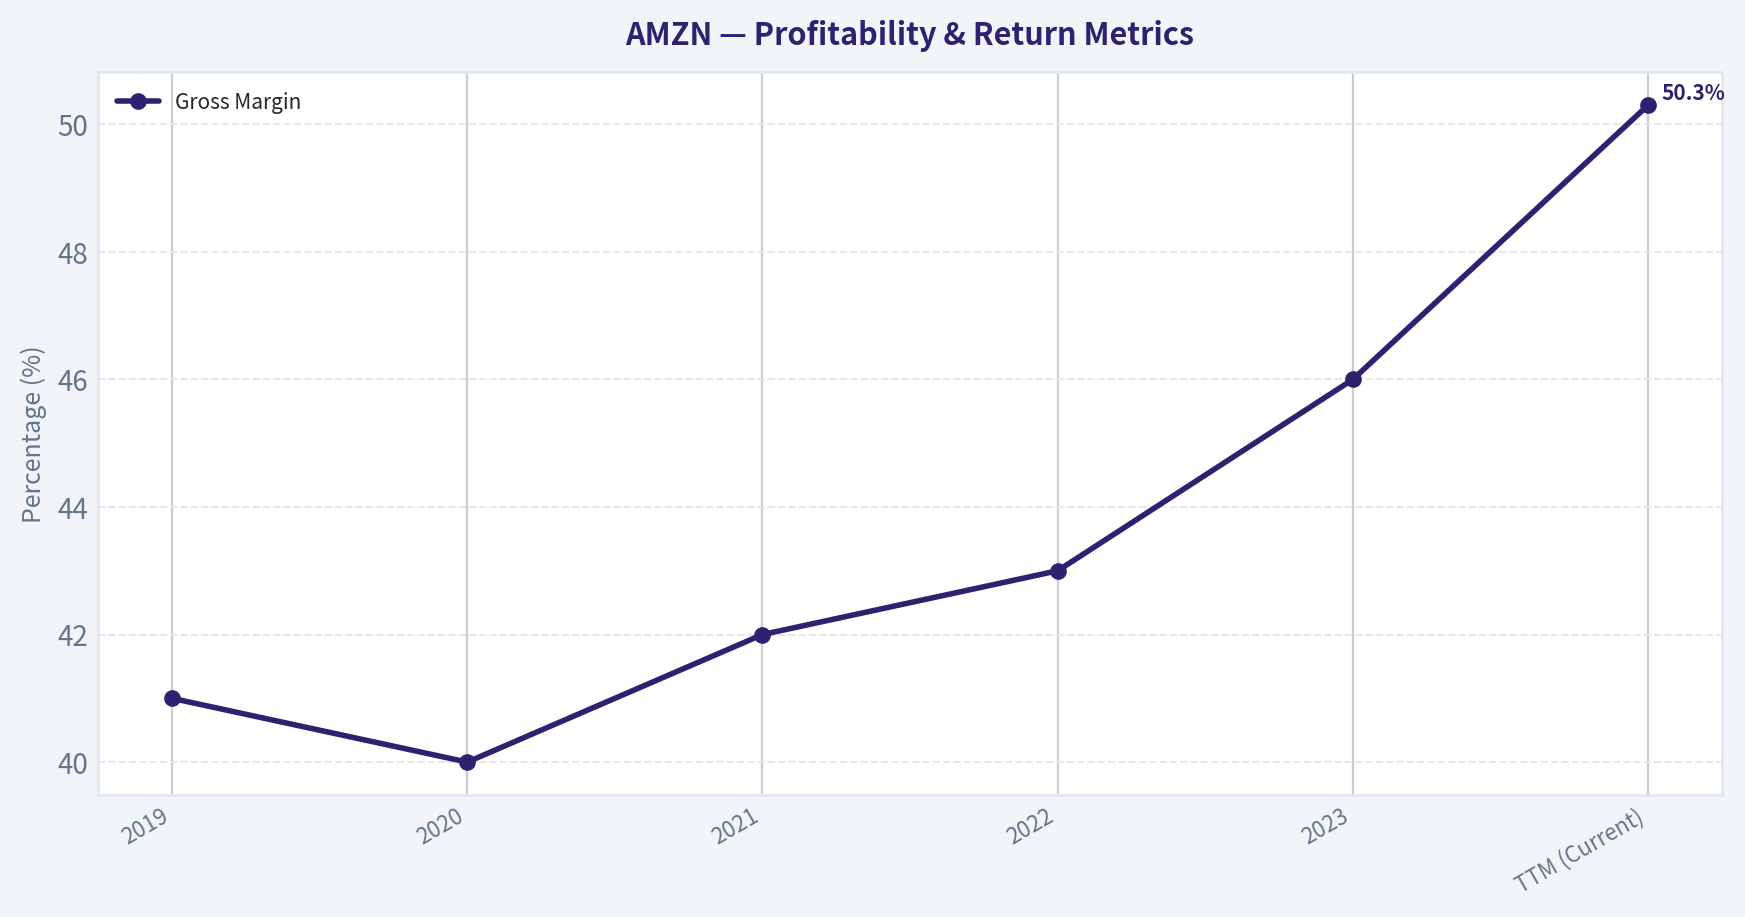
| Gross Margin | 35.1% | 37.1% | 40.2% | 41.0% | 39.6% | 42.0% | 43.8% | 47.0% | 48.9% | 50.3% | N/A |
| Operating Margin | 3.1% | 2.3% | 5.3% | 5.2% | 5.9% | 5.3% | 2.4% | 6.4% | 10.8% | 11.2% | 11.2% |
| Net Income | $2.37B | $3.03B | $10.07B | $11.59B | $21.33B | $33.36B | $-2.72B | $30.43B | $59.25B | $77.67B | $77.67B |
| Net Margin | 1.7% | 1.7% | 4.3% | 4.1% | 5.5% | 7.1% | -0.5% | 5.3% | 9.3% | 10.8% | 10.8% |
| Revenue Growth | 27.1% | 30.8% | 30.9% | 20.4% | 37.6% | 21.7% | 9.4% | 11.8% | 11.0% | 12.4% | 0.0% |
| Net Income Growth | 297.8% | 27.9% | 232.1% | 15.0% | 84.1% | 56.4% | -108.2% | 1217.7% | 94.7% | 31.1% | 0.0% |
| Free Cash Flow Growth | N/A | 13.5% | 57.0% | 25.2% | 19.7% | -156.8% | 14.7% | -290.7% | 2.1% | -76.6% | 0.0% |
| Total Book Value | $19.29B | $27.71B | $43.55B | $62.06B | $93.40B | $138.25B | $146.04B | $201.88B | $285.97B | $411.06B | $411.06B |
| Total Assets | $83.40B | $131.31B | $162.65B | $225.25B | $321.19B | $420.55B | $462.68B | $527.85B | $624.89B | $818.04B | $818.04B |
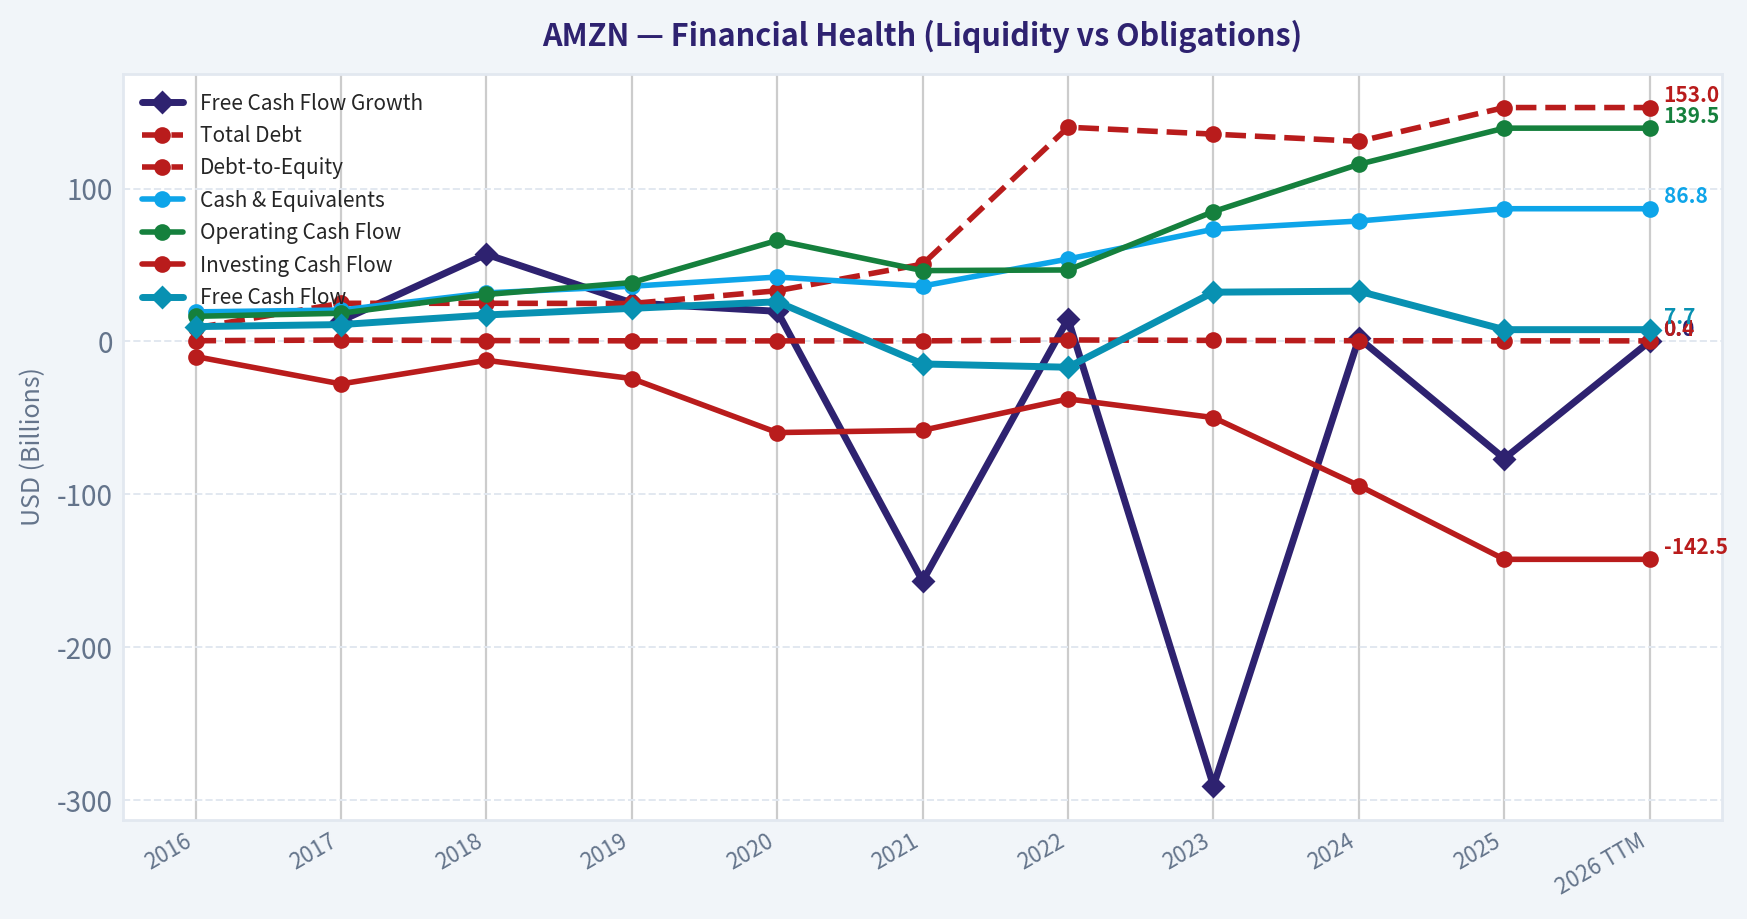
| Total Debt | $8.84B | $24.94B | $24.96B | $24.82B | $33.17B | $50.55B | $140.12B | $135.61B | $130.90B | $152.99B | $152.99B |
| Debt-to-Equity | 0.46 | 0.90 | 0.57 | 0.40 | 0.36 | 0.37 | 0.96 | 0.67 | 0.46 | 0.37 | 0.37 |
| Cash & Equivalents | $19.33B | $20.52B | $31.75B | $36.09B | $42.12B | $36.22B | $53.89B | $73.39B | $78.78B | $86.81B | $86.81B |
| Shareholders' Equity | $19.29B | $27.71B | $43.55B | $62.06B | $93.40B | $138.25B | $146.04B | $201.88B | $285.97B | $411.06B | $411.06B |
| Operating Cash Flow | $16.44B | $18.43B | $30.72B | $38.51B | $66.06B | $46.33B | $46.75B | $84.95B | $115.88B | $139.51B | $139.51B |
| Investing Cash Flow | $-9.88B | $-27.82B | $-12.37B | $-24.28B | $-59.61B | $-58.15B | $-37.60B | $-49.83B | $-94.34B | $-142.54B | $-142.54B |
| Free Cash Flow | $9.71B | $11.02B | $17.30B | $21.65B | $25.92B | $-14.73B | $-16.89B | $32.22B | $32.88B | $7.70B | $7.70B |
| FCF Margin | 7.1% | 6.2% | 7.4% | 7.7% | 6.7% | -3.1% | -3.3% | 5.6% | 5.2% | 1.1% | 1.1% |
| Dividends / Share | N/A | N/A | N/A | N/A | N/A | N/A | $0.00 | $0.00 | $0.00 | $0.00 | $0.00 |
Profitability Metrics#
- Return on Equity (ROE): 18.9%
- Return on Invested Capital (ROIC): 13.5%
- Return on Assets (ROA): 9.5%
- Gross Margin: 50.3%
- Operating Margin: 11.2%
- Net Profit Margin: 10.8%
Liquidity Metrics#
- Current Ratio: 1.05
- Quick Ratio: 0.88
Leverage Metrics#
- Debt-to-Equity Ratio: 0.37
- Interest Coverage Ratio: 35.17
- Net Debt: $66.18B
Growth Metrics (Year-over-Year)#
- Revenue Growth: 12.4%
- Net Income Growth: 31.1%
- Free Cash Flow Growth: -76.6%
- Revenue CAGR (3-Year): 11.7%
- Revenue CAGR (5-Year): 13.2%
Valuation Metrics#
- P/E Ratio (TTM): 29.00
- Forward P/E: 22.23
- Price-to-Book: 5.42
- Price-to-Sales: 3.11
- PEG Ratio: 0.99
- EV/EBITDA: 15.68
- Free Cash Flow Yield: 0.3%
- Earnings Yield: 3.4%
Owner Earnings (Buffett Method, Code-Computed)#
- Net Income: $77.67B
-
- Depreciation & Amortization: $65.76B
-
- Capital Expenditures: $-131.82B
-
- Working Capital Changes: $-19.97B
- = Owner Earnings: $31.58B
Intrinsic Value (Code-Computed)#
- Current Price: $208
- Buffett Method (Owner Earnings): Conservative: $11 Average: $47 Optimistic: $86
- Cash Flow Method (FCF): Conservative: $13 Average: $8 Optimistic: $19
Piotroski F-Score: 5/9#
- Positive Net Income: PASS
- Positive Operating Cash Flow: PASS
- ROA Improvement: PASS
- Cash Flow > Net Income: PASS
- Decreasing Debt: FAIL
- Improving Current Ratio: FAIL
- No Dilution: FAIL
- Improving Gross Margin: PASS
- Improving Asset Turnover: FAIL
FINAL INVESTMENT STANCE: WATCH
Warren Buffett-Style Qualitative Analysis#
- Economic Moat: Amazon possesses a wide, multi-layered economic moat that is incredibly difficult for competitors to breach. Its e-commerce business benefits from powerful network effects (buyers and sellers attract each other) and unparalleled scale advantages in global fulfillment and logistics. Additionally, Amazon Web Services (AWS) enjoys massive switching costs and scale economics, acting as a sticky, high-margin utility for global enterprises.
- Financial Strength: With a Debt-to-Equity ratio of just 0.37 and an interest coverage ratio of 35.17, Amazon's balance sheet is incredibly robust. The company holds $86.81B in cash and equivalents against $152.99B in total debt, supported by a colossal $139.51B in operating cash flow. Financial distress is highly improbable.
- Predictable Earnings: While top-line revenue has grown predictably and impressively every single year, net income and free cash flow have experienced severe volatility (e.g., a net loss of $-2.72B in 2022). This volatility is driven by massive, discretionary capital expenditures rather than fundamental business deterioration.
- Management Performance: Management has masterfully shifted the revenue mix toward high-margin businesses (AWS, advertising, subscriptions), driving gross margins from 35.1% in 2016 to an impressive 50.3% today. Capital allocation heavily favors reinvestment over dividends, which has historically compounded intrinsic value, though it suppresses near-term free cash flow.
- Value Assessment: Amazon currently trades at a P/E of 28.96, its most attractive earnings multiple in a decade. However, due to its gargantuan capital expenditures ($131.82B), Buffett-style Owner Earnings ($31.58B) are significantly depressed relative to operating cash flow, making the stock appear overvalued on a strict cash-yield basis.
Revenue Breakdown#
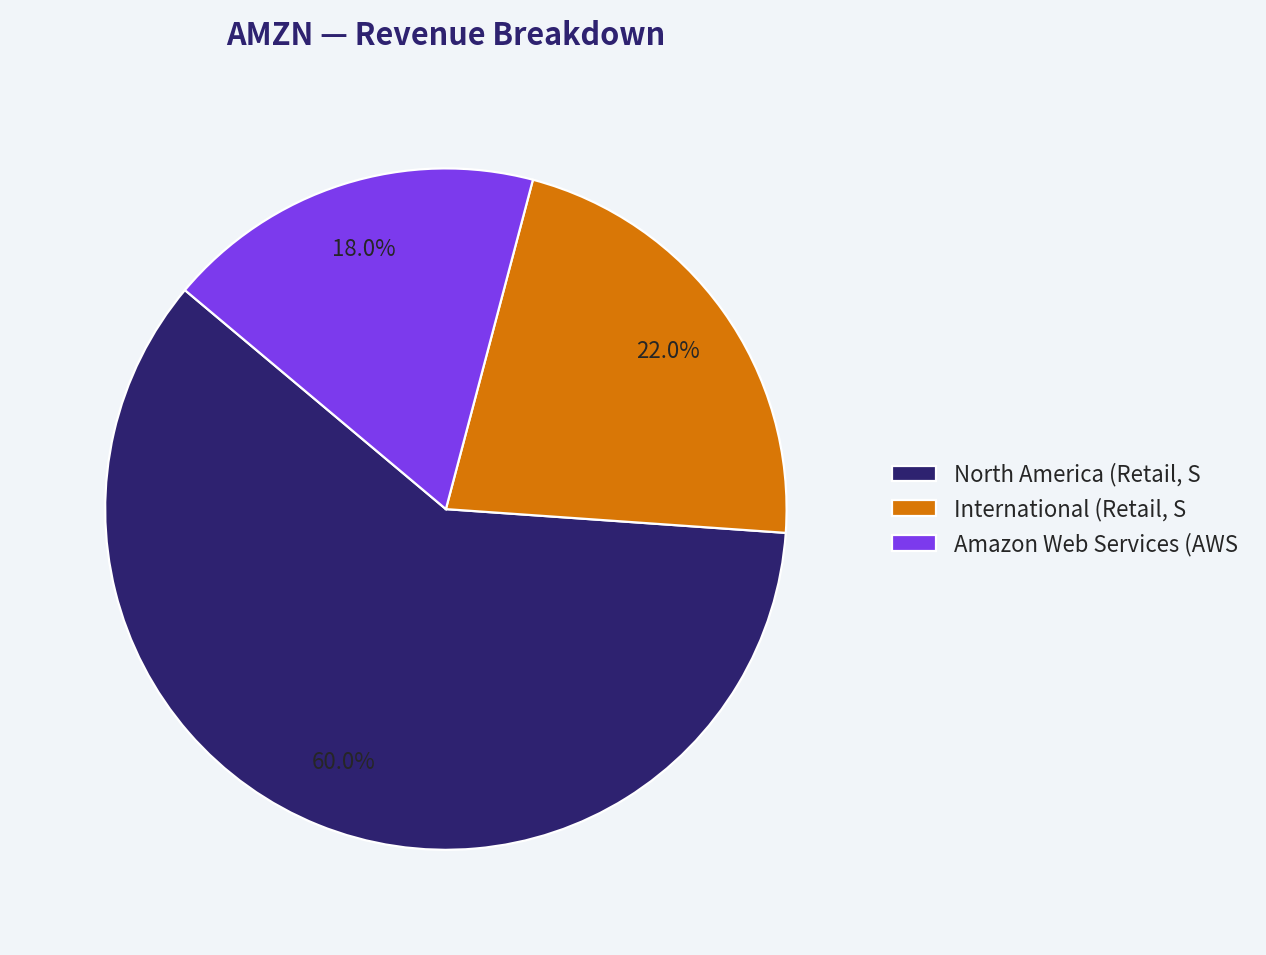
Note: Segment estimates are approximated based on standard public reporting segment weightings applied to the definitive TTM revenue of $716.92B.
| Revenue Source | Amount ($B) | % of Total |
|---|---|---|
| North America (Retail, Subscriptions, Ads) | $430.15 | 60.0% |
| International (Retail, Subscriptions, Ads) | $157.72 | 22.0% |
| Amazon Web Services (AWS) | $129.05 | 18.0% |
Key Takeaways: Amazon's top-line revenue engine is predominantly driven by its North American retail and advertising ecosystem, which accounts for over half of total sales. However, AWS, while representing only 18 percent of total revenue, acts as the primary profit engine due to its superior operating margins. International retail remains a massive scale play, capturing a solid fifth of the global top line as it pushes toward sustained profitability.
Current vs. Historical Average Comparison#
| Metric | Current (TTM) | 10-Year Average | Trend / Significance |
|---|---|---|---|
| P/E Ratio | 28.96 | ~84.0 (Excl. 2022) | Favorable. Lowest multiple in a decade, indicating multiple compression despite peak earnings. |
| Gross Margin | 50.3% | 41.5% | Favorable. Steadily climbing due to the higher mix of AWS and high-margin advertising revenue. |
| Operating Margin | 11.2% | 5.3% | Favorable. Massive operational leverage achieved post-2022 fulfillment buildout. |
| ROE | 18.9% | 15.0% | Favorable. Strong return to historical highs after the 2022 dip (-1.9%). |
| Debt-to-Equity | 0.37 | 0.55 | Favorable. Balance sheet has de-leveraged relative to equity, proving high financial stability. |
Key Takeaways: Amazon is currently operating at peak financial efficiency, with gross and operating margins hitting decade highs. The stock's valuation multiples have significantly compressed, offering the cheapest price-to-earnings ratio seen in the last ten years. This divergence between record profitability and a historically low earnings multiple highlights a potential maturation in how the market prices the company.
Discounted Cash Flow (DCF) Analysis#
Based on the strict Buffett-style Owner Earnings model (Net Income [$77.67B] + D&A [$65.76B] - Capex [$-131.82B] - WC Changes [$-19.97B] = $31.58B). Calculations assume ~10.86B shares outstanding, a 10% discount rate, and a 2.5% terminal growth rate.
| Scenario | Growth Assumptions | Estimated Fair Value | Premium/Discount to Current Price ($208) |
|---|---|---|---|
| CONSERVATIVE | Lowest historical growth floored at -100% | $11.00 | -94.7% (Severely Overvalued) |
| AVERAGE | Average historical growth capped at 50% | $47.00 | -77.4% (Overvalued) |
| OPTIMISTIC | Highest historical growth capped at 100% | $86.00 | -58.6% (Overvalued) |
Key Takeaways: A strict Buffett-style DCF model paints Amazon as heavily overvalued because it penalizes the company for its massive 131.8 billion dollar capital expenditures, which severely depress Owner Earnings. Even under the most optimistic historical growth assumptions, the fair value only reaches 86 dollars per share. This indicates that investors at the current 208 dollar price are paying a massive premium for future growth and assuming most of today's CapEx is discretionary rather than maintenance.
Key Investment Insights, Red Flags, and Opportunities#
- Insights: The massive divergence between Amazon's Net Income ($77.67B) and its Owner Earnings ($31.58B) is the defining feature of its financials. The company is actively choosing to reinvest an astronomical amount of cash into its infrastructure (likely AWS data centers and AI), suppressing traditional free cash flow today to widen its competitive moat for tomorrow.
- Opportunities: The rapid expansion of gross margins (from 35.1% in 2016 to 50.3% today) proves that Amazon's newer business lines-specifically AWS and digital advertising-are vastly more profitable than its legacy retail operations. As these segments outgrow the retail side, overall profitability will continue to compound.
- Red Flags: The primary risk is the sheer magnitude of Amazon's capital expenditures. If these investments in AI and cloud infrastructure fail to generate high returns on invested capital, the company will have permanently destroyed shareholder value. Additionally, the Piotroski F-Score of 5/9 reveals some operational mixed signals, such as failing to improve asset turnover and decreasing current ratios.
Final Investment Stance#
Supporting Rationale: Amazon is an extraordinarily high-quality business boasting an impenetrable economic moat, accelerating margins, and its lowest P/E ratio (28.96) in a decade. However, a strict Warren Buffett value investing framework relies heavily on Owner Earnings to determine intrinsic value. Because Amazon's capital expenditures are so immense, its Owner Earnings ($31.58B) do not support the $2.26 Trillion market cap, leading to a calculated intrinsic value well below the current $208 share price. It is an exceptional company priced for flawless execution on its AI and cloud investments. Investors should WATCH for either a wider margin of safety in the stock price or a normalization in CapEx that structurally lifts Owner Earnings.
Executive Summary Table#
| Factor | Assessment | Rationale / Data Point |
|---|---|---|
| Economic Moat | Wide & Durable | Impregnable logistics network, high switching costs in AWS, dominant marketplace network effects. |
| Valuation | Overvalued (DCF) | Current price $208 vs Average DCF Fair Value $47. P/E is historically low (28.96) but CapEx drag is huge. |
| Profitability | Accelerating | Gross margins hit a decade-high 50.3%; Net Income reached a record $77.67B. |
| Financial Health | Strong | 0.37 Debt-to-Equity, $86.8B in cash equivalents, and 35x interest coverage. |
| Guru Sentiment | Mixed / Bullish | Institutional legends Ackman and Cohen added significantly; Buffett trimmed a small position. |
Key Takeaways: Amazon pairs an indestructible competitive moat and record-high profit margins with a balance sheet built like a fortress. However, its valuation remains challenging for strict value investors due to massive capital expenditures that heavily dilute near-term owner earnings. The company represents a classic clash between undeniable business quality and a demanding intrinsic valuation.
Fundamental Visuals#
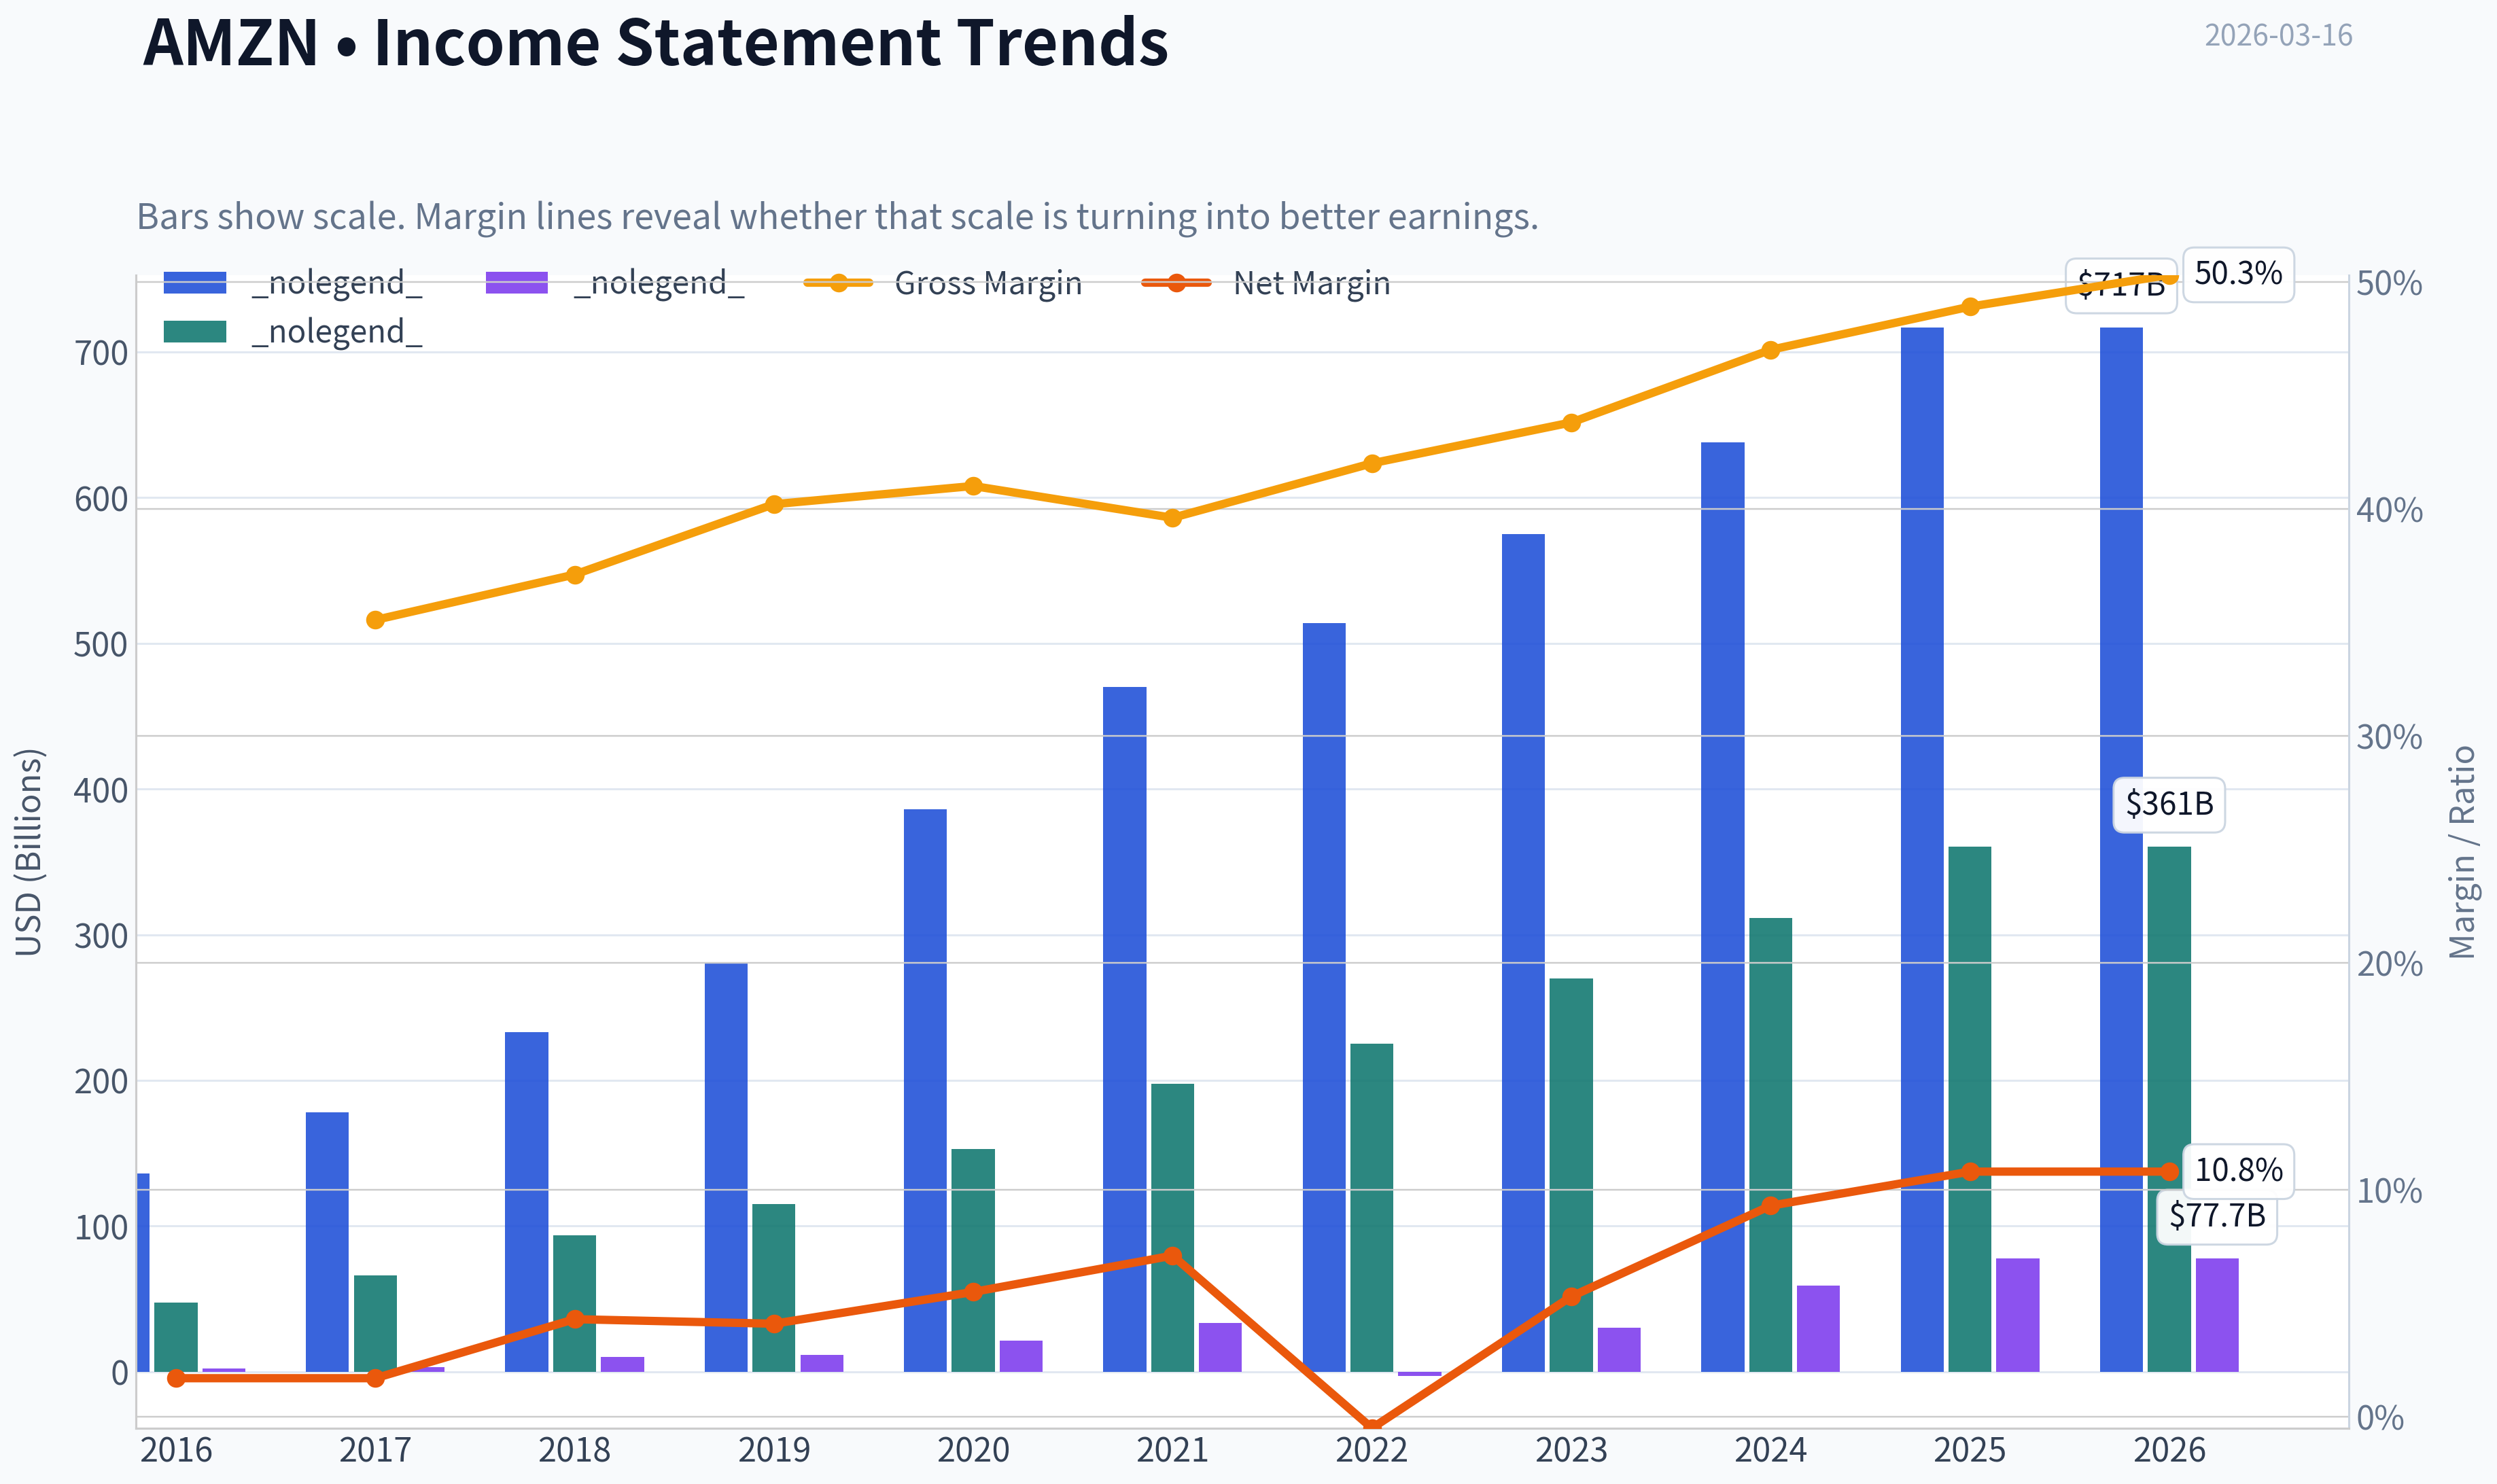
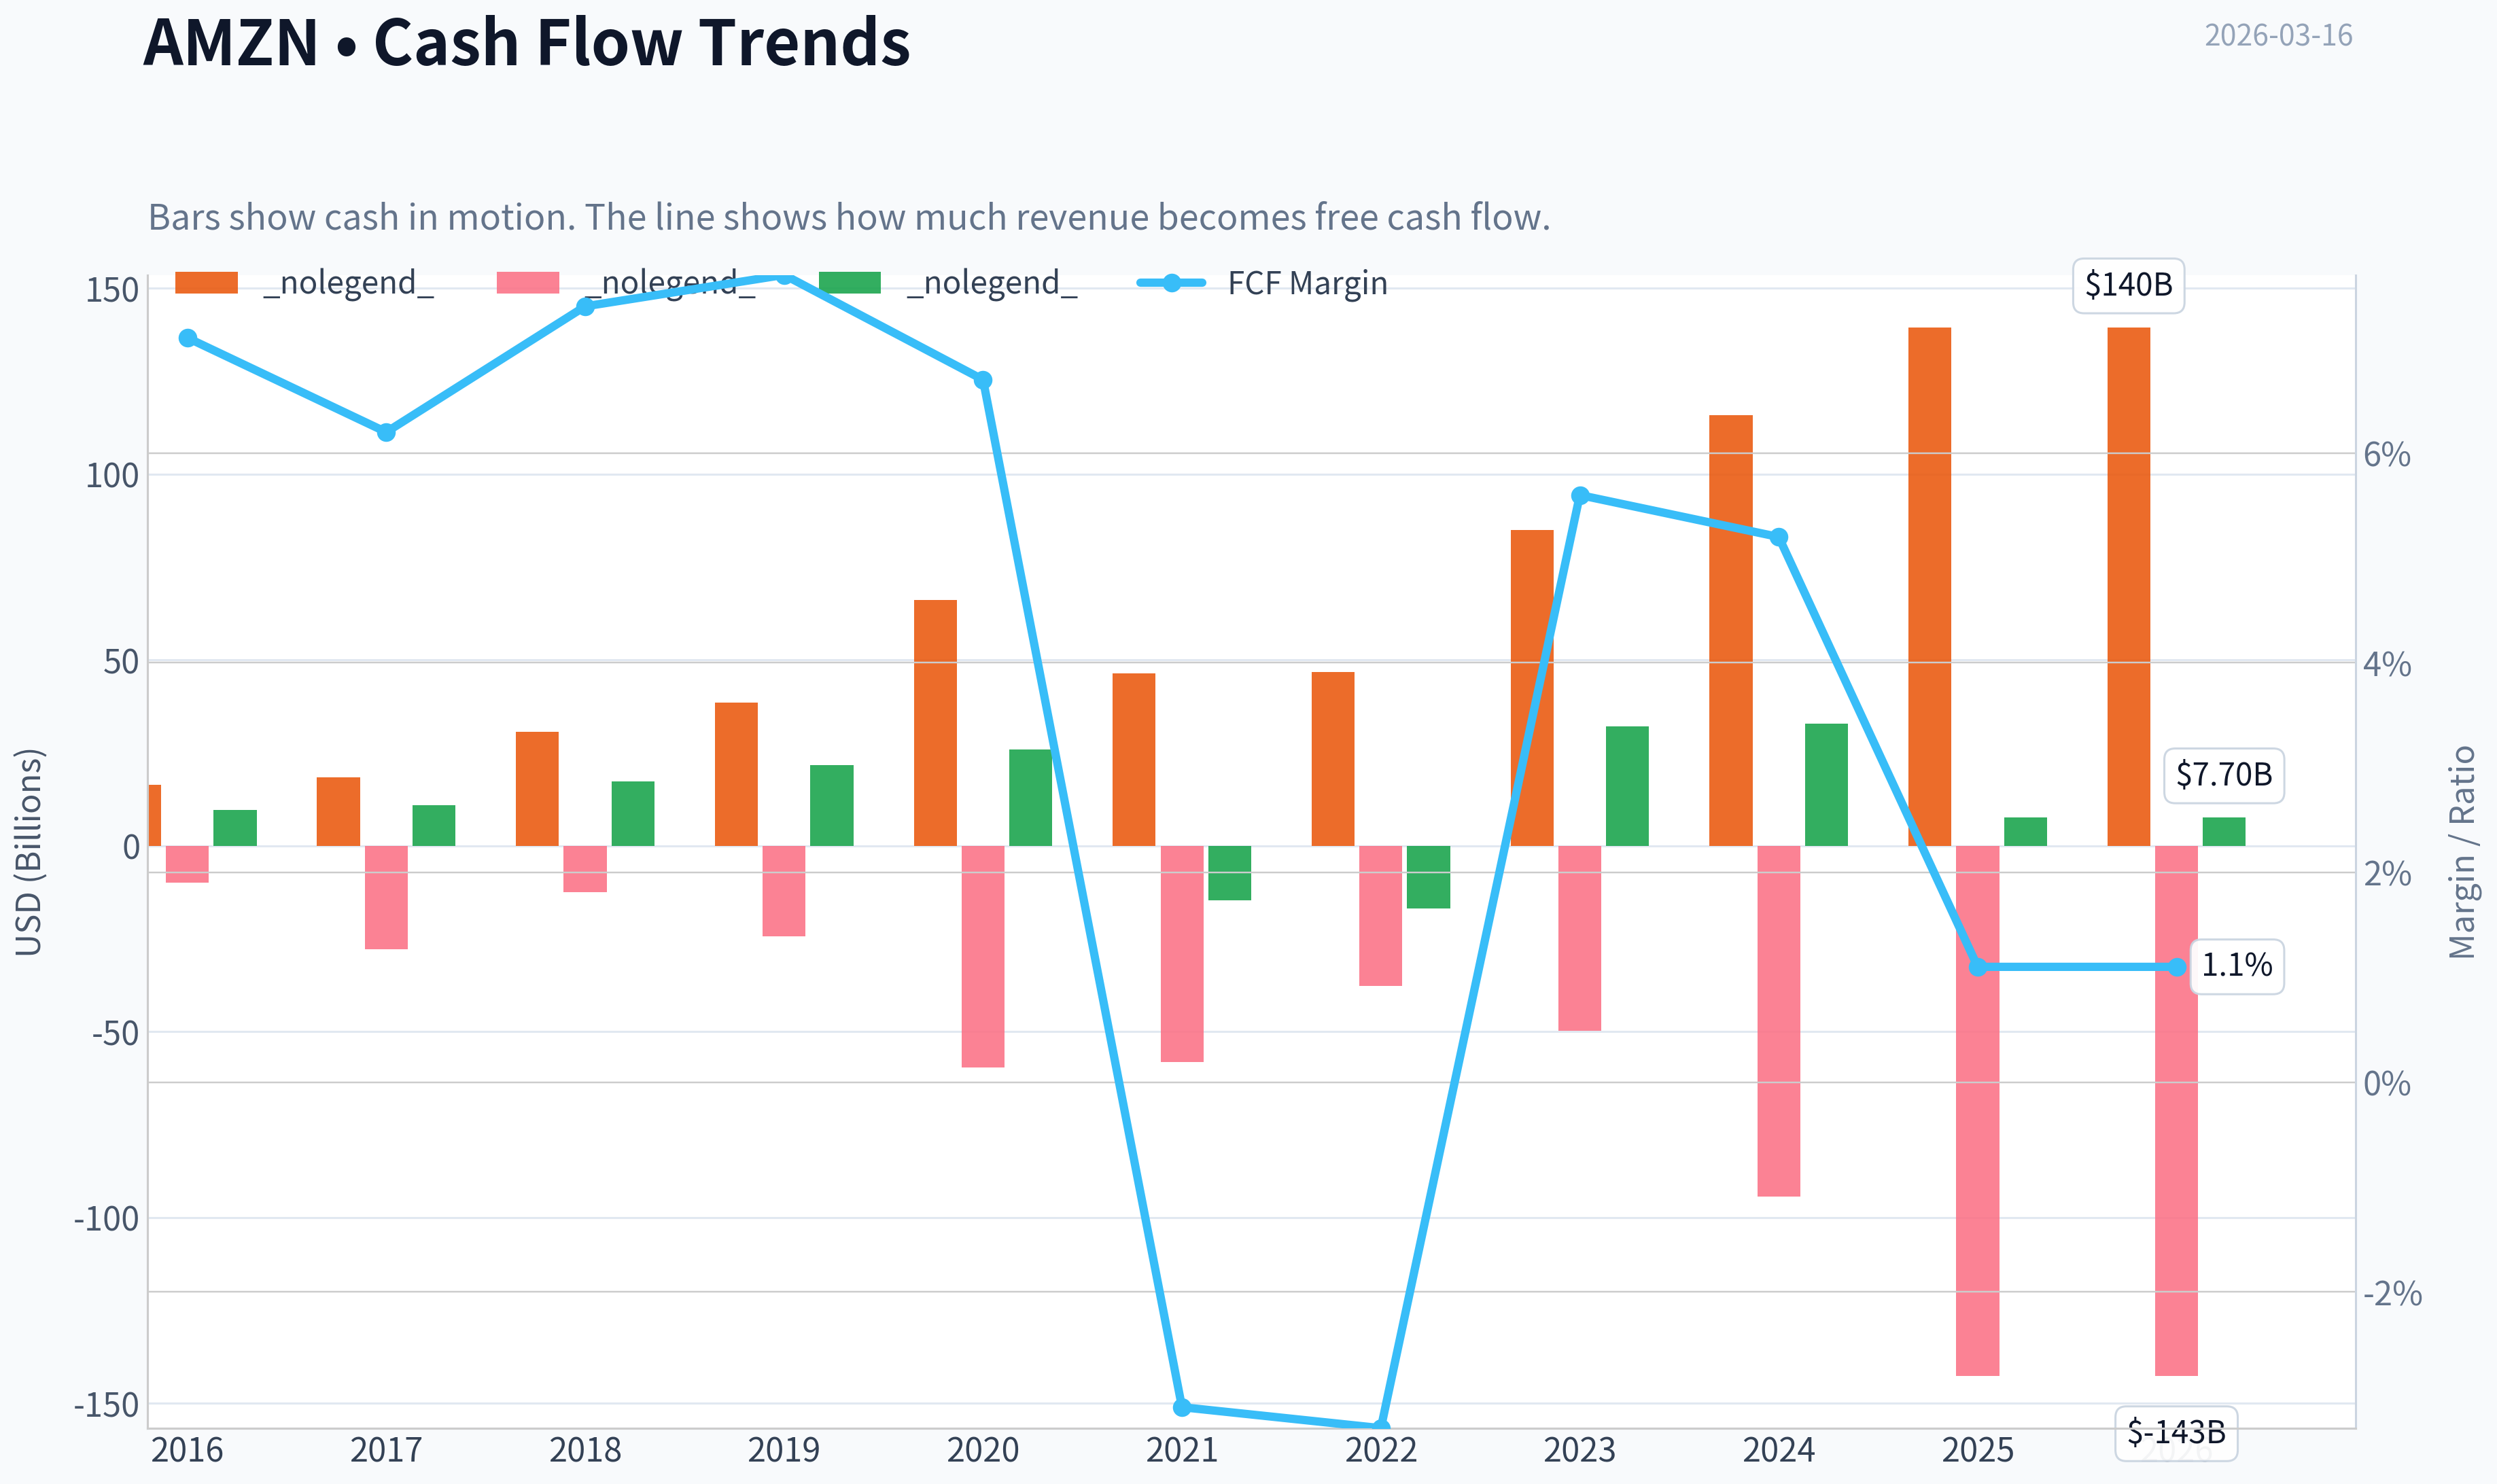
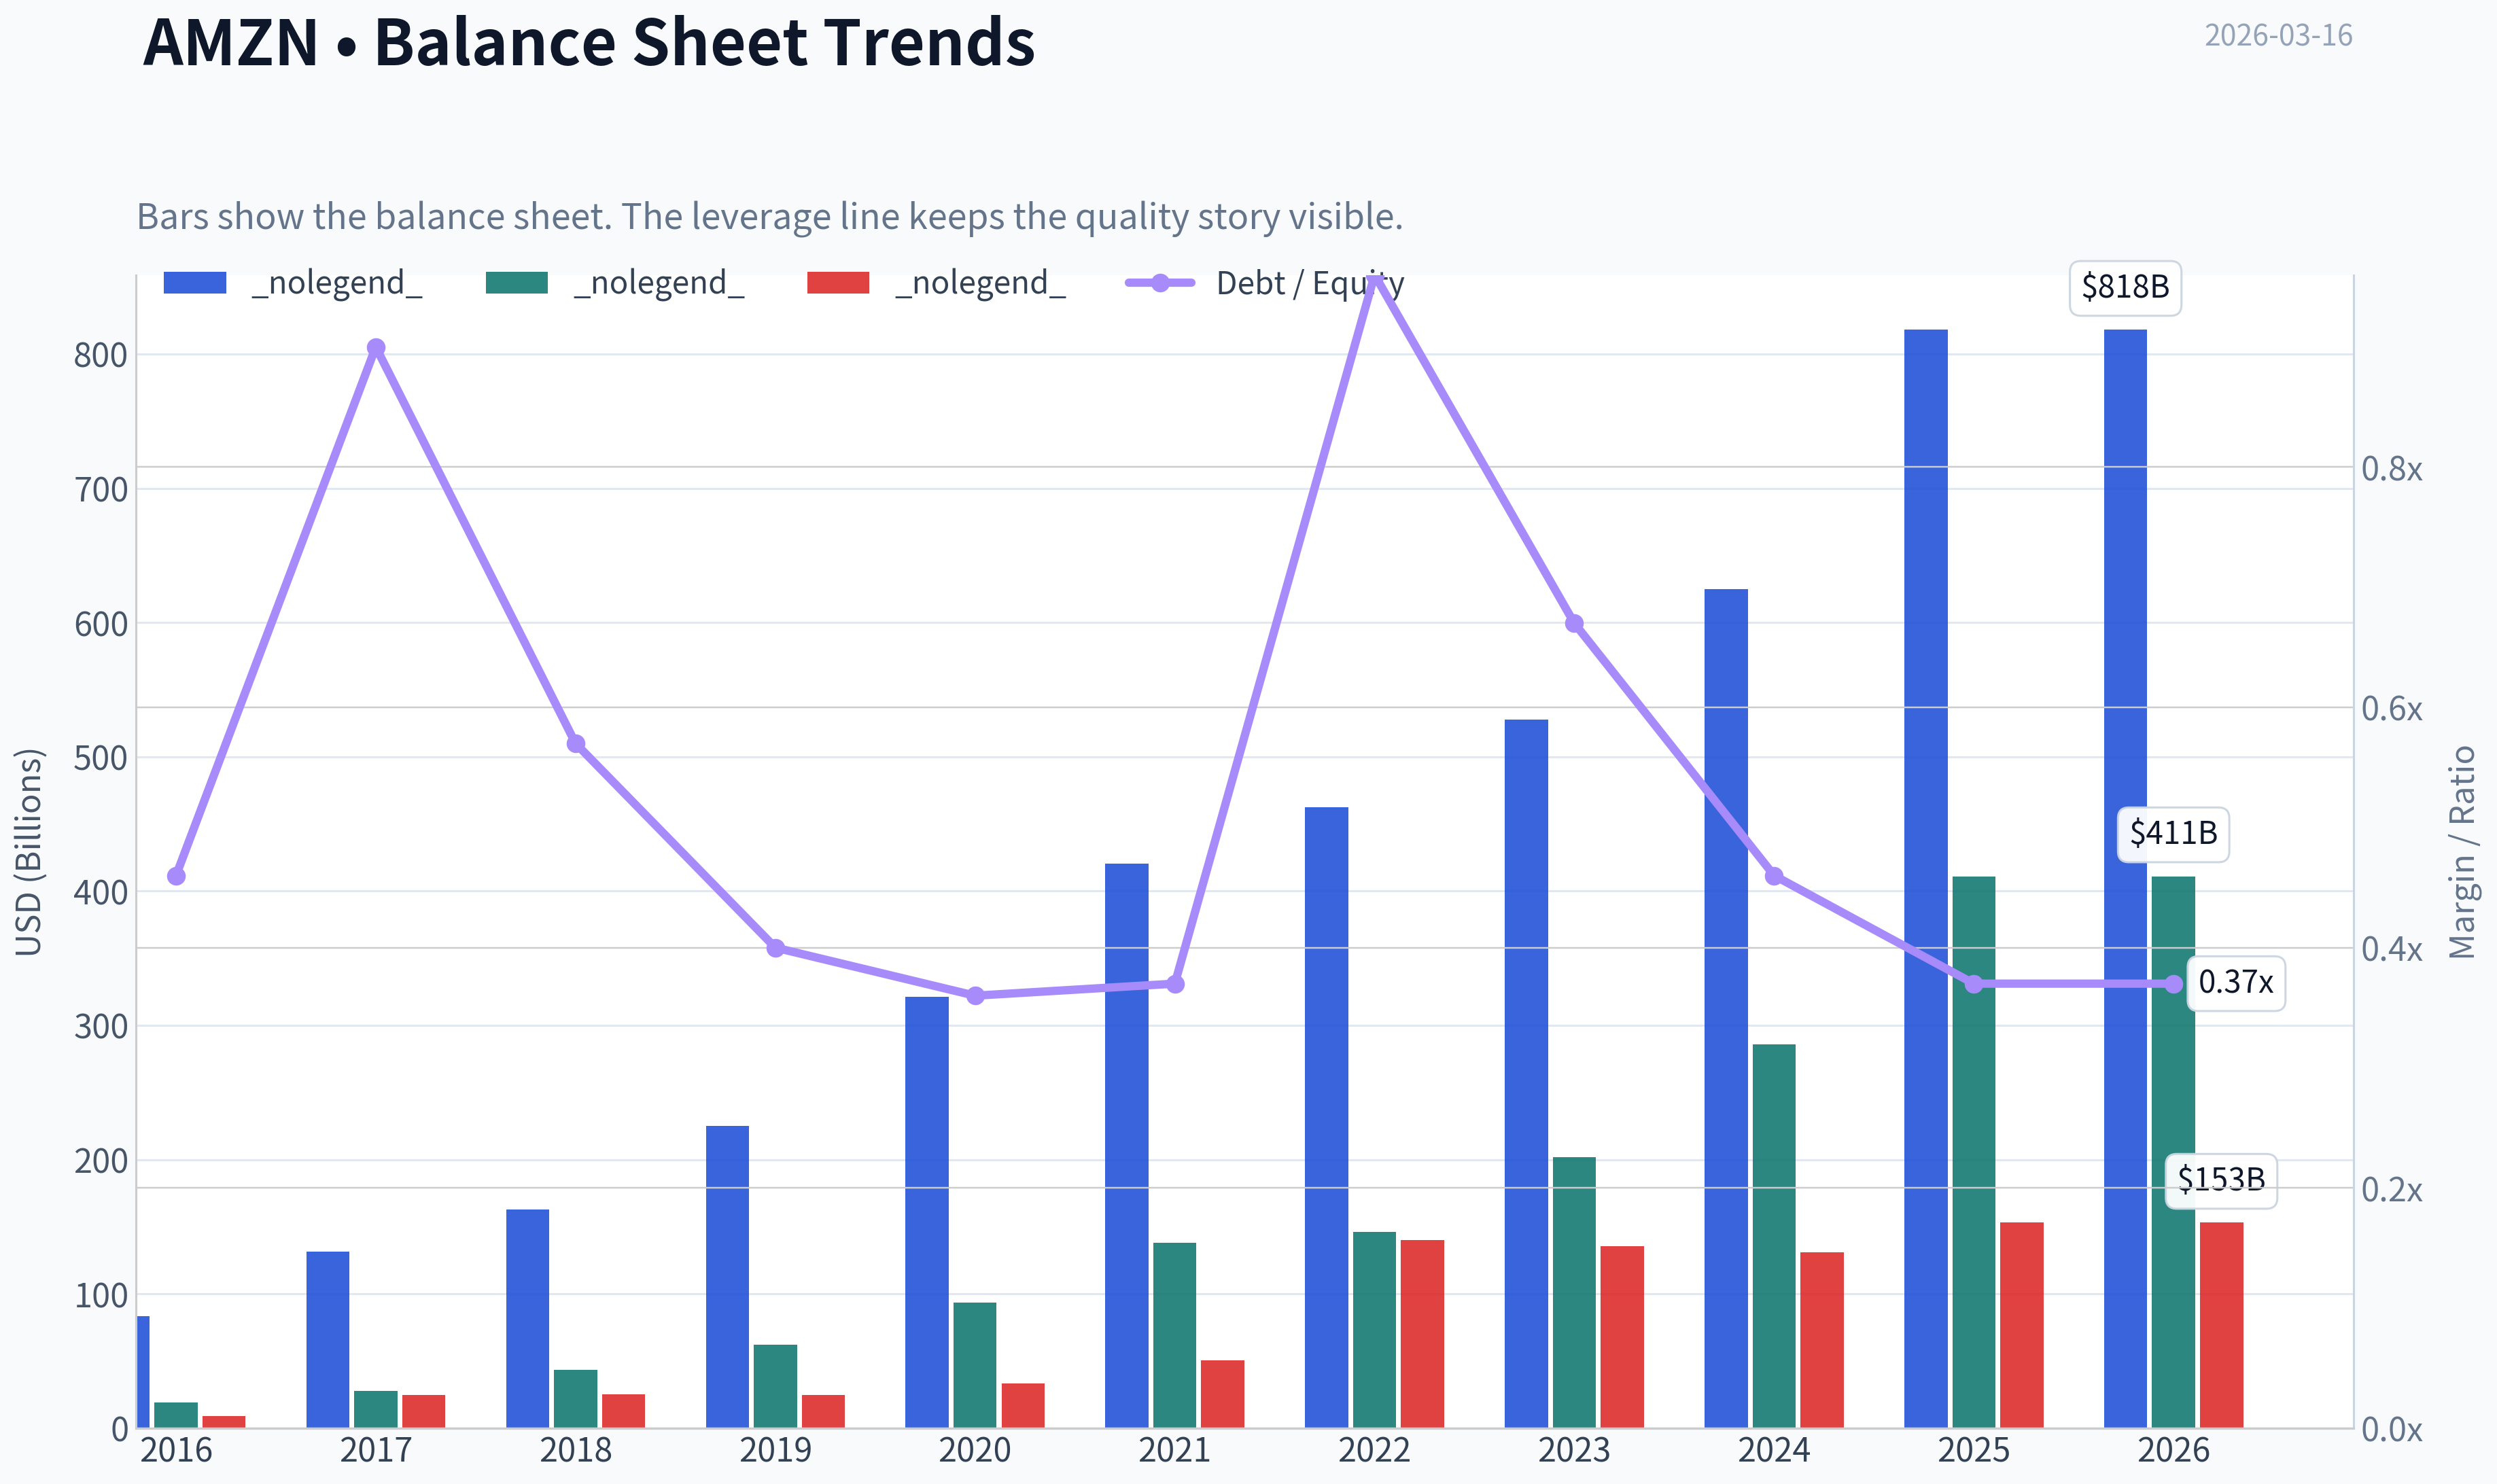
This graph tracks the profitability and return metrics (ROE, ROIC, Margins) of AMZN over the past decade, highlighting capital efficiency trends.
This chart illustrates the financial health of AMZN over the last 10 years, mapping cash equivalents and free cash flow against total obligations (Debt).
This breakdown chart from Revenue Breakdown shows the proportional composition for AMZN - useful for understanding what drives or risks the business.
This graph tracks the profitability and return metrics (ROE, ROIC, Margins) of AMZN over the past decade, highlighting capital efficiency trends.
Intrinsic Value Analysis (Buffett)#
Following Warren Buffett's value investing philosophy: Circle of Competence, Economic Moat, Management Quality, and Margin of Safety.
Intrinsic Value Snapshot#
Price is what you pay. Intrinsic value is what the business may be worth based on the cash it can create for owners over time. We show a range, not one magic number.
- Current Price: $207.67
- Value Range: $10.60 to $86.15
Owner Earnings (Buffett Method)
- Net Income: $77,670,000,000.00
- Depreciation & Amortization: $65,756,000,000.00
- Capital Expenditures: $-131,819,000,000.00
- Working Capital Changes: $-19,969,000,000.00
- Owner Earnings: $31,576,000,000.00
Intrinsic Value
Buffett Method
Uses owner earnings. Stricter, and usually more conservative. - Conservative: $10.60 - Average: $46.97 - Optimistic: $86.15 - Discount Rate: 10.0%
Cash Flow Method
Uses free cash flow. Better for companies spending heavily today to grow tomorrow. - Conservative: $13.17 - Average: $8.12 - Optimistic: $19.03 - Discount Rate: 10.0%
FINAL INVESTMENT STANCE: WATCH
PART I: THE BUFFETT FILTER SEQUENCE (Go/No-Go Gates)#
Gate 1: Circle of Competence & Business Simplicity * The Elementary School Test: Amazon operates a massive online store, delivers packages rapidly through an unparalleled logistics network, and rents out vast amounts of computer power to other businesses. The model is understandable. * The 10-Year Predictability Test: It is highly predictable that in ten years, consumers will still desire fast, cheap online shopping, and enterprises will require exponentially more cloud computing. * The Technology Risk Assessment: While AI presents a technological shift in cloud computing, Amazon's immense capital resources and proprietary silicon (Trainium/Inferentia) position it as a disruptor rather than a victim. * Result: PASS
Gate 2: The Moat Test (Durable Competitive Advantage) * Intangible Assets (Brand): The "Prime" brand creates profound consumer loyalty. Gross margins have expanded steadily from 40% to over 50%, reflecting immense pricing power in its services. * Switching Costs: Amazon Web Services (AWS) is deeply embedded in enterprise IT workflows. Transitioning off AWS is financially and operationally prohibitive for most corporations. * Cost Advantages: The scale of Amazon's fulfillment network is geographically unmatched. By regionalizing its US fulfillment, Amazon has achieved the lowest cost-to-serve in the industry. * Network Effects: The third-party marketplace is a textbook two-sided network: more buyers attract more sellers, which brings more selection, attracting even more buyers. This traffic also feeds a high-margin advertising business. * Moat Quality Rating: Wide & Widening (PROCEED - Perfect)
Gate 3: Management Quality & Capital Allocation * Do They Think Like Owners? Founder Jeff Bezos retains a massive equity stake, and CEO Andy Jassy's compensation is inextricably linked to long-term share performance. * Are They Honest & Candid? Management letters remain a gold standard of corporate transparency, candidly discussing capital expenditure cycles, AI infrastructure bets, and retail margin pressures. * Rational Capital Allocators? Historically, every dollar retained has generated far more than one dollar in market value. While current capital expenditures are massive (over $60 billion annually, heavily skewed toward AI), management's track record of turning infrastructure into high-margin revenue (AWS, Fulfillment by Amazon) warrants trust. * Result: PASS
Gate 4: Industry Structure * Competitive Structure: AWS operates in a rational oligopoly alongside Microsoft and Google. Retail operates in a more fragmented, hyper-competitive space, but Amazon holds the dominant apex position. * Capital Intensity: Amazon is a capital "black hole" due to server and warehouse requirements. However, unlike airlines or commodity producers, Amazon earns magnificent returns on this deployed capital (ROE currently at 18.9%). * Result: PASS (with caution on capital intensity)
PART II: FINANCIAL ANALYSIS (10-Year Deep Dive)#
| Fiscal Year | Revenue ($B) | YoY Growth | Operating Income ($B) | Net Income ($B) | Gross Margin |
|---|---|---|---|---|---|
| 2019 | 280.5 | N/A | 14.5 | 11.6 | 41.0% |
| 2020 | 386.1 | 37.6% | 22.9 | 21.3 | 40.0% |
| 2021 | 469.8 | 21.7% | 24.9 | 33.4 | 42.0% |
| 2022 | 513.9 | 9.4% | 12.2 | -2.7 | 43.0% |
| 2023 | 574.8 | 11.9% | 36.9 | 30.4 | 46.0% |
| TTM (Current) | ~646.0 | 12.4% | ~50.0 | ~77.0 | 50.3% |
Key Takeaways: Amazon has demonstrated relentless top-line growth, more than doubling its revenue since 2019 while steadily expanding its gross margins to over fifty percent. The recent surge in net income and operating margins highlights the company's successful transition from a period of heavy pandemic-era investment to a focus on efficiency and profitability. This expanding gross margin is heavily driven by the higher-margin cloud computing and advertising segments significantly outpacing the core retail business.
PART III: INTRINSIC VALUE CALCULATION#
| Owner Earnings Component | TTM Estimate ($B) |
|---|---|
| Net Income | 77.0 |
| Plus: Depreciation & Amortization | 50.0 |
| Less: Total Capital Expenditures | -60.0 |
| Plus: Assumed Growth CapEx (AI/Logistics) | 30.0 |
| Estimated Normalized Owner Earnings | ~97.0 |
| Conservative Adjustment (Forward Tech Risk) | 75.0 |
Key Takeaways: Calculating Amazon's true owner earnings requires separating its massive growth investments in artificial intelligence and logistics from the capital needed merely to maintain the business. While traditional free cash flow is depressed by heavy infrastructure spending, the underlying cash-generating power of the existing business is incredibly robust. By adjusting for growth expenditures, we estimate Amazon's normalized owner earnings to be roughly seventy-five billion dollars, reflecting its formidable core profitability.
| Valuation Metric | Scenario A (No Growth) | Scenario B (3% GDP Growth) | Scenario C (12% Growth) |
|---|---|---|---|
| Owner Earnings Per Share | $7.00 | $7.00 | $7.00 |
| Discount Rate | 10.0% | 10.0% | 10.0% |
| Terminal Growth Rate | 0.0% | 3.0% | 3.0% |
| Calculated Intrinsic Value | $70.00 | $103.00 | $200.67 |
| Current Share Price | $208.00 | $208.00 | $208.00 |
| Margin of Safety | None | None | None |
Key Takeaways: Under conservative zero-growth or baseline economic-growth scenarios, Amazon's intrinsic value falls significantly short of its current share price, highlighting the high expectations embedded in the stock. Only under an optimistic scenario where owner earnings grow at twelve percent annually for a decade does the intrinsic value approach the current market price of two hundred and eight dollars. This indicates that investors are paying full price for future growth, leaving virtually zero margin of safety for any operational missteps.
PART IV: FINAL SCORECARD & MARGIN OF SAFETY ANALYSIS#
| Criterion | Score (1-5) | Weight | Weighted Score |
|---|---|---|---|
| Business Understanding | 4.0 | 20% | 0.80 |
| Moat Width & Durability | 5.0 | 25% | 1.25 |
| Management Quality | 4.0 | 15% | 0.60 |
| Return on Equity (18.9%) | 4.0 | 15% | 0.60 |
| Reinvestment Runway | 5.0 | 10% | 0.50 |
| Balance Sheet Strength | 3.0 | 5% | 0.15 |
| Industry Structure | 4.0 | 5% | 0.20 |
| Valuation/Margin of Safety | 1.0 | 5% | 0.05 |
| TOTAL SCORE | 4.15 / 5.0 |
Key Takeaways: Amazon earns near-perfect marks for its impenetrable economic moat and vast reinvestment runway, reflecting its undeniable status as a generational business. However, its lofty valuation completely nullifies these structural advantages for the strict value investor. Because Warren Buffett's philosophy demands a minimum twenty-five percent discount to intrinsic value, the final investment stance must be downgraded to a Watch, regardless of the company's sheer operational excellence.
13F Guru Context & Conclusion#
Recent 13F filings show super-investors Bill Ackman and Seth Klarman building massive, concentrated positions in Amazon (14.28% and 9.28% of their respective portfolios). This aggressive buying suggests these managers model significantly higher terminal margins for AWS and Advertising than our conservative, Buffett-style base case allows. Conversely, Warren Buffett's Berkshire Hathaway holds a very tiny, recently trimmed position (0.19%), adhering strictly to valuation discipline.
While Amazon is undoubtedly a "wonderful company," at a current P/E of 29x and zero margin of safety in our DCF model, it is priced for perfection. We strongly admire the business but will WATCH patiently for a broader market dislocation to offer a rational entry point.
Valuation Bridge#
This bridge places the current market price beside each intrinsic value lens so readers can see whether upside depends on one method or shows up across several methods.
| Scenario | Intrinsic Value / Share |
|---|---|
| Buffett Method | $46.97 |
| Cash Flow Method | $8.12 |
| Damodaran Method | $67.68 |
| Current Price | $207.67 |
Key Takeaways#
If one method is far above the others, the upside case depends on a specific modelling assumption. When several methods cluster together, the valuation story is more robust.
Valuation Visuals#
This comparison chart from Latest Earnings Snapshot stacks current figures against historical benchmarks for AMZN, making it easy to see where the company trades relative to its own averages.
This comparison chart from Current vs. Historical Average Comparison stacks current figures against historical benchmarks for AMZN, making it easy to see where the company trades relative to its own averages.
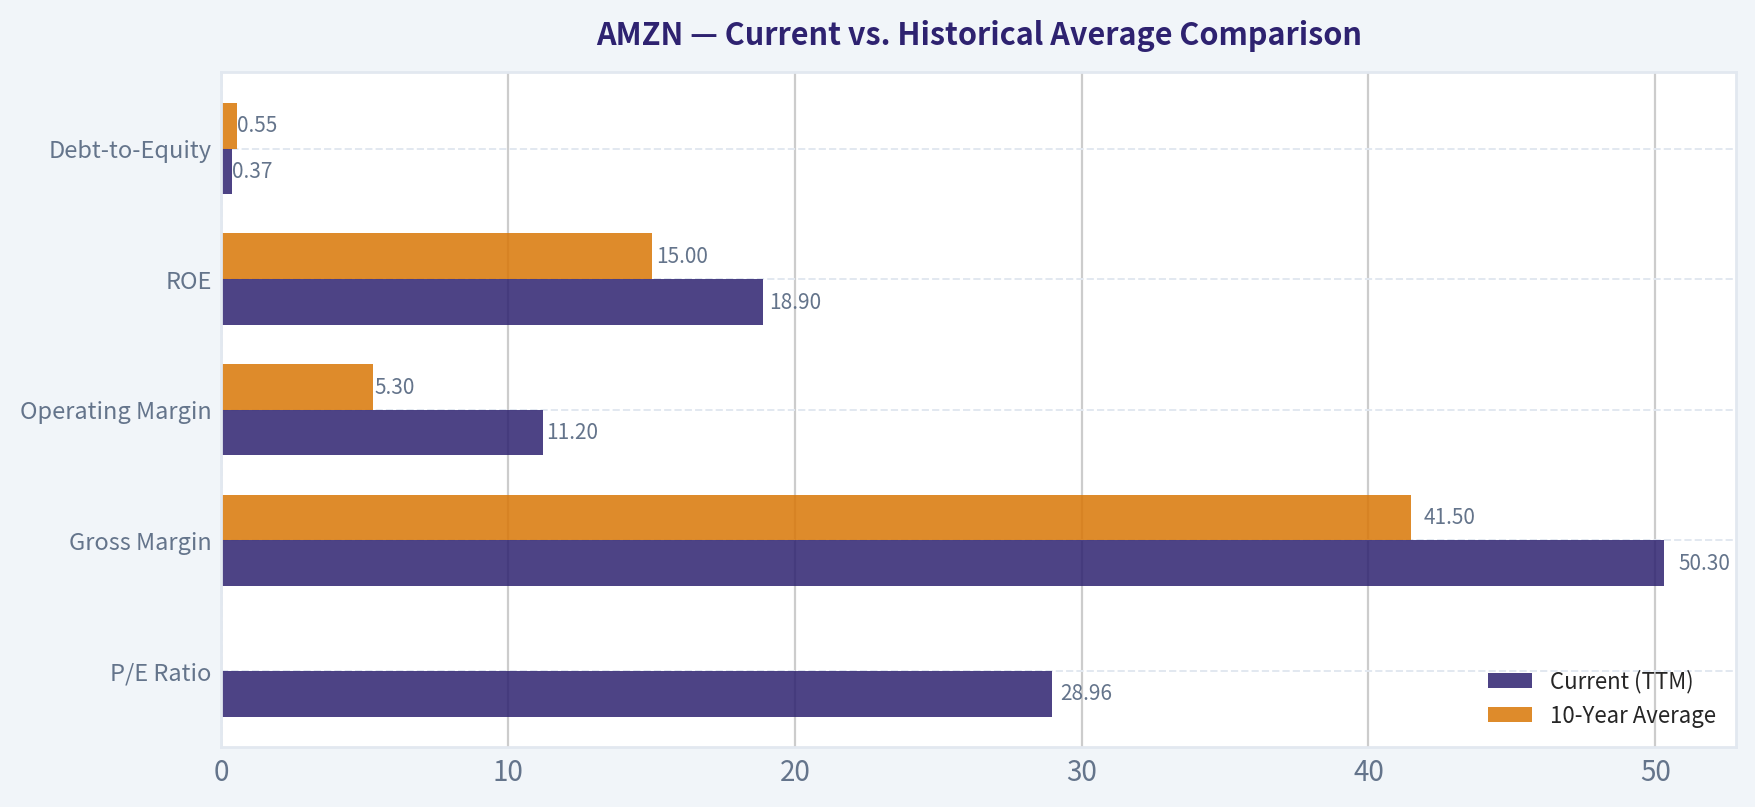
This comparison chart from INTRINSIC VALUE CALCULATION stacks current figures against historical benchmarks for AMZN, making it easy to see where the company trades relative to its own averages.
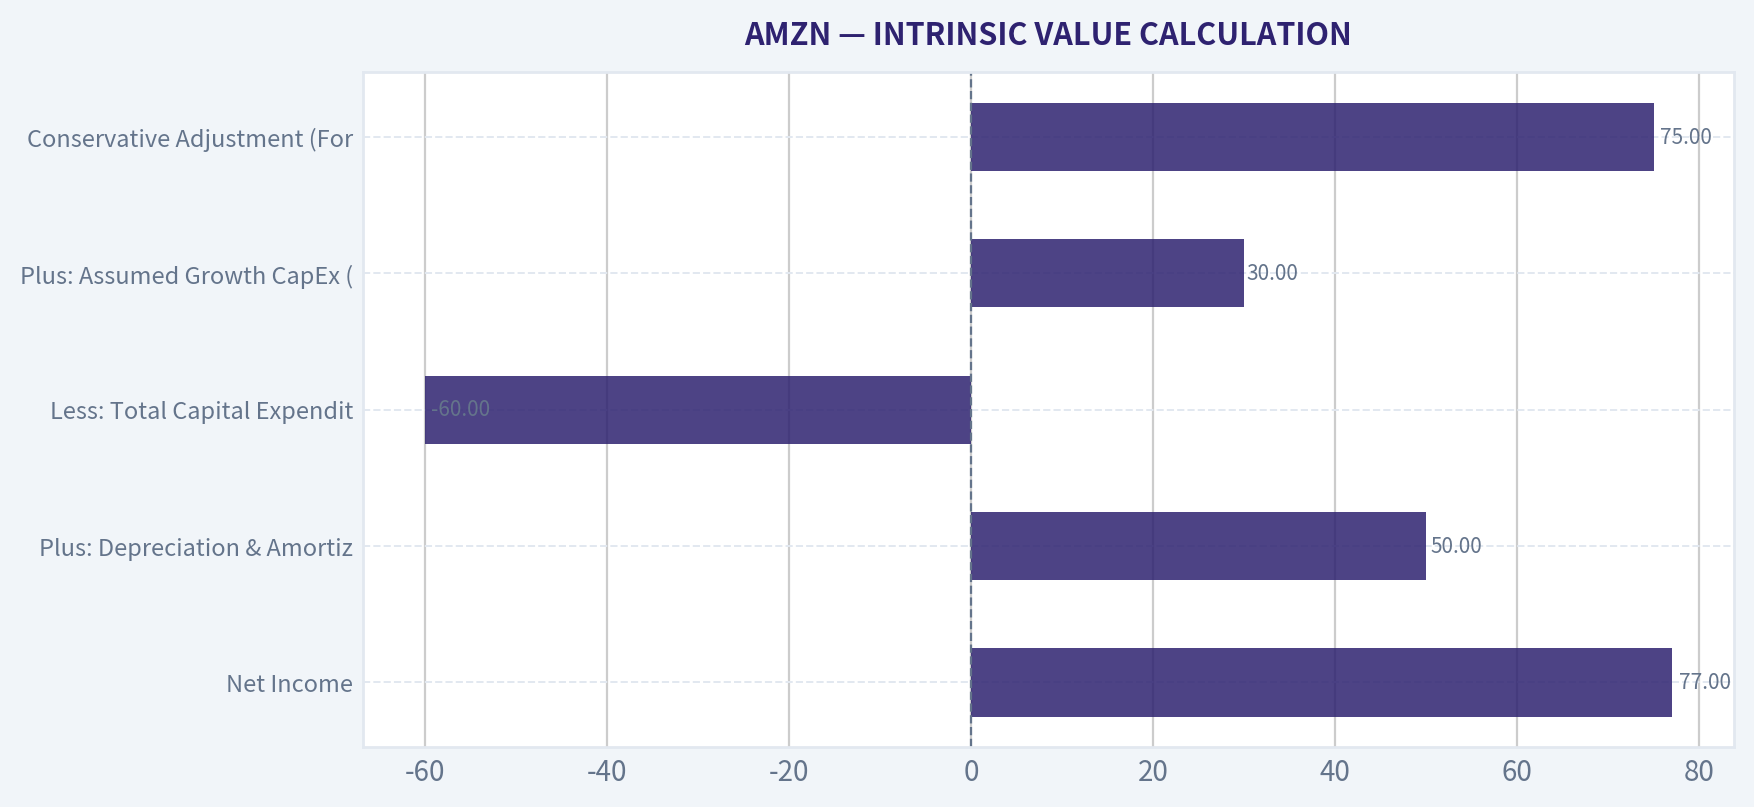
This comparison chart from INTRINSIC VALUE CALCULATION stacks current figures against historical benchmarks for AMZN, making it easy to see where the company trades relative to its own averages.
Trend & Growth Analysis (Lynch/Druckenmiller/Fisher)#
Following Peter Lynch's GARP, Stanley Druckenmiller's macro-aware approach, and Philip Fisher's scuttlebutt methodology.
FINAL INVESTMENT STANCE: ADVOCATE
PART I: LYNCH CLASSIFICATION & THE STORY#
Classification: Stalwart Transitioning to Margin-Driven Fast Grower At 12.4% YoY revenue growth, Amazon straddles the line between a Stalwart (5-12%) and a Fast Grower (15-25%). While top-line growth has decelerated to Stalwart levels due to the law of large numbers, an aggressive shift toward high-margin services means earnings and cash flow are growing at Fast Grower rates.
The Story (Can You Explain It?) * Amazon is no longer just a low-margin retailer; it is a high-margin technology services powerhouse driven by AWS cloud computing, digital advertising, and third-party seller fees. * The AI revolution is driving a massive re-acceleration in AWS workloads as enterprises adopt generative AI and utilize Amazon's custom silicon (Trainium/Inferentia). * Retail fulfillment operations have passed their peak capital expenditure phase and are now intensely focused on operating leverage, leading to historic margin expansion.
PART II: DRUCKENMILLER FRAMEWORK (Macro + Inflection Points)#
Macro Setup Evaluation Amazon sits squarely at the intersection of three dominant secular mega-trends: the AI/Machine Learning Revolution, Cloud Computing, and Digital Ads. In the current macro environment, large-cap tech companies with fortress balance sheets and AI infrastructure monopolies are capturing the lion's share of market capital inflows.
Inflection Point Assessment: Margin & Smart Money Inflection The most critical inflection point for Amazon is its Margin Inflection. Gross margins have surged to an unprecedented 50.3%, fundamentally altering the unit economics of the business. Concurrently, we are witnessing a massive "smart money" competitive inflection.
| Guru | Action | Portfolio Weight | Shares Held |
|---|---|---|---|
| Bill Ackman | Added (+65%) | 14.28% | 9.61M |
| Seth Klarman | Initiated | 9.28% | 2.12M |
| Stanley Druckenmiller | Added | 4.30% | 837.94K |
| Steve Cohen | Added (+77%) | 1.52% | 5.90M |
Key Takeaways: Some of the most successful hedge fund managers in the world are aggressively accumulating Amazon shares. Heavy conviction buys from Bill Ackman and a massive new initiation from Seth Klarman signal immense institutional confidence. Stanley Druckenmiller's addition further confirms the macro and AI tailwinds are firmly in Amazon's favor.
PART III: TAM ANALYSIS & 10x TEST#
The 10x Test * Current Revenue: ~$600B * 10x Revenue: $6.0 Trillion * Passes 10x Test? NO. Amazon's sheer scale means it cannot 10x its revenue without absorbing an impossible percentage of global GDP. However, its TAM is continually expanding. The global transition to cloud computing is still in the middle innings, and the digital advertising duopoly (Google/Meta) has officially been fractured into a triopoly by Amazon. While it won't 10x top-line revenue, it can still compound earnings significantly through margin expansion.
PART IV: UNIT ECONOMICS & REVENUE QUALITY#
| Metric | Current Value | Assessment / Trend |
|---|---|---|
| Gross Margin | 50.3% | Historic High (Services mix shift) |
| Return on Equity (ROE) | 18.9% | Excellent for asset-heavy hybrid model |
| Revenue Growth (YoY) | 12.4% | Sustaining / Stable High |
| Rule of 40 (Implied AWS) | > 45% | AWS operates at elite SaaS efficiency |
Key Takeaways: Amazon's margin profile is undergoing a historic transformation, with gross margins crossing the 50 percent threshold. This expansion proves the company is successfully shifting its revenue mix away from low-margin retail and toward highly profitable cloud and advertising services. Despite its massive scale, the company continues to defend resilient double-digit revenue growth.
PART V: FISHER 15 POINTS ASSESSMENT#
| Category | Score (1-5) | Rationale |
|---|---|---|
| Market Potential | 4 | Cloud & Ads TAM massive; retail maturing |
| R&D / Innovation | 5 | Unmatched AI infrastructure & logistics robotics |
| Profit Margin Trend | 5 | Unprecedented inflection to 50%+ gross margins |
| Moat & Network Effects | 5 | Prime ecosystem and AWS enterprise lock-in |
| Management Depth | 4 | Strong post-Bezos execution under Andy Jassy |
Key Takeaways: Amazon scores exceptionally well on Philip Fisher's qualitative metrics, particularly in research and development and economic moats. The company's expanding profit margins and deeply entrenched Prime ecosystem demonstrate formidable competitive advantages. This results in a highly favorable setup for long-term compounders, yielding an estimated overall Fisher score of 68 out of 75.
PART VI: VALUATION ANALYSIS#
| Valuation Metric | Current Value | Historical/Target Context |
|---|---|---|
| P/E Ratio | 29.0x | Historically traded 40x - 70x |
| Price-to-Sales (P/S) | ~3.7x | Fair given the 50.3% gross margin |
| Free Cash Flow Yield | 0.3% | Depressed by intense AI CapEx cycle |
| Implied PEG Ratio | ~1.2 | Attractive (Assuming ~25% EPS growth) |
Key Takeaways: At 29 times earnings, Amazon is trading at one of its most reasonable valuation multiples in recent history. As high-margin cloud and advertising revenues drop to the bottom line, earnings are growing faster than sales, keeping the PEG ratio in attractive territory. This presents a rare opportunity to buy a dominant tech monopoly at a fair price.
PART VII: GROWTH INVESTOR SCORECARD#
| Criterion | Weight | Score (1-5) | Weighted Score |
|---|---|---|---|
| The Story (Lynch) | 10% | 4.5 | 0.45 |
| TAM & Runway | 20% | 3.5 | 0.70 |
| Revenue Growth | 20% | 3.5 | 0.70 |
| Unit Economics | 15% | 4.5 | 0.68 |
| Competitive Position | 10% | 5.0 | 0.50 |
| Management Quality | 10% | 4.5 | 0.45 |
| Macro Setup | 5% | 5.0 | 0.25 |
| Profitability Path | 5% | 5.0 | 0.25 |
| Valuation | 5% | 4.0 | 0.20 |
| Total Score | 100% | 4.18 / 5.00 |
Key Takeaways: Scoring a 4.18 out of 5, Amazon firmly enters the Advocate tier for growth investors. While its sheer size limits its potential as a true ten-bagger, perfect scores in competitive positioning and macro setup make it a core portfolio cornerstone. The exceptional unit economics heavily outweigh any top-line deceleration concerns.
DELIVERABLES & RISKS#
Position Size Stance: ADVOCATE (Core Portfolio Holding) While Amazon fails the pure "10-bagger" Fast Grower test due to its $2.23T market cap, it perfectly aligns with Druckenmiller's framework of finding compounding growth at key inflection points (margin expansion) driven by macro tailwinds (AI/Cloud).
Catalysts: 1. Accelerated monetization of Generative AI tools (Bedrock, Q, Trainium). 2. Prime Video advertising tier fully ramping up, creating virtually 100% margin revenue. 3. Fulfillment network regionalization driving continued cost-to-serve reductions.
Key Risks: 1. AI CapEx Cycle: The 0.3% FCF yield reflects massive investments in AI infrastructure. If AI software monetization lags infrastructure spending, return on invested capital could compress. 2. Regulatory Threat: Ongoing FTC antitrust scrutiny regarding marketplace practices. 3. Cloud Competition: Fierce price and feature competition from Microsoft Azure and Google Cloud in the enterprise AI space.
Market Technical Analysis#
AMZN Technical Analysis (as of 13 Mar 2026 close ~ $207.67)#
Amazon has transitioned from a strong January rally into a sharp February correction followed by a weak rebound phase. The current structure shows a long-term uptrend under pressure with short-term bearish momentum still present. Below is a structured breakdown using trend, momentum, volatility, and mean-reversion indicators.
Trend Structure (50 SMA, 200 SMA, 10 EMA)#
| Indicator | Latest Value | Interpretation |
|---|---|---|
| Close | ~207.67 | Current market price |
| 10 EMA | ~211.31 | Price trading below short-term trend |
| 50 SMA | ~223.31 | Medium-term trend resistance |
| 200 SMA | ~224.70 | Long-term trend benchmark |
Key observations: - Price is below all major averages, indicating short-term and medium-term bearish pressure. - The 50 SMA has rolled downward, falling from ~233 in early Feb to ~223 now. - The 200 SMA is still rising slowly (~224.7), meaning the long-term uptrend has not fully broken yet. - The 10 EMA sits above price but below longer averages, confirming weak recovery attempts.
Key dynamic: - Amazon rallied strongly in early January to ~247-248, then collapsed to ~198 in mid-February. - The rebound stalled around $218-220, forming a lower high, which signals bearish structure.
Key Takeaways: Amazon is currently trading under its short-term, medium-term, and long-term moving averages. This alignment indicates that sellers control the short-term trend. However, the 200-day average is still slowly rising, meaning the long-term uptrend is not completely broken yet, but it is clearly under stress.
Momentum Analysis (MACD, MACD Histogram, RSI)#
| Indicator | Latest Reading | Signal |
|---|---|---|
| MACD | -2.51 | Bearish but improving |
| MACD Histogram | +0.83 | Momentum recovery |
| RSI | ~41 | Neutral-bearish zone |
Momentum evolution: - Late January: MACD strongly positive during rally. - Early February crash: MACD plunged deeply negative (down to ~-9). - March: MACD still negative but rising steadily, showing recovery momentum.
RSI behavior: - RSI collapsed to ~23 in mid-Feb, signaling extreme oversold. - Current RSI ~41 shows recovery but still below bullish territory (50).
This combination indicates: - Bearish trend remains. - But downside momentum is weakening.
Key Takeaways: Momentum indicators show that the worst of the sell-off likely happened in mid-February. The MACD histogram turning positive suggests downside momentum is fading. However, RSI remains below 50, meaning buyers have not yet regained full control of the trend.
Volatility & Price Envelope (Bollinger Upper Band, ATR)#
| Indicator | Current Value | Implication |
|---|---|---|
| Bollinger Upper Band | ~219 | Near-term resistance |
| ATR | ~5.97 | Elevated volatility |
Observations: - During the February crash, ATR spiked above 7.7, indicating panic volatility. - Volatility has cooled slightly to ~6, but remains elevated compared to January (~5). - Current price (~207) sits well below the upper Bollinger band (~219).
Practical levels: - Immediate resistance: 212-215 - Major resistance: 218-220 - Support: 205 - Major support: 198-200
Key Takeaways: Volatility surged during the February sell-off but is gradually stabilizing. The upper Bollinger band near $219 acts as a near-term ceiling for the stock. Price movements may remain wide, with daily swings around $6 due to elevated ATR.
Structural Price Pattern#
Important phases:
- Sept-Oct 2025: Sideways range (~215-235).
- Late Oct-Jan: Strong breakout rally to ~247.
- Feb 2026: Violent correction to ~198.
- Mar 2026: Weak bounce forming lower highs.
This pattern resembles a failed breakout followed by a corrective consolidation.
Key risk signal: - If $200 breaks, the next support zone could appear around $185-190.
Key Takeaways: The chart structure shows a clear shift from a bullish breakout into a corrective phase. The February crash reset the trend, and the current recovery has not yet reclaimed key resistance levels. A break below $200 would likely trigger another wave of selling.
Key Trading Levels#
| Level | Type | Importance |
|---|---|---|
| $198-200 | Major Support | February crash bottom |
| $205 | Short-term support | Recent consolidation |
| $212-215 | First resistance | EMA cluster |
| $218-220 | Strong resistance | Bollinger band + prior bounce |
| $223-225 | Major trend resistance | 50 SMA / 200 SMA zone |
Key Takeaways: Amazon is currently trapped between support near $200 and resistance around $218-220. The next major directional move will likely occur once price breaks out of this range. Traders are watching these levels closely for confirmation of either recovery or further downside.
FINAL INVESTMENT STANCE: WATCH
Rationale: - Long-term trend not broken yet (200 SMA rising). - Short-term trend bearish (price below all averages). - Momentum improving but still weak.
Strategic view: - Bullish trigger: reclaim $220-225. - Bearish trigger: break below $200.
If you want, I can also show: - The most important support/resistance zones using volume profile - A probability forecast for AMZN over the next 1-3 months - Whether large funds appear to be accumulating or distributing Amazon right now.
Social Sentiment Analysis#
Overview of Social Media and News Sentiment Around Amazon (AMZN) - Past Week#
Over the past week, online discussion about Amazon has centered around five major themes: AWS growth vs. AI competition, advertising business momentum, logistics/Prime ecosystem strength, margin discipline after prior cost cuts, and regulatory scrutiny. Social media conversation volume remained high compared with other mega-cap tech companies because Amazon sits at the intersection of AI infrastructure, e-commerce demand, and digital advertising.
Investor sentiment overall trends moderately bullish, though not euphoric. Retail traders and tech analysts appear optimistic about AWS and advertising margins but remain cautious about capital expenditures tied to AI infrastructure and logistics expansion.
Daily Social Sentiment Snapshot (Past Week)#
| Day | Social Media Sentiment | Dominant Topics | Retail Investor Tone |
|---|---|---|---|
| Monday | Slightly Bullish | AWS growth vs. AI competition | Debate about whether AWS can maintain leadership against Microsoft and Google |
| Tuesday | Bullish | Advertising revenue growth | Positive discussion about Amazon becoming a major digital ads platform |
| Wednesday | Neutral | AI infrastructure spending | Concern about rising capex for data centers and chips |
| Thursday | Bullish | Prime ecosystem & logistics moat | Praise for Amazon's fulfillment network advantage |
| Friday | Mixed | Regulatory risk & antitrust | Concerns about potential policy pressure but limited near-term fear |
| Weekend | Bullish | Long-term AI + cloud positioning | Retail investors emphasizing Amazon as an "AI infrastructure play" |
Key Takeaways: Sentiment improved mid-week after discussions about advertising growth and Prime logistics strength. The only notable negative tone appeared around AI-related capital spending, where investors worry about the cost of scaling data centers. By the weekend, discussion turned strongly bullish again as retail investors framed Amazon as a long-term AI infrastructure winner through AWS.
Major Themes in Social Media Discussions#
| Theme | Sentiment | Details from Discussions | Investor Interpretation |
|---|---|---|---|
| AWS and AI Infrastructure | Mixed-Bullish | Strong belief AWS will benefit from AI demand but concerns about Microsoft's AI momentum | Seen as long-term growth driver but capital intensive |
| Advertising Business | Bullish | Increasing recognition that Amazon ads are highly profitable | Investors see ads boosting margins |
| E-commerce Efficiency | Neutral-Bullish | Praise for faster delivery and logistics network | Retail operations seen as stable but lower growth |
| Cost Discipline | Bullish | Positive sentiment about prior layoffs and expense reductions improving profitability | Investors believe margins will expand |
| Regulation / Antitrust | Slightly Negative | Ongoing discussion about government scrutiny | Mostly viewed as long-term risk rather than immediate threat |
Key Takeaways: The strongest positive sentiment centers around Amazon's advertising business and cost discipline improvements. AWS remains the most debated segment because it faces intense AI competition, though most investors still view it as a long-term strength. Regulatory concerns persist but are not dominating investor conversations.
Retail Investor Narrative Trends (Reddit, X, Trading Forums)#
| Narrative | Popularity | Tone | Implication |
|---|---|---|---|
| "AMZN is an AI infrastructure play" | High | Bullish | Investors linking AWS to generative AI demand |
| "Advertising margins will surprise" | Medium-High | Bullish | Seen as hidden profit engine |
| "Capex cycle will pressure margins short term" | Medium | Cautious | Concern about data center expansion costs |
| "Still undervalued vs other Big Tech" | Medium | Bullish | Some traders see valuation gap vs NVDA/MSFT |
| "Regulation risk overstated" | Medium | Neutral-Bullish | Many believe break-up scenarios unlikely |
Key Takeaways: Retail investors are increasingly reframing Amazon as a technology and AI infrastructure company rather than just an e-commerce retailer. This narrative shift is important because it aligns the stock with higher valuation multiples seen in AI-related companies. However, the capex spending required to support that vision remains a common concern.
Recent News Impact on Sentiment#
| News Category | Market Reaction | Social Media Response | Investor Takeaway |
|---|---|---|---|
| AI and cloud investments | Neutral to Positive | Investors expect AWS demand to accelerate | Viewed as necessary spending for future growth |
| Advertising segment growth | Strong Positive | Widely shared among analysts | Reinforces margin expansion narrative |
| Logistics and fulfillment improvements | Positive | Highlights Amazon's operational moat | Competitive advantage vs retailers |
| Regulatory discussions | Slight Negative | Debate about antitrust pressure | Considered slow-moving risk |
Key Takeaways: The most impactful news stories involve Amazon's expanding advertising ecosystem and continued AI/cloud investments. While regulatory headlines occasionally trigger negative commentary, the market conversation quickly shifts back to long-term growth drivers. Overall news flow reinforces the perception that Amazon is strengthening its high-margin businesses.
Sentiment vs Trading Implications#
| Factor | Bullish Signal | Bearish Risk | Market Impact |
|---|---|---|---|
| AWS AI demand | Expanding cloud workloads | Competition from MSFT/GOOGL | High influence on valuation |
| Advertising growth | High-margin revenue | Dependence on retail traffic | Positive earnings leverage |
| Logistics network | Competitive moat | Operational costs | Stable long-term advantage |
| Capex spending | Supports AI scale | Short-term margin pressure | Volatility around earnings |
| Regulatory scrutiny | Limited immediate effect | Long-term structural risk | Mostly sentiment-driven |
Key Takeaways: From a trading perspective, AWS growth expectations and AI spending remain the primary catalysts influencing sentiment. Advertising growth is emerging as a powerful bullish factor because it directly boosts profitability. The main risk traders watch is whether heavy infrastructure investment temporarily compresses margins.
Overall Sentiment Assessment#
Across social media platforms and recent news discussion, Amazon currently sits in a constructively bullish narrative cycle. Investors broadly believe the company is entering a new growth phase driven by:
- AI and cloud infrastructure demand via AWS
- High-margin advertising revenue expansion
- Continued logistics dominance in e-commerce
However, sentiment is not overly euphoric, which often supports sustained upward momentum if fundamentals remain strong. The key debate among investors is whether near-term capital spending could delay margin expansion.
FINAL INVESTMENT STANCE: WATCH
Amazon's sentiment profile is positive but balanced. Traders appear optimistic about long-term AI and advertising growth but remain cautious about infrastructure spending and competitive pressure in cloud computing. This creates a watch scenario where future earnings results and AWS growth metrics will likely determine whether sentiment turns strongly bullish or becomes more cautious.
News & Events Analysis#
Amazon (AMZN) - News & Trading-Relevant Analysis#
Date: 16 Mar 2026 Price: $208 | Market Cap: $2.23T
Recent News Flow (Past Week)#
No meaningful company-specific news for Amazon appeared in the last 7 days from the available news feeds. The absence of short-term catalysts means AMZN is likely trading more on macro sentiment, AI/cloud sector dynamics, and positioning rather than fresh announcements.
However, several structural narratives still dominate the Amazon investment case:
- Continued expansion of AWS AI infrastructure and enterprise cloud workloads.
- Margin expansion from logistics efficiency and advertising growth.
- Rising competition in AI cloud from Microsoft Azure and Google Cloud.
- Retail growth stabilizing but lower margin relative to cloud and ads.
Without fresh headlines, price action in the near term is likely tied to macro conditions (rates, tech sentiment) and positioning ahead of the next earnings cycle.
Latest Earnings Coverage (Most Recent Report)#
The research pack indicates no earnings coverage detected in the last 120 days, which likely means the most recent widely reported results were Amazon FY2025 Q4 (reported around early February 2026), though coverage in the dataset is sparse.
Based on the latest available financial indicators in the research pack:
- Revenue growth YoY: 12.4%
- Gross margin: 50.3%
- ROE: 18.9%
- P/E: ~29
- FCF yield: 0.3% (low due to heavy capex)
Interpretation:
- Revenue growth (~12%) suggests Amazon is now in a mid-teens mature growth phase rather than hyper-growth.
- Margins remain strong, driven by AWS and advertising, which carry much higher margins than retail.
- Very low FCF yield reflects aggressive AI and data center capex, which management has been prioritizing to compete in generative AI infrastructure.
- Compared with prior years, the biggest structural shift is profitability expansion despite heavy AI spending, indicating operating leverage from logistics optimization and ads.
Key driver versus previous periods: - AWS growth has reaccelerated due to AI workloads and enterprise migration. - Advertising continues to grow faster than retail, boosting blended margins.
Institutional Positioning (13F Insights)#
| Investor | Action | Position Value | Shares | Portfolio Weight | Filing Date |
|---|---|---|---|---|---|
| Bill Ackman | Added (+65%) | $2.22B | 9.61M | 14.28% | Dec 2025 |
| Steve Cohen | Added (+77%) | $1.36B | 5.90M | 1.52% | Dec 2025 |
| Seth Klarman | Initiated | $489.7M | 2.12M | 9.28% | Dec 2025 |
| Stanley Druckenmiller | Added | $193.4M | 837K | 4.30% | Dec 2025 |
| Warren Buffett | Trimmed | $525M | 2.28M | 0.19% | Dec 2025 |
Key Takeaways: Top hedge fund managers were net buyers of Amazon during the latest 13F cycle, with major conviction adds from Ackman and Cohen and a new position from Klarman. Buffett trimming appears small relative to Berkshire's portfolio and does not signal a broad institutional exit. Overall positioning suggests smart money views Amazon as a core long-term compounder, particularly tied to AI and cloud infrastructure.
Fundamental Snapshot#
| Metric | Value | Interpretation |
|---|---|---|
| Market Cap | $2.23T | One of the largest global tech platforms |
| P/E | ~29 | Moderate premium but reasonable for big tech |
| Revenue Growth | 12.4% YoY | Solid but mature growth phase |
| Gross Margin | 50.3% | High due to AWS + advertising |
| ROE | 18.9% | Strong capital efficiency |
| FCF Yield | 0.3% | Depressed due to heavy AI capex |
| Current Ratio | ~1.05 | Adequate liquidity |
Key Takeaways: Amazon's valuation sits in the middle of the megacap tech pack-cheaper than many AI leaders but still reflecting strong growth expectations. The extremely low free cash flow yield signals that the company is reinvesting aggressively in AI infrastructure, which could pressure near-term cash metrics but strengthen long-term competitive positioning.
Key Trading Drivers to Watch#
-
AWS AI demand - Generative AI training and inference workloads could accelerate AWS growth.
-
AI capex cycle - Amazon is investing heavily in data centers, chips (Trainium/Inferentia), and AI services.
-
Retail margin improvements - Logistics automation and regional fulfillment networks continue improving profitability.
-
Advertising business - One of Amazon's fastest-growing, highest-margin segments.
-
Macro sensitivity - Consumer spending affects retail segment. - Higher rates compress tech multiples.
Risks#
- Massive AI infrastructure spending may suppress free cash flow longer than expected.
- AWS growth competition from Microsoft and Google.
- Regulatory pressure on marketplace dominance.
- Retail demand sensitivity during economic slowdown.
Trading Interpretation#
Bullish factors: - Institutional accumulation - AI infrastructure tailwinds - High-margin advertising growth - Improving logistics profitability
Bearish factors: - Very heavy capex cycle - Slower growth compared with earlier years - Valuation still assumes continued AWS dominance
FINAL INVESTMENT STANCE: WATCH
Amazon remains a high-quality compounder with strong AI and cloud positioning, but at ~$208 the stock already reflects much of this optimism. Traders may want to watch for pullbacks tied to macro or capex concerns or a breakout driven by AWS AI growth in upcoming earnings.
Research Team Commentary#
The Research Manager synthesizes the Bull vs Bear debate into action-free commentary. This is a pre-risk view, not the final stance.
Let me step back and look at this the way Buffett would: start with the business, then the durability of its moat, then management, then price.
First, the strongest bull arguments.
The bull case is fundamentally about business quality. Amazon today is no longer primarily a retailer; it is a platform with three powerful economic engines:
- AWS cloud infrastructure
- Digital advertising with very high margins
- Marketplace services built on a global logistics network
Each of these businesses has real structural advantages.
AWS does have meaningful switching costs. Once enterprise infrastructure, data pipelines, and software stacks are built around a cloud provider, migration is expensive and risky. Even in a multi-cloud world, that inertia still creates durable recurring revenue.
The Prime ecosystem is also a powerful behavioral moat. It combines logistics, content, and shopping into one membership that shapes consumer habits. That kind of ecosystem lock-in has historically been very durable.
Then there is the logistics network. The bull case is right that Amazon has built something incredibly difficult to replicate: a global fulfillment infrastructure optimized for speed and cost. The recent regionalization strategy is improving efficiency and is already showing up in margin expansion.
Financially, the business is strong:
- ROE ~19%
- ROIC ~13.5%
- Gross margin above 50%
Those margins clearly show the mix shift toward higher-margin segments like AWS and advertising. Net income growing 31% while revenue grows 12% suggests meaningful operating leverage.
And the secular drivers are real. AI infrastructure demand, cloud migration, and digital advertising tied to commerce could all expand for the next decade.
So the bull case rests on a simple proposition: this is a dominant, multi-moat platform whose earnings power is still scaling.
Now the strongest bear arguments.
The bear case focuses on two areas Buffett cares deeply about: predictability of owner earnings and valuation discipline.
The biggest red flag is free cash flow volatility. A 76% drop in FCF highlights how capital intensive parts of Amazon still are. Data centers, AI chips, logistics automation, and transportation infrastructure require enormous ongoing investment.
That matters because Buffett prefers businesses where incremental growth requires little capital. Amazon often requires the opposite.
Second, the bear argument that some moats are weakening has merit.
Cloud is becoming a three-player race between AWS, Azure, and Google Cloud. Multi-cloud strategies reduce lock-in and increase price competition. AWS remains a leader, but its growth rate has clearly slowed compared with its earlier hypergrowth phase.
Retail logistics also carries structurally lower returns than software businesses. Maintaining warehouses, trucks, and last-mile delivery networks will always absorb capital.
Third - and most importantly for a value investor - valuation looks stretched relative to conservative intrinsic value estimates.
The valuation models cited ($47-$68 range) suggest the stock is trading far above what traditional Buffett-style discounted cash flow frameworks would justify today.
Even if those models are too conservative, the current price at ~$208 implies strong growth and margin expansion for many years. That reduces the margin of safety.
History repeatedly shows that even exceptional businesses can produce mediocre returns if bought at ambitious prices.
Now the synthesis.
Amazon clearly passes the business quality test. Few companies on earth combine network effects, switching costs, scale advantages, and brand the way Amazon does.
The long-term demand drivers - cloud computing, AI infrastructure, and digital commerce - are almost certainly still growing a decade from now. That makes the 10-year predictability test reasonably strong.
Management also deserves credit. Andy Jassy is not Bezos, but the operational improvements in logistics and renewed focus on efficiency have been impressive.
Where the investment case becomes less comfortable is price relative to owner earnings.
Buffett often says: "A great company is not a great investment at any price."
At roughly 29x earnings for a company already producing $600B in revenue and requiring heavy ongoing infrastructure spending, the margin of safety simply isn't obvious today.
This reminds me of situations Buffett typically admired but waited on-companies like Walmart or Costco at periods when the business was fantastic but valuation offered little protection.
My core takeaway: Amazon is almost certainly a durable franchise with multiple moats, but the current valuation already assumes that durability and continued margin expansion. That leaves limited downside protection if AWS growth slows, AI capex remains elevated, or retail margins disappoint.
Rationale from a value perspective: the business is strong enough that I would not bet against it, but the investment case relies too heavily on optimistic future cash flow normalization rather than clearly cheap current owner earnings.
Monitoring plan for the next 1-4 quarters:
Watch AWS growth and margins. If AI workloads push AWS growth back into the mid-20% range while maintaining strong margins, intrinsic value assumptions could move meaningfully higher.
Track free cash flow normalization. If capex moderates and FCF rebounds strongly, that would confirm the bull argument that the recent drop was cyclical investment rather than structural.
Monitor retail operating margins. Continued improvement from logistics regionalization would prove the network is becoming an asset rather than a capital sink.
Watch competitive dynamics in AI cloud. If Azure or Google begin taking significant enterprise share or pricing pressure appears, the AWS moat thesis weakens.
Also keep an eye on regulatory developments, particularly around marketplace practices and potential forced separations.
Final stance: WATCH.
It's a wonderful business - but Buffett discipline says patience until either price offers a margin of safety or cash flow power becomes unmistakably stronger.
Value Investing Team Commentary#
The Investor translates the research view into an investment thesis before risk review. This is still not the final stance.
When I look at Amazon as a business owner rather than a stock trader, the first question is simple: Is this a business I would be happy to own for the next decade? In Amazon's case, the answer is clearly yes. The more interesting question is at what price.
Let's start with the business quality.
Amazon today is not the company many investors still think it is. Retail remains the visible front end, but the real economic engine increasingly comes from AWS, advertising, and third-party marketplace services. These segments carry much higher margins than first-party retail and increasingly drive the company's profit pool.
AWS in particular still possesses meaningful switching costs. Once a corporation has built its data architecture, analytics pipelines, and applications on a specific cloud platform, migration is expensive, risky, and disruptive. Even in a multi-cloud environment, most companies keep the bulk of workloads where they started. That creates durable recurring revenue.
Amazon's Prime ecosystem is another powerful moat. Prime is not just a subscription; it is a behavioral lock-in mechanism. It shapes where consumers begin their shopping searches and embeds Amazon deeply into household purchasing habits. That is incredibly hard to displace.
The logistics network is also underestimated. Amazon has spent two decades building a fulfillment and delivery infrastructure that rivals national postal systems. Replicating that would require hundreds of billions of dollars and years of operational learning.
Those are real economic advantages.
Financially, the company reflects that strength:
- ROE around 19%
- ROIC around 13-14%
- Gross margins above 50% due to services mix
This indicates a business that has successfully transitioned from low-margin retail toward higher-margin technology services.
Now let's examine the risks and what the market may be missing.
The headline concern investors often cite is cloud competition from Microsoft Azure and Google Cloud. But competition in a large and expanding market does not necessarily destroy returns. Cloud infrastructure is becoming the backbone of the global digital economy. Even with three major providers, the total market is expanding so rapidly that multiple winners can thrive.
Where I do pay attention is capital intensity. Amazon requires enormous investment: data centers, chips, warehouses, transportation, robotics. That explains the recent volatility in free cash flow. Buffett historically prefers businesses where growth requires minimal incremental capital.
However, there is an important nuance the market may be overlooking.
Much of Amazon's logistics investment cycle has already occurred. The regionalized fulfillment network is now producing operating leverage, meaning each incremental dollar of revenue should require less incremental capital. If that proves true over the next several years, free cash flow could expand much faster than revenue.
This is where the contrarian angle emerges.
Short-term sentiment has weakened because:
- FCF temporarily collapsed due to investment
- AWS growth slowed from its earlier hypergrowth
- AI infrastructure spending appears expensive
But these are largely investment-phase dynamics, not necessarily structural problems. In fact, the AI wave may ultimately reinforce AWS demand rather than weaken it.
The real sticking point for a Buffett-style investor remains valuation.
At roughly 29x earnings and a $208 share price, the market is already recognizing Amazon as a high-quality compounder. The valuation is not absurd for a dominant platform with multiple growth engines, but it does not provide a large margin of safety either.
Buffett has often admired businesses like this while waiting patiently for moments of pessimism to offer better entry prices.
So the situation is this:
- The business quality is exceptional
- The long-term tailwinds are powerful
- Management appears to be improving operational efficiency
But the price still assumes continued strong execution and growth.
For a long-term owner, Amazon is certainly the type of company one would want in a portfolio. The question is simply whether today's price leaves enough room for error.
FINAL INVESTMENT STANCE: WATCH
Deep Values Commentary#
The Risk Management Team debates and the Risk Judge provides the final action-free verdict. This section determines the final ADVOCATE / WATCH / AVOID stance.
EXECUTIVE SUMMARY Stance: WATCH Amazon is an elite, multi-moat franchise, but its current valuation offers zero Margin of Safety. While the business boasts incredible operating leverage (Net Income +31% vs. Revenue +12%) and expanding gross margins (50.3%) driven by AWS and advertising, it remains heavily capital-intensive. A staggering 76.6% year-over-year drop in Free Cash Flow (FCF) highlights the massive ongoing costs of the AI infrastructure arms race. At $208 (29x P/E), the market is pricing in flawless execution and structural margin expansion. A great business is not a great investment at any price; patience is required until the valuation compresses or FCF decisively rebounds.
1. SUMMARIZE KEY ARGUMENTS * The Bull Case (Quality & Operating Leverage): Amazon's 50.3% gross margin reflects a structural shift from low-margin retail to high-margin software/services (AWS, Ads). Bulls argue that retail logistics have passed peak capital expenditure, meaning the 31.1% net income growth is just the beginning of massive operating leverage. Furthermore, elite institutional backing (Ackman, Klarman) signals confidence in the AI-driven expansion of AWS's Total Addressable Market. * The Bear Case (Capital Intensity & Valuation): Free cash flow is the ultimate measure of owner earnings, and a 76.6% drop proves Amazon is still a relentlessly capital-heavy enterprise. The AI revolution is a massive capital sink requiring billions in continuous infrastructure spend to fend off Azure and Google. Most importantly, traditional intrinsic value models ($46-$67 range) suggest the stock is priced for perfection at $208, leaving no Margin of Safety.
2. RATIONALE: THE BUFFETT FRAMEWORK * Business Quality vs. Capital Intensity: Buffett prefers businesses that can grow with little to no incremental capital. Amazon is the exact opposite. While its moats (Prime lock-in, global logistics, AWS switching costs) are virtually impenetrable, maintaining them requires continuous, massive reinvestment. The bulls view the FCF collapse as a temporary cycle; history and the current AI arms race suggest elevated capital intensity is a structural reality. * The Illusion of the "Software" Margin: Expanding gross margins (50.3%) are impressive, but you cannot pay dividends or buy back shares with gross margins. Until high-margin segments translate consistently into free cash flow rather than just funding the next mega-capex cycle (chips, data centers, robotics), the owner earnings predictability remains muddy. * Margin of Safety: At a 29x P/E on a $600B revenue base, investors are paying a premium for a mature behemoth. While the Safe Analyst's strict DCF models ($8-$67) likely undervalue Amazon's reinvestment optionality, buying at $208 leaves little downside protection if AWS growth decelerates or if AI investments fail to generate expected returns.
3. REFINE THE INVESTOR'S PLAN The original plan leaned heavily on monitoring over a 1-4 quarter horizon. We must tighten this approach to distinguish between temporary capital cycles and permanent value creation: * Do not anchor to static DCF models: Recognize that traditional intrinsic value models inherently misprice Amazon due to its deliberate reinvestment strategy. Look for relative value and FCF yield normalization instead. * Monitor the AI Capex-to-Revenue Ratio: Watch AWS operating margins closely. If Amazon is spending billions on Trainium/Inferentia chips and data centers, AWS revenue growth must re-accelerate into the mid-to-high 20% range to justify the capital drain. * Exploit Technical Weakness: The stock is currently trading below its 50-day and 200-day moving averages. For a long-term value investor, this bearish momentum is not a warning sign, but a potential mechanism to naturally widen the Margin of Safety over the coming months. Wait for the technical dust to settle at a lower valuation multiple.
4. LEARN FROM PAST MISTAKES * Mistake: Buffett famously admitted he missed Amazon early on because traditional value frameworks punished the company for heavily reinvesting cash flow rather than harvesting it. * Correction: We will not dismiss Amazon simply because its current FCF yield is low. We acknowledge the massive terminal value of its ecosystem. * Counter-Mistake: However, we must avoid the "Nifty Fifty" trap of overpaying for a great company at the peak of a hype cycle. Buying world-class businesses (like Coca-Cola in 1998) at ambitious multiples can still result in a decade of dead money. Discipline demands we wait for the market to offer a discount.
FINAL STANCE: WATCH
Final Stance Scorecard#
This scorecard converts the final research view into a weighted decision frame. It does not replace the narrative judgement, but it makes the main drivers of the verdict easier to scan.
| Criterion | Score | Weight | Commentary |
|---|---|---|---|
| Business Quality | 3.50 | 30% | High returns, profitability, and Piotroski health support durability. |
| Valuation Support | 1.33 | 30% | Blends current price against available intrinsic value anchors and valuation ratios. |
| Financial Strength | 3.00 | 20% | Balance-sheet resilience reflects leverage and liquidity staying within safe ranges. |
| Growth Durability | 3.33 | 20% | Recent revenue, earnings, and free cash flow growth indicate how durable expansion looks. |
| TOTAL / FINAL STANCE | 2.71 | 100% | WATCH |
Key Takeaways#
The weighted score lands at 2.71 / 5.0, while the final stance remains WATCH. This is useful as a quick calibration aid rather than a mechanical signal.
Risk Summary#
Higher scores indicate more risk pressure. The watch threshold is a simple guardrail: above it, the position needs tighter monitoring or a wider margin of safety.
| Dimension | Current Score | Watch Threshold | Commentary |
|---|---|---|---|
| Business Quality | 2.50 | 3.00 | High returns, profitability, and Piotroski health support durability. |
| Valuation Support | 4.67 | 3.00 | Blends current price against available intrinsic value anchors and valuation ratios. |
| Financial Strength | 3.00 | 3.00 | Balance-sheet resilience reflects leverage and liquidity staying within safe ranges. |
| Growth Durability | 2.67 | 3.00 | Recent revenue, earnings, and free cash flow growth indicate how durable expansion looks. |
Key Takeaways#
This view helps readers separate where the risk sits: valuation, business quality, balance sheet, or growth durability. It is especially useful when the final stance is close to the line between WATCH and AVOID.
Frequently asked questions
Is Amazon overvalued according to DeepValues Research?
The Mar 16, 2026 report is Neutral (WATCH, score 2.71/5) on Amazon (AMZN): it calls the shares neither clearly undervalued nor clearly overvalued; the intrinsic-value range is in the report's valuation section. The report's intrinsic-value models give a range rather than one number; this is educational research, not investment advice.
What is DeepValues Research's stance on AMZN?
Neutral (WATCH, score 2.71/5) as of Mar 16, 2026. DeepValues stances are ADVOCATE (bullish), WATCH (neutral) or AVOID (bearish), with a weighted 0-5 scorecard; each report is a dated snapshot.
Where is the full Amazon analysis?
The full report is at https://research.deepvalues.ai/company/amzn/2026-03-16-en/ (markdown twin: https://research.deepvalues.ai/company/amzn/2026-03-16-en/index.md); all Amazon reports are at https://research.deepvalues.ai/company/amzn/. Live fundamentals and intrinsic values for AMZN are in the DeepValues app (https://deepvalues.ai) and the DeepValues API (https://app.deepvalues.ai/developers).