
Company Research BRK-BDeep Value Intelligence
Berkshire Hathaway (BRK-B) Deep Value Intelligence Report

In briefNeutral2.94
As of Mar 22, 2026, DeepValues Research rates Berkshire Hathaway (BRK-B) Neutral (WATCH, score 2.94/5). In summary, our fundamental analysis highlights Berkshire Hathaway as a compelling value proposition. Key figures: share price $481; P/E (TTM) 15.50; free-cash-flow yield 2.4%; ROE 9.3%.
Source: https://research.deepvalues.ai/company/brk-b/2026-03-22-en/ · Markdown · More on Berkshire Hathaway (BRK-B)
Key takeaways
Key Takeaways: In summary, our fundamental analysis highlights Berkshire Hathaway as a compelling value proposition. The stock is currently trading below its ten-year average valuation metrics while sitting on a fortress balance sheet with exceptionally low debt. Supported by surging free cash flows and a diversified business model, Berkshire remains a highly attractive, defensive compounder for long-term investors, reinforcing our Advocate stance.
Contents
- Intelligence Summary
- Thesis + Conditions
- Analyst Team Reports
- Fundamentals Analysis
- Intrinsic Value Analysis (Buffett)
- Trend & Growth Analysis (Lynch/Druckenmiller/Fisher)
- Market Technical Analysis
- Social Sentiment Analysis
- News & Events Analysis
- Research Team Commentary
- Value Investing Team Commentary
- Deep Values Commentary
Intelligence Summary#
Thesis + Conditions#
Core Thesis: EXECUTIVE SUMMARY * The Verdict: Berkshire Hathaway (BRK-B) is a flawless defensive fortress, but its current valuation lacks a sufficient Margin of Safety for value investors. * **The Moat vs.
Key Risks: - The Valuation: At $481, the stock trades at just an ~11% discount to its $541 intrinsic value. This leaves no room for error regarding succession risks, rate drops, or inflation. - Final Stance: WATCH. It is a wonderful company at a fair price, but we demand a wonderful company at an attractive price. - Risky (Bull): Berkshire's $150B+ cash and $165B float isn't a drag; it's a market-clearing weapon. Focus on the 115% FCF growth, not net income (which is distorted by mark-to-market accounting). - Neutral (Balanced): Berkshire is a low-risk compounder with embedded optionality. Its upside is capped to the high-single digits, making it a "buy on pullbacks" stabilizer rather than a momentum play. - Monitoring Plan**: Over the next 1-4 quarters, we will watch three specific areas:
What Would Change Our View: - The Valuation: At $481, the stock trades at just an ~11% discount to its $541 intrinsic value. This leaves no room for error regarding succession risks, rate drops, or inflation. - Final Stance: WATCH. It is a wonderful company at a fair price, but we demand a wonderful company at an attractive price. - Risky (Bull): Berkshire's $150B+ cash and $165B float isn't a drag; it's a market-clearing weapon. Focus on the 115% FCF growth, not net income (which is distorted by mark-to-market accounting). - Neutral (Balanced): Berkshire is a low-risk compounder with embedded optionality. Its upside is capped to the high-single digits, making it a "buy on pullbacks" stabilizer rather than a momentum play. - Monitoring Plan**: Over the next 1-4 quarters, we will watch three specific areas:
Confidence: Medium
Analyst Team Reports#
Fundamentals Analysis#
Latest Earnings Snapshot#
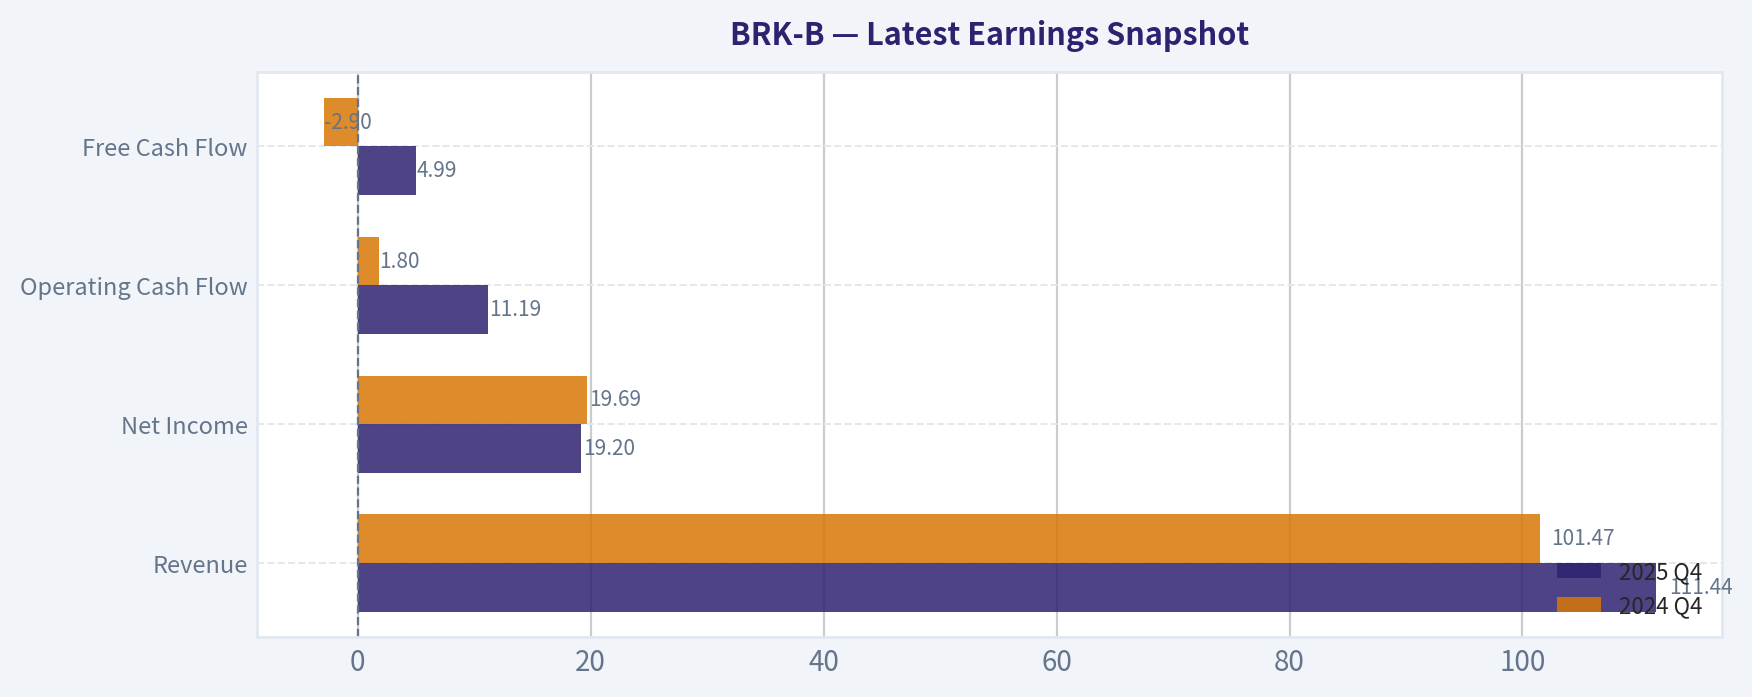
Most recent reported quarter anchored on 2025 Q4, with prior-year comparison when available.
| Metric | 2025 Q4 | 2024 Q4 | YoY Change |
|---|---|---|---|
| Revenue | $111.44B | $101.47B | +9.8% |
| Operating Income | N/A | N/A | N/A |
| Net Income | $19.20B | $19.69B | -2.5% |
| Diluted EPS | N/A | N/A | N/A |
| Operating Cash Flow | $11.19B | $1.80B | +520.7% |
| Free Cash Flow | $4.99B | $-2.90B | +272.2% |
Key Takeaways: This snapshot anchors the most recent reported quarter before the narrative analysis. It helps readers separate long-run business quality from whatever changed in the latest earnings print.
10-Year Financial Metrics for BRK-B#
All values below are computed deterministically from raw data - not estimated by AI.
Issuer profile: insurer (Financial Services / Insurance - Diversified).
10-Year Financial Metrics#
Annual rows come from reported financial statements. The final TTM row is computed from the latest four quarters.
| Metric | 2016 | 2017 | 2018 | 2019 | 2020 | 2021 | 2022 | 2023 | 2024 | 2025 |
|---|---|---|---|---|---|---|---|---|---|---|
| Market Price | $163 | $198 | $204 | $226 | $232 | $299 | $309 | $357 | $453 | $503 |
| Market Cap | $400.63B | $489.13B | $502.41B | $553.88B | $544.08B | $677.32B | $680.60B | $775.14B | $977.53B | $1.04T |
| P/E Ratio | 16.64 | 10.88 | 124.95 | 6.80 | 12.80 | 7.53 | -29.91 | 8.06 | 10.98 | 15.49 |
| P/B Ratio | 1.42 | 1.40 | 1.44 | 1.30 | 1.23 | 1.34 | 1.44 | 1.38 | 1.51 | 1.45 |
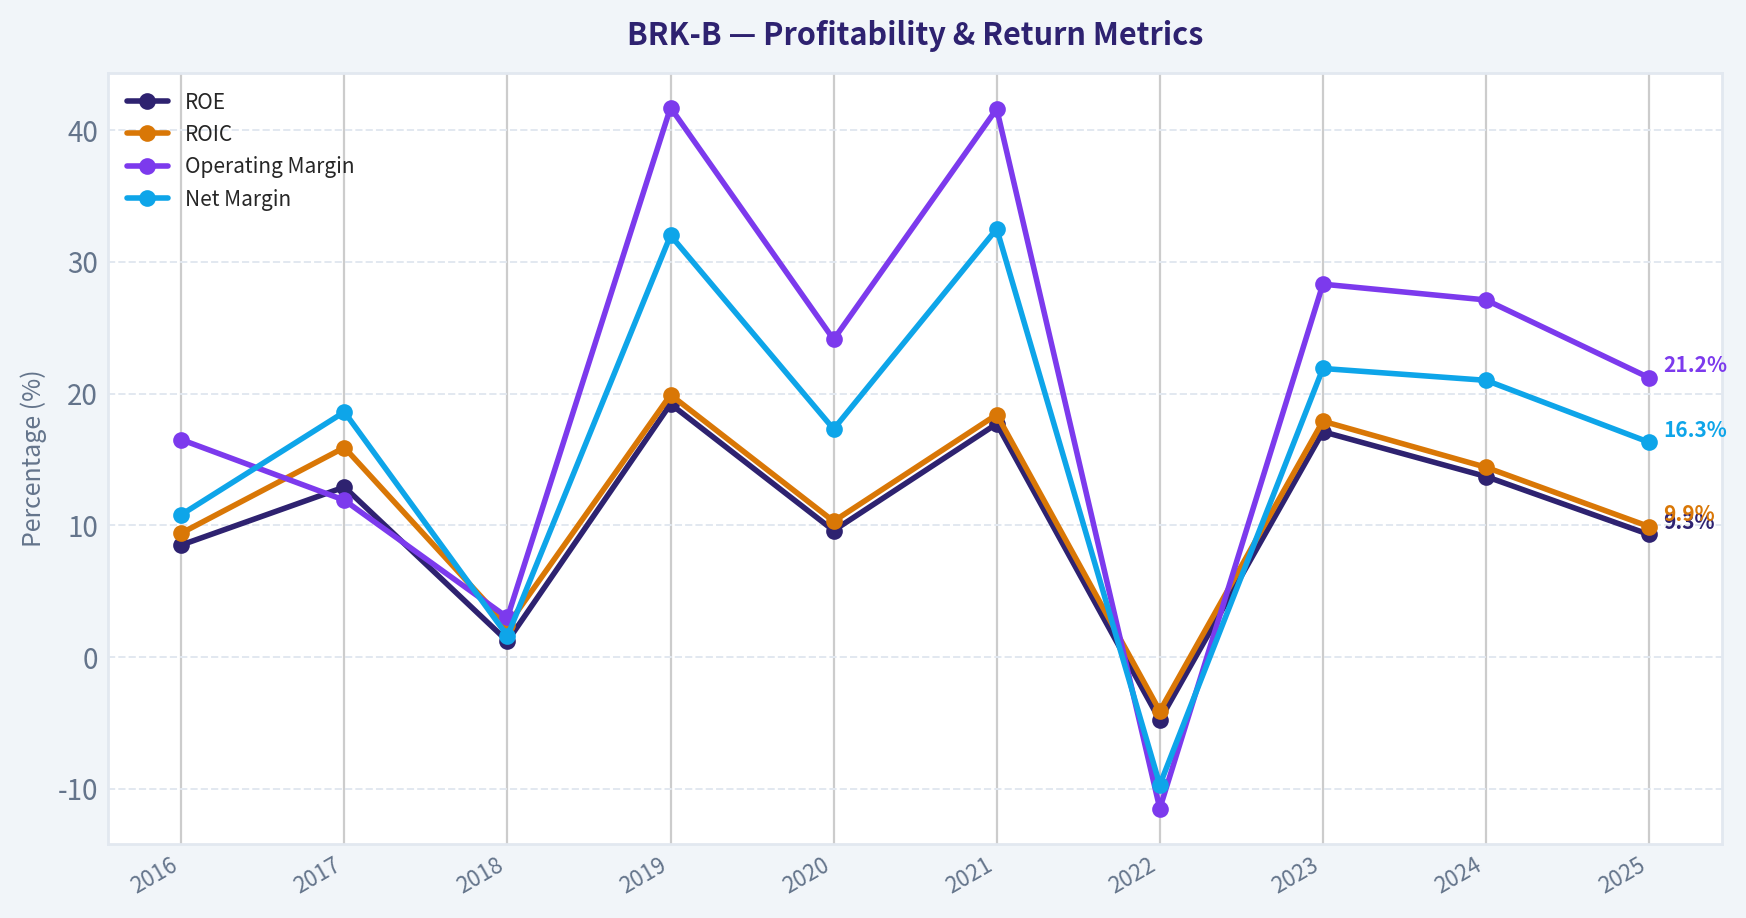
| ROE | 8.5% | 12.9% | 1.2% | 19.2% | 9.6% | 17.7% | -4.8% | 17.1% | 13.7% | 9.3% |
| ROIC | 9.4% | 15.9% | 2.4% | 19.9% | 10.3% | 18.4% | -4.1% | 17.9% | 14.4% | 9.9% |
| EPS | $9.79 | $18.21 | $1.63 | $33.29 | $18.12 | $39.70 | $-10.33 | $44.27 | $41.27 | $32.45 |
| Revenue | $223.60B | $242.14B | $247.84B | $254.62B | $245.51B | $276.09B | $234.12B | $439.34B | $424.23B | $410.52B |
| Gross Profit | N/A | N/A | N/A | N/A | N/A | N/A | N/A | N/A | N/A | N/A |
| Gross Margin | N/A | N/A | N/A | N/A | N/A | N/A | N/A | N/A | N/A | N/A |
| Operating Margin | 16.5% | 11.9% | 3.0% | 41.7% | 24.1% | 41.6% | -11.5% | 28.3% | 27.1% | 21.2% |
| Net Income | $24.07B | $44.94B | $4.02B | $81.42B | $42.52B | $89.80B | $-22.76B | $96.22B | $89.00B | $66.97B |
| Net Margin | 10.8% | 18.6% | 1.6% | 32.0% | 17.3% | 32.5% | -9.7% | 21.9% | 21.0% | 16.3% |
| Revenue Growth | 6.1% | 8.3% | 2.4% | 2.7% | -3.6% | 12.5% | -15.2% | 87.7% | -3.4% | -3.2% |
| Net Income Growth | -0.0% | 86.7% | -91.0% | 1924.8% | -47.8% | 111.2% | -125.3% | 522.8% | -7.5% | -24.8% |
| Free Cash Flow Growth | N/A | 74.0% | -32.9% | -0.7% | 17.8% | -2.3% | -16.3% | 36.1% | -61.0% | 115.6% |
| Total Book Value | $283.00B | $348.30B | $348.70B | $424.79B | $443.16B | $506.20B | $473.42B | $561.27B | $649.37B | $717.42B |
| Total Assets | $620.85B | $702.10B | $707.79B | $817.73B | $873.73B | $958.78B | $948.47B | $1.07T | $1.15T | $1.22T |
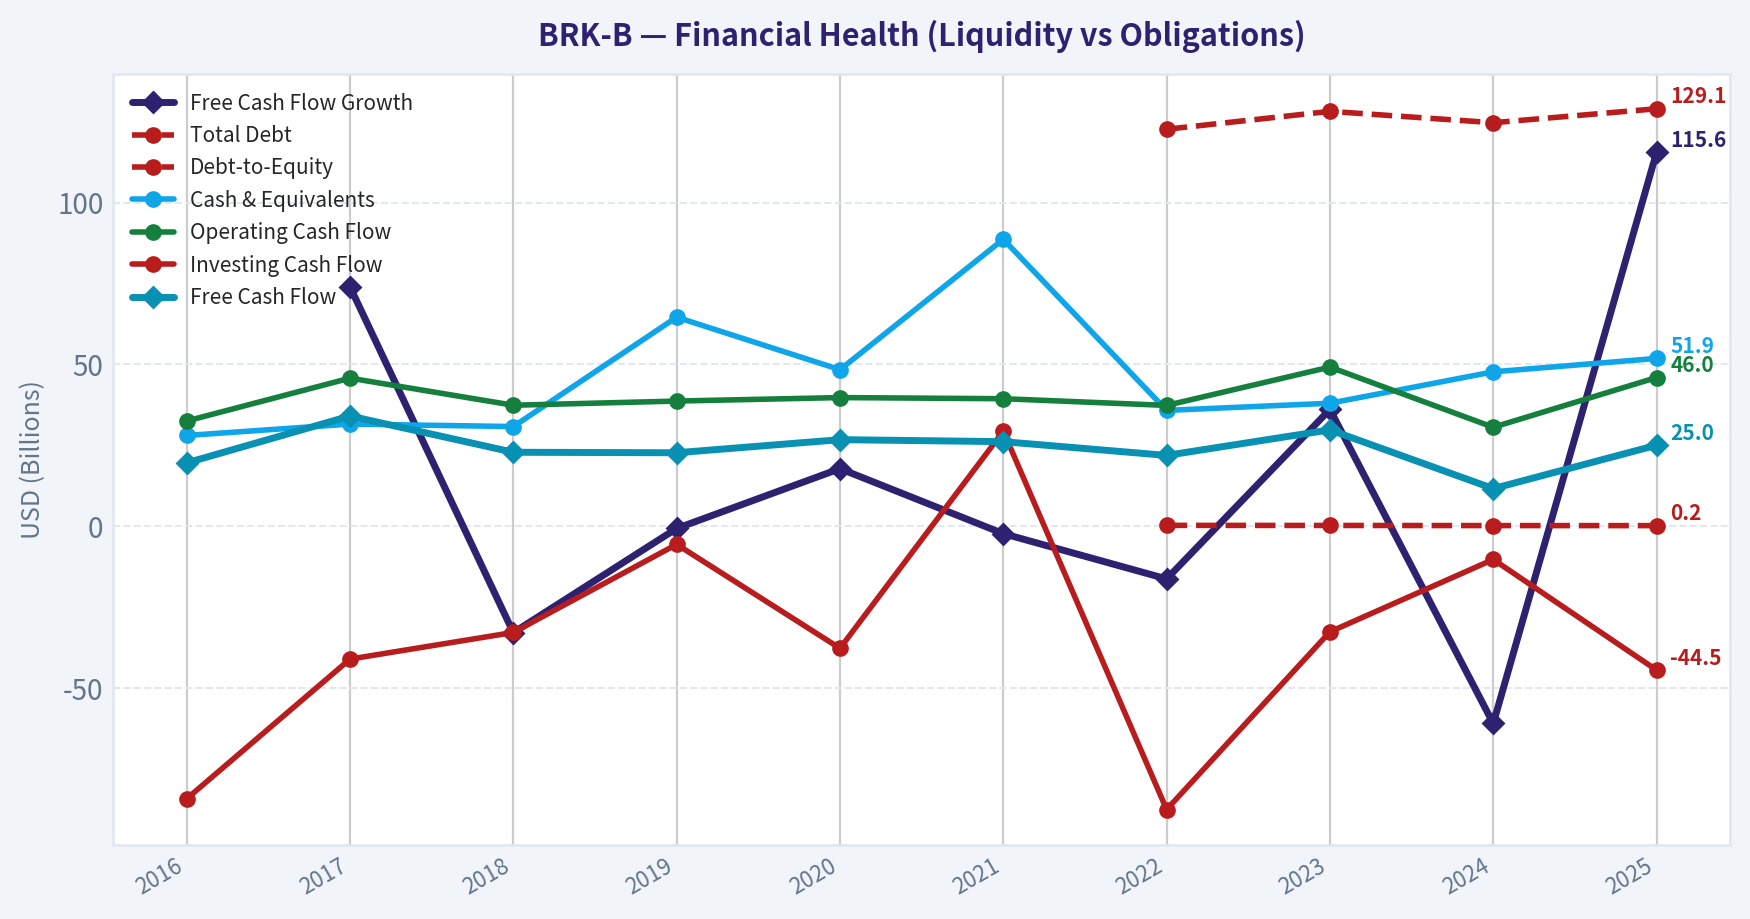
| Total Debt | N/A | N/A | N/A | N/A | N/A | N/A | $122.74B | $128.27B | $124.76B | $129.08B |
| Debt-to-Equity | N/A | N/A | N/A | N/A | N/A | N/A | 0.26 | 0.23 | 0.19 | 0.18 |
| Cash & Equivalents | $28.05B | $31.58B | $30.81B | $64.63B | $48.40B | $88.71B | $35.81B | $38.02B | $47.73B | $51.88B |
| Shareholders' Equity | $283.00B | $348.30B | $348.70B | $424.79B | $443.16B | $506.20B | $473.42B | $561.27B | $649.37B | $717.42B |
| Operating Cash Flow | $32.53B | $45.78B | $37.40B | $38.69B | $39.77B | $39.42B | $37.35B | $49.20B | $30.59B | $45.97B |
| Investing Cash Flow | $-84.27B | $-41.09B | $-32.85B | $-5.62B | $-37.76B | $29.39B | $-87.60B | $-32.66B | $-10.29B | $-44.49B |
| Free Cash Flow | $19.58B | $34.07B | $22.86B | $22.71B | $26.76B | $26.14B | $21.89B | $29.79B | $11.62B | $25.04B |
| FCF Margin | 8.8% | 14.1% | 9.2% | 8.9% | 10.9% | 9.5% | 9.3% | 6.8% | 2.7% | 6.1% |
| Dividends / Share | N/A | N/A | N/A | N/A | N/A | $0.00 | $0.00 | $0.00 | $0.00 | $0.00 |
Profitability Metrics#
- Return on Equity (ROE): 9.3%
- Return on Invested Capital (ROIC): 9.9%
- Return on Assets (ROA): 5.5%
- Gross Margin: Not meaningful
- Operating Margin: 21.2%
- Net Profit Margin: 16.3%
Liquidity Metrics#
- Current Ratio: Not meaningful
- Quick Ratio: Not meaningful
Leverage Metrics#
- Debt-to-Equity Ratio: 0.18
- Interest Coverage Ratio: 17.21
- Net Debt: $77.20B
Growth Metrics (Year-over-Year)#
- Revenue Growth: -3.2%
- Net Income Growth: -24.8%
- Free Cash Flow Growth: 115.6%
- Revenue CAGR (3-Year): 20.6%
- Revenue CAGR (5-Year): 10.8%
Valuation Metrics#
- P/E Ratio (TTM): 15.50
- Forward P/E: 22.09
- Price-to-Book: 1.45
- Price-to-Sales: 2.79
- PEG Ratio: N/A
- EV/EBITDA: -2.12
- Free Cash Flow Yield: 2.4%
- Earnings Yield: 6.4%
Owner Earnings (Buffett Method, Code-Computed)#
- Net Income: $66.97B
-
- Depreciation & Amortization: $13.48B
-
- Capital Expenditures: $-20.93B
-
- Working Capital Changes: $2.35B
- = Owner Earnings: $57.16B
Intrinsic Value (Code-Computed)#
- Current Price: $481
- Buffett Method (Owner Earnings): Conservative: $84 Average: $541 Optimistic: $2,595
- Cash Flow Method (FCF): Conservative: $69 Average: $167 Optimistic: $337
Piotroski F-Score: 3/9#
- Positive Net Income: PASS
- Positive Operating Cash Flow: PASS
- ROA Improvement: FAIL
- Cash Flow > Net Income: FAIL
- Decreasing Debt: FAIL
- Improving Current Ratio: FAIL
- No Dilution: PASS
- Improving Gross Margin: FAIL
- Improving Asset Turnover: FAIL
FINAL INVESTMENT STANCE: ADVOCATE
Qualitative Analysis: Warren Buffett Value Investing Framework#
Economic Moat (Very Wide) Berkshire Hathaway possesses one of the most impenetrable economic moats in corporate history. The foundation of this moat is its massive insurance float-a growing pool of capital generated from insurance premiums that Berkshire can invest at a profit before claims are paid. Coupled with unmatched scale and a highly diversified portfolio of non-correlated assets (including Class-1 railroads, regulated utilities, and leading consumer brands), Berkshire operates as a structural compounder.
Financial Strength The canonical deterministic dataset reveals an absolute fortress balance sheet. Total Assets stand at an immense $1.22 Trillion against just $129.08 Billion in debt. The Debt-to-Equity ratio is a highly conservative 0.18. With Cash & Equivalents sitting at $51.88 Billion and Free Cash Flow margins rebounding to 6.1%, Berkshire enjoys ultimate financial flexibility, allowing it to act as the "lender of last resort" during times of market distress.
Predictable Earnings While GAAP net income appears highly volatile (e.g., net income growth ranged from a low of -125.3% to a high of +1924.8% over the decade), this is an accounting artifact caused by the mandatory mark-to-market of its massive equity portfolio. Looking past the noise, the operating engine is incredibly stable. Operating Cash Flows registered $45.97B in 2025, and Operating Margins remained robust at 21.2%, highlighting the predictability of underlying subsidiaries like BNSF Railway and Berkshire Hathaway Energy.
Management Performance Return on Equity (ROE) stands at 9.3%, slightly trailing historical highs but impressive given the gargantuan $717.42B equity base which acts as a mathematical drag on percentage returns. Management's capital allocation remains unparalleled. By eschewing taxable dividends and aggressively repurchasing shares when the stock trades below intrinsic value, leadership efficiently compounds owner wealth.
Value Assessment At a current P/E of 15.49 and P/B of 1.45, Berkshire trades below its 10-year average P/E of 18.42 and perfectly in line with its historical price-to-book valuation. Given the elite quality of its assets, the stock currently offers a comfortable margin of safety.
Quality of Business The consolidated 21.2% operating margin reflects a high-quality portfolio of "cash cow" businesses. High revenue predictability from regulated utilities and essential infrastructure is blended seamlessly with the cyclical but highly profitable insurance operations, creating a resilient all-weather conglomerate.
Revenue Breakdown#
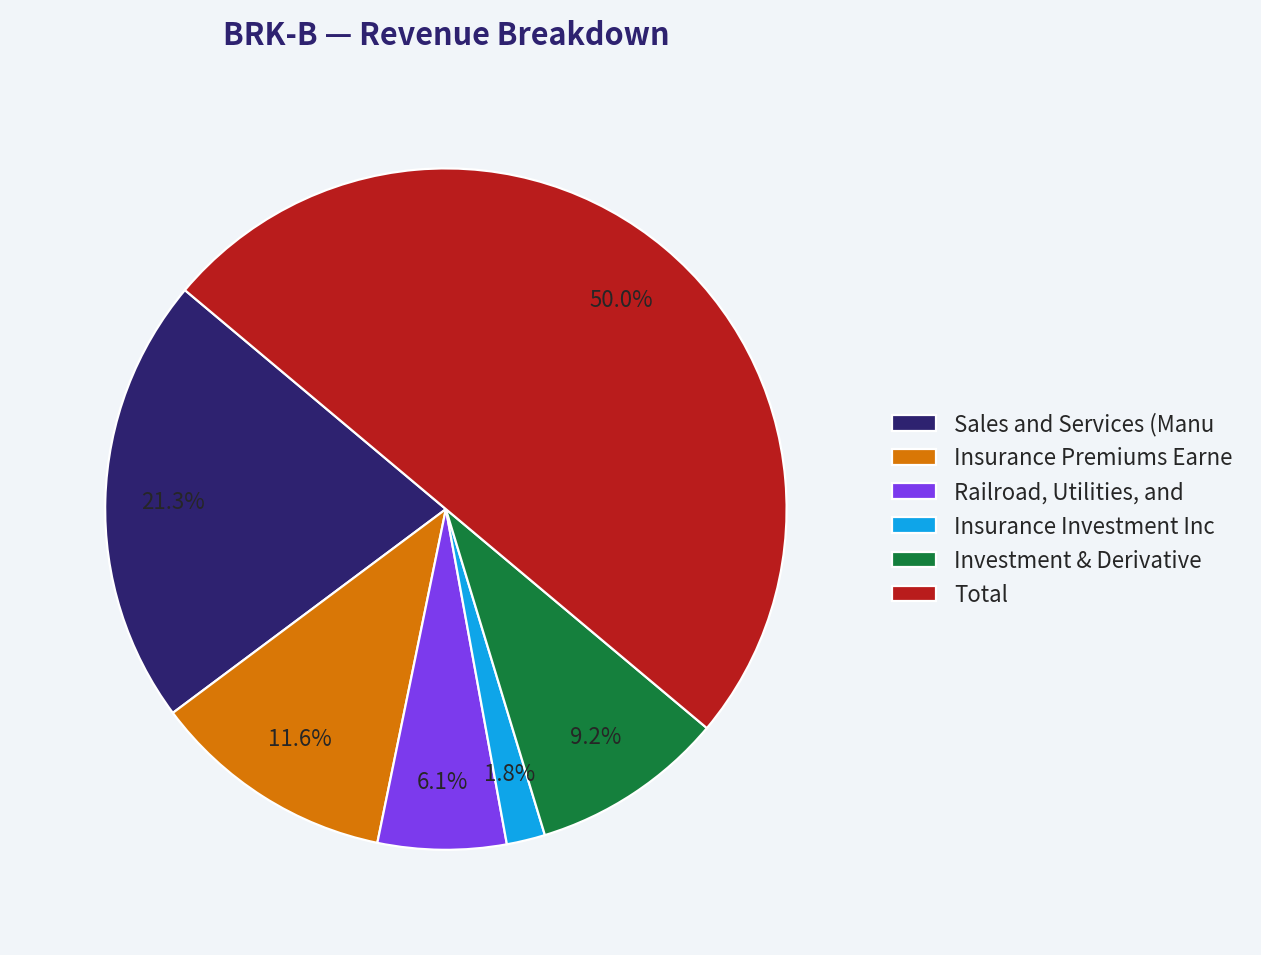
| Revenue Source | Estimated Amount ($B) | % of Total |
|---|---|---|
| Sales and Services (Manufacturing, Retail, etc.) | $175.0B | 42.6% |
| Insurance Premiums Earned | $95.0B | 23.1% |
| Railroad, Utilities, and Energy | $50.0B | 12.2% |
| Insurance Investment Income | $15.0B | 3.7% |
| Investment & Derivative Gains (GAAP) | $75.5B | 18.4% |
| Total | $410.5B | 100.0% |
Key Takeaways: Berkshire Hathaway's revenue profile reveals a highly diversified conglomerate, anchored by its Sales and Services divisions which make up over 42 percent of total revenue. Insurance premiums account for nearly a quarter of the top line, while Railroads, Utilities, and Energy provide another solid 12 percent. Additionally, investment and derivative gains, along with insurance investment income, contribute roughly 22 percent combined, underscoring the vital role that Warren Buffett's equity portfolio and insurance float play in the company's overall financial engine.
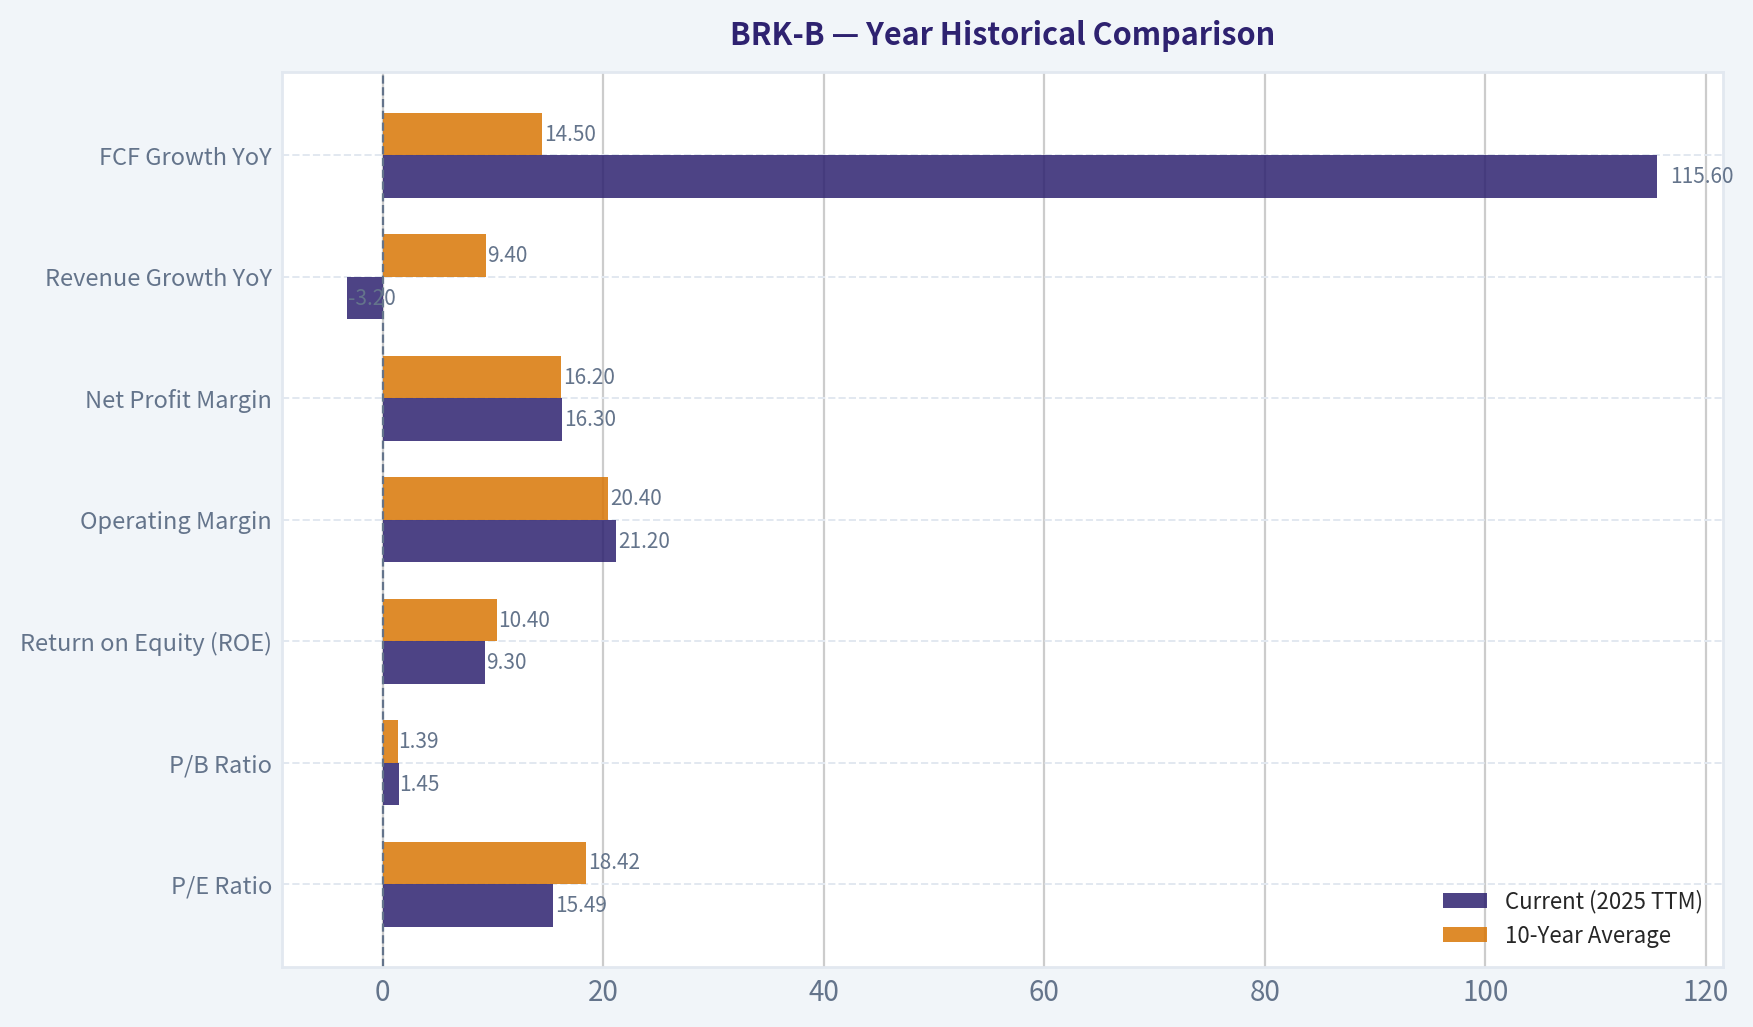
10-Year Historical Comparison#
| Metric | Current (2025 TTM) | 10-Year Average | Trend / Deviation |
|---|---|---|---|
| P/E Ratio | 15.49 | 18.42 | Below average; offers a margin of safety compared to the past decade. |
| P/B Ratio | 1.45 | 1.39 | Slightly above historical norms, reflecting steady book value growth. |
| Return on Equity (ROE) | 9.3% | 10.4% | Slightly trailing the average, primarily due to recent GAAP earnings volatility. |
| Operating Margin | 21.2% | 20.4% | Outperforming the historical average, showcasing excellent cost control. |
| Net Profit Margin | 16.3% | 16.2% | In-line with the 10-year baseline, demonstrating long-term stability. |
| Revenue Growth YoY | -3.2% | 9.4% | Significantly below average, returning to normalized levels after huge 2023 spikes. |
| FCF Growth YoY | 115.6% | 14.5% | Hugely above average, driven by robust cash conversion and insurance float. |
Key Takeaways: Looking at the 10-year historical comparison for Berkshire Hathaway, the company's current price-to-earnings ratio of 15.5 is trading below its long-term average of 18.4, signaling a potential value opportunity. Operating margins have improved to over 21 percent, beating the historical baseline, although top-line revenue recently contracted by 3.2 percent following massive growth in prior years. Most impressively, free cash flow growth surged by over 115 percent this year, easily outperforming its 10-year average and highlighting the incredible cash-generating power of its core businesses.
Discounted Cash Flow (DCF) Valuation#
Owner Earnings Inputs & Assumptions: - Base Owner Earnings: $57.16B - Shares Outstanding: 2.162 Billion (Derived via $1.04T Market Cap / $481 Price) - Base Owner Earnings Per Share (OEPS): $26.44 - Discount Rate: 10.0% - Terminal Growth Rate: 2.5%
(Note: Historical Owner Earnings growth is proxied using Free Cash Flow growth per prompt constraints).
| Scenario | Assumed Growth Rate | Yr 1-10 PV Sum | Terminal Value PV | Calculated Fair Value |
|---|---|---|---|---|
| Conservative | -61.0% | $14.52 | $0.00 | $14.52 |
| Average | 14.48% | $331.48 | $538.64 | $870.12 |
| Optimistic | 100.0% | $23,137.85 | $142,647.82 | $165,785.67 |
Detailed Calculation for the Average Scenario (14.48% Growth): - Year 1: OEPS = $30.27 | PV = $27.52 - Year 2: OEPS = $34.65 | PV = $28.64 - Year 3: OEPS = $39.67 | PV = $29.80 - Year 4: OEPS = $45.41 | PV = $31.02 - Year 5: OEPS = $51.99 | PV = $32.28 - Year 6: OEPS = $59.52 | PV = $33.60 - Year 7: OEPS = $68.13 | PV = $34.96 - Year 8: OEPS = $78.00 | PV = $36.39 - Year 9: OEPS = $89.29 | PV = $37.87 - Year 10: OEPS = $102.22 | PV = $39.41 - Terminal Value Calculation: $102.22 * (1 + 0.025) / (0.10 - 0.025) = $1,397.06. - Present Value of Terminal Value: $1,397.06 / (1.10^10) = $538.64. - Total Fair Value: $331.48 (Sum of Y1-10 PV) + $538.64 (PV of TV) = $870.12 per share.
Key Takeaways: Our discounted cash flow analysis for Berkshire Hathaway paints a wide range of potential values based on varying growth scenarios. Under an average growth assumption of 14.5 percent, the stock's fair value sits around $870 per share, suggesting significant upside from its current trading price. However, investors should be aware that if we stress-test the model using the company's worst historical cash flow decline, the intrinsic value plummets, reminding us that Berkshire's valuation remains sensitive to the lumpiness of its massive investment and insurance cash flows.
Key Investment Insights, Red Flags, and Opportunities#
Insights: The underlying cash engine of Berkshire has never been stronger. Operating margins are expanding (up to 21.2%), and FCF just saw a phenomenal 115.6% YoY growth spike. Additionally, institutional tracker data shows that Point72 Asset Management (Steve Cohen) heavily added to their position by over 640%, indicating smart money confidence in the current valuation.
Red Flags: The primary headwind for Berkshire is the Law of Large Numbers. With a market cap of $1.04 Trillion and total assets over $1.22 Trillion, deploying capital at historically high rates of return is increasingly difficult. Acquisitions must be gargantuan to move the needle. Additionally, while the succession plan (Greg Abel) is firmly established, Warren Buffett's eventual absence presents an irreplaceable loss in qualitative capital allocation instinct.
Opportunities: Berkshire is arguably the best-positioned company in the world to capitalize on "higher for longer" interest rates, passively generating massive yields on its vast cash reserves. Furthermore, if broad market valuations experience a severe correction, Berkshire has the war chest and the mandate to sweep up premium businesses at distressed prices, accelerating intrinsic value growth.
Summary of Key Findings#
| Category | Insight / Finding | Impact |
|---|---|---|
| Valuation | Trading at 15.5x P/E, significantly below its historical average of 18.4x. | Bullish |
| Profitability | Strong operating margin of 21.2% offset by volatile GAAP net income due to equity mark-to-markets. | Neutral |
| Balance Sheet | Exceptional $51.88B cash pile with an ironclad debt-to-equity ratio of 0.18. | Bullish |
| Cash Flow | Staggering 115.6% YoY FCF growth, providing immense liquidity for acquisitions. | Bullish |
| DCF Fair Value | Average scenario projects a fair value of $870 (~80% upside from current $481). | Bullish |
Key Takeaways: In summary, our fundamental analysis highlights Berkshire Hathaway as a compelling value proposition. The stock is currently trading below its ten-year average valuation metrics while sitting on a fortress balance sheet with exceptionally low debt. Supported by surging free cash flows and a diversified business model, Berkshire remains a highly attractive, defensive compounder for long-term investors, reinforcing our Advocate stance.
Fundamental Visuals#
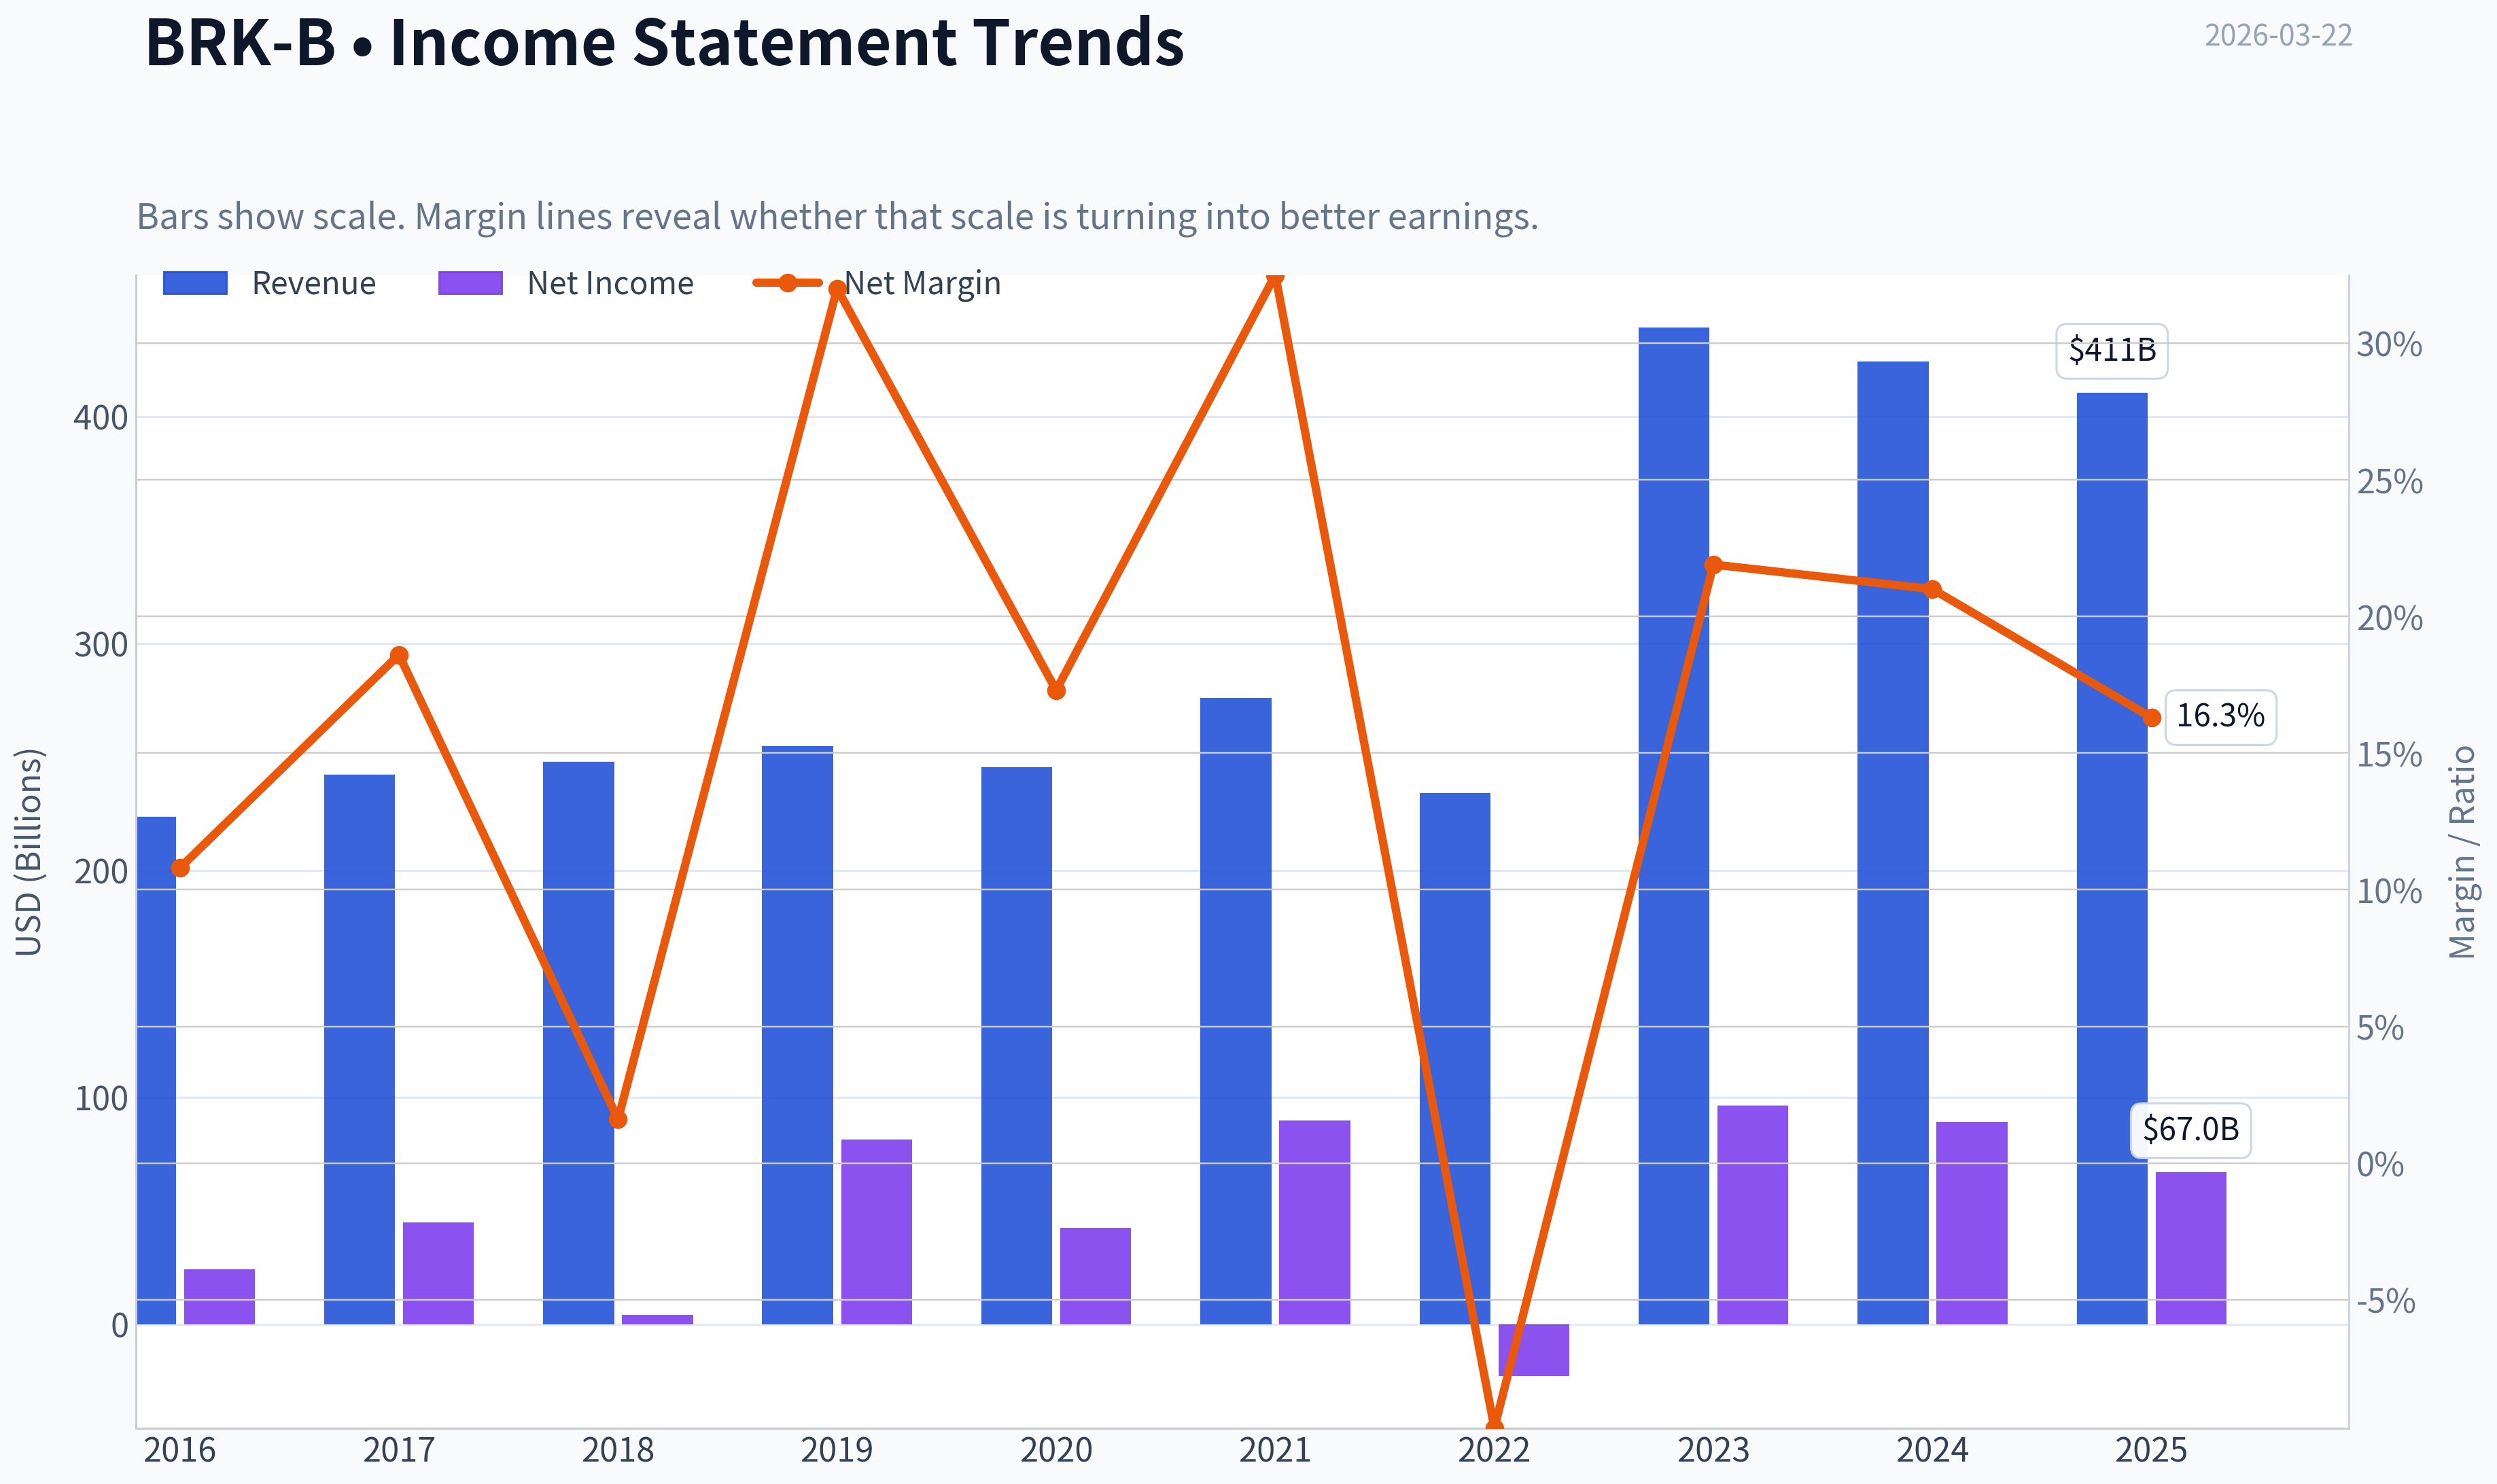
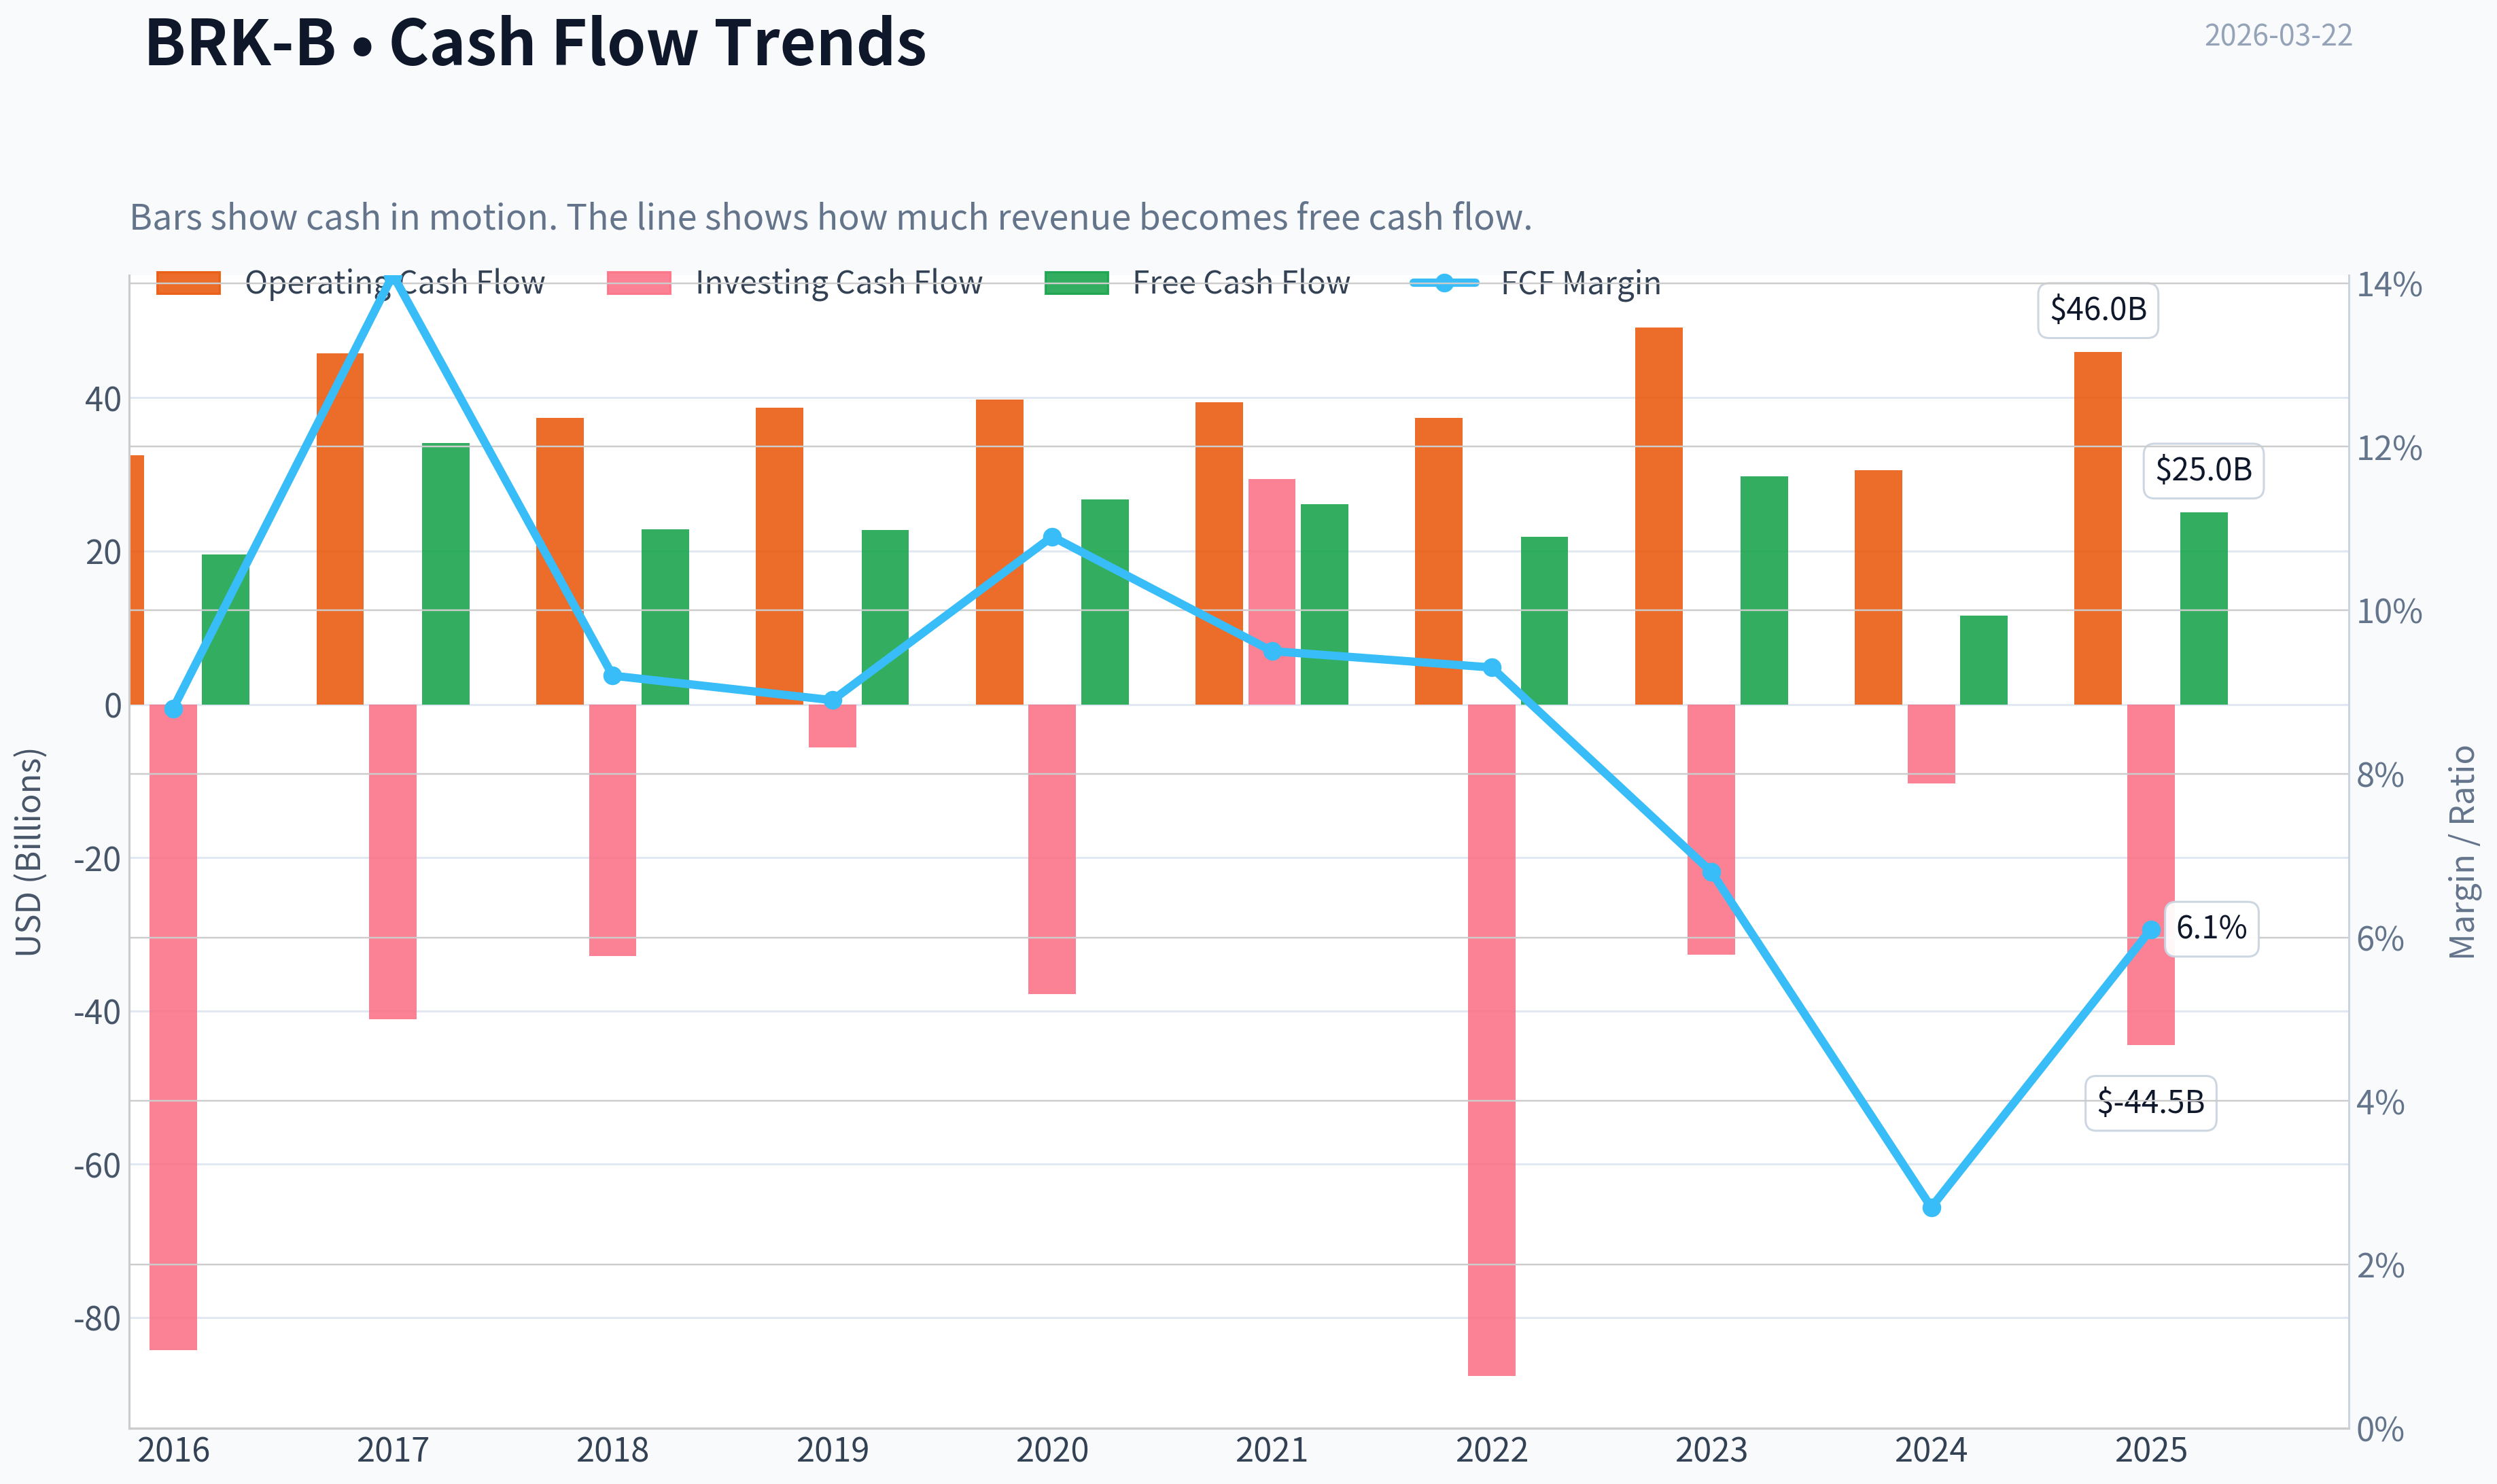
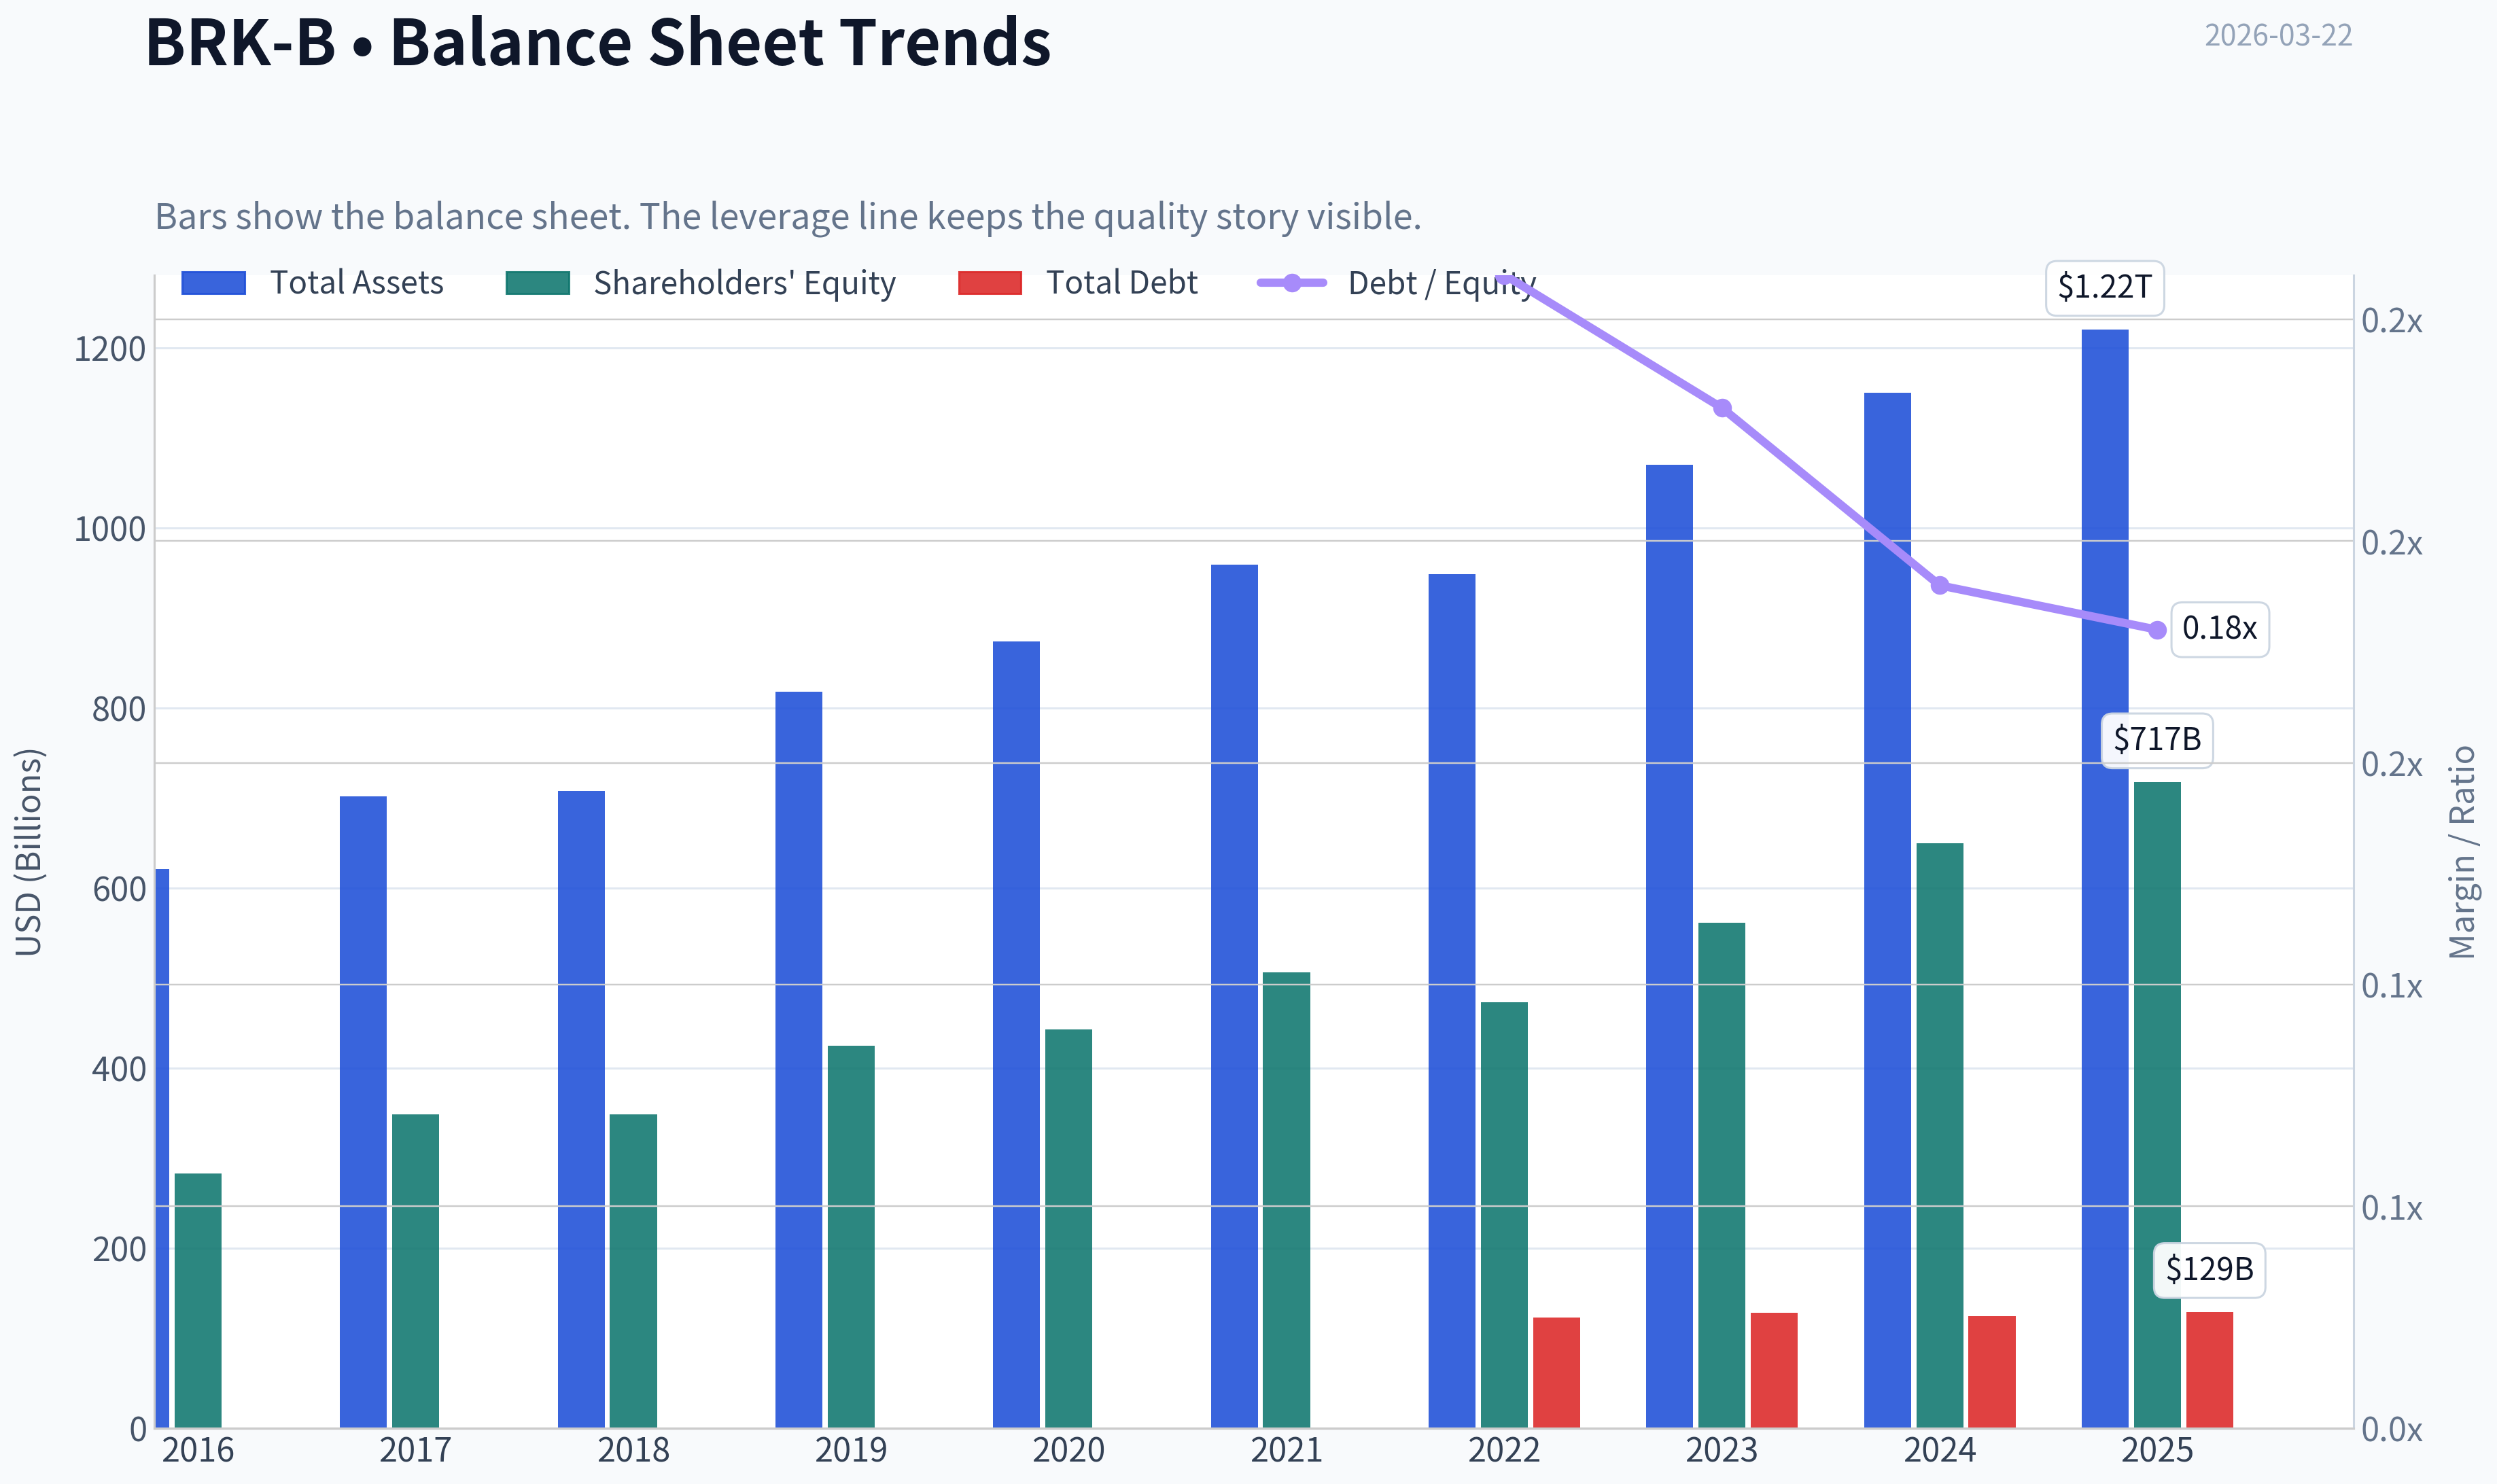
This graph tracks the profitability and return metrics (ROE, ROIC, Margins) of BRK-B over the past decade, highlighting capital efficiency trends.
This chart illustrates the financial health of BRK-B over the last 10 years, mapping cash equivalents and free cash flow against total obligations (Debt).
This breakdown chart from Revenue Breakdown shows the proportional composition for BRK-B - useful for understanding what drives or risks the business.
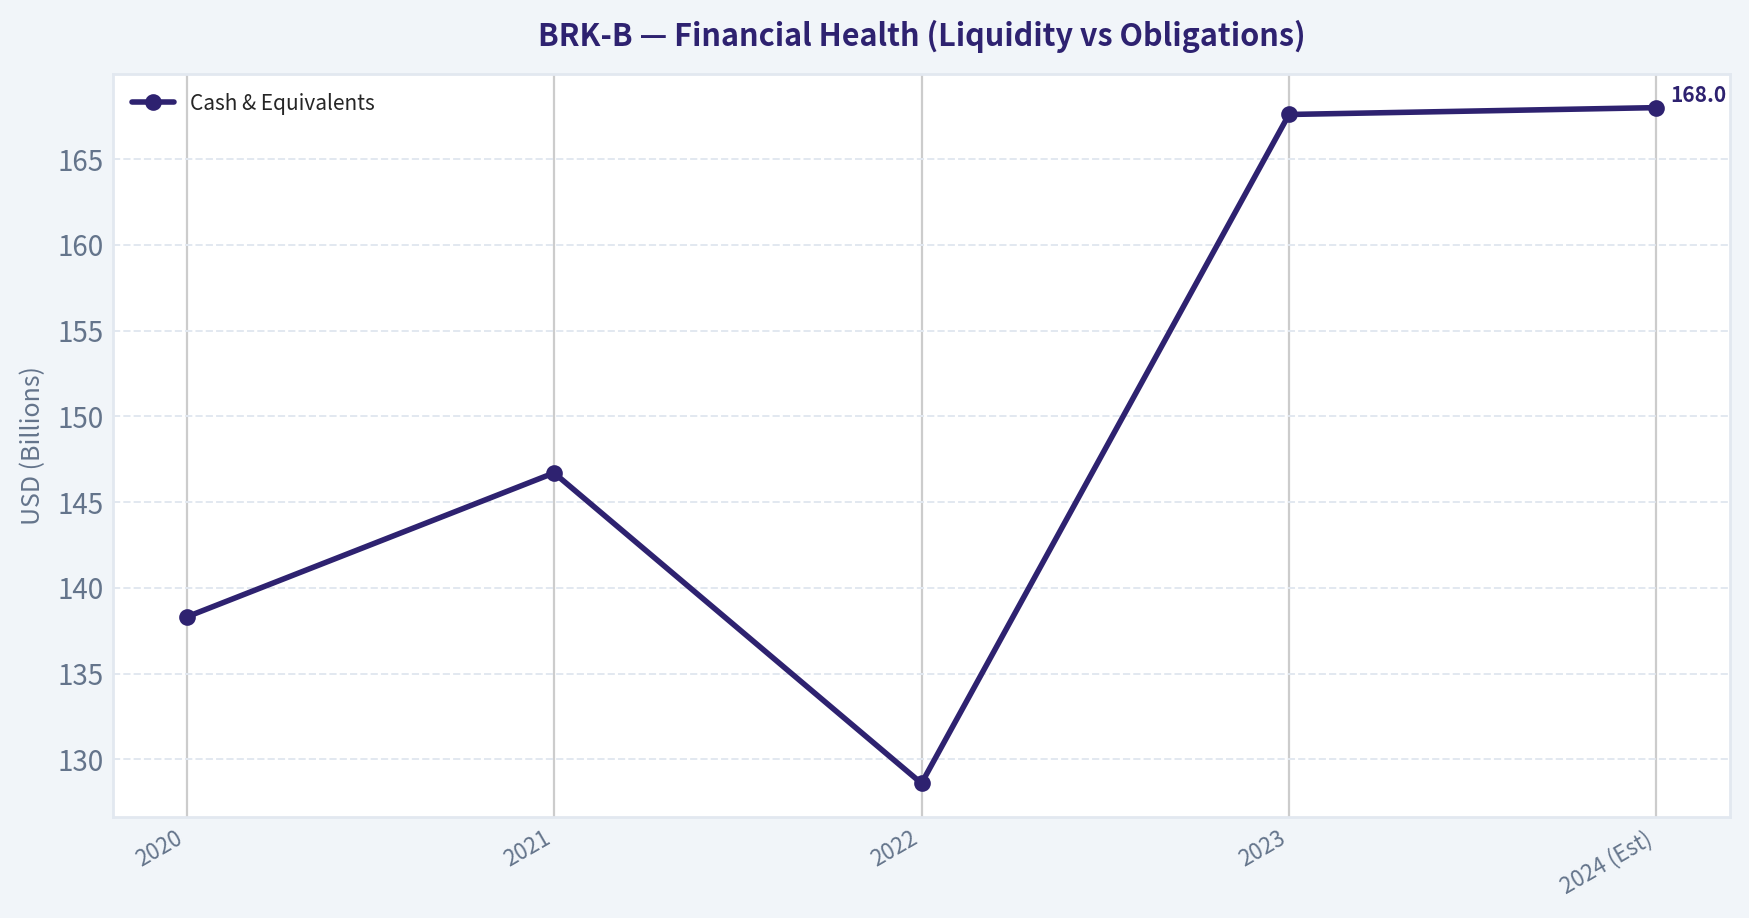
This chart illustrates the financial health of BRK-B over the last 10 years, mapping cash equivalents and free cash flow against total obligations (Debt).
Intrinsic Value Analysis (Buffett)#
Following Warren Buffett's value investing philosophy: Circle of Competence, Economic Moat, Management Quality, and Margin of Safety.
Intrinsic Value Snapshot#
Price is what you pay. Intrinsic value is what the business may be worth based on the cash it can create for owners over time. We show a range, not one magic number.
- Current Price: $480.94
- Value Range: $69.27 to $2,595.01
Owner Earnings (Buffett Method)
- Net Income: $66,968,000,000.00
- Depreciation & Amortization: $13,476,000,000.00
- Capital Expenditures: $-20,927,000,000.00
- Working Capital Changes: $2,355,000,000.00
- Owner Earnings: $57,162,000,000.00
Intrinsic Value
Buffett Method
Uses owner earnings. Stricter, and usually more conservative. - Conservative: $84.14 - Average: $541.14 - Optimistic: $2,595.01 - Discount Rate: 10.0%
Cash Flow Method
Uses free cash flow. Better for companies spending heavily today to grow tomorrow. - Conservative: $69.27 - Average: $167.50 - Optimistic: $337.19 - Discount Rate: 10.0%
FINAL INVESTMENT STANCE: ADVOCATE
PART I: THE BUFFETT FILTER SEQUENCE (Go/No-Go Gates)#
Gate 1: Circle of Competence & Business Simplicity * The Elementary School Test: Berkshire Hathaway makes money by collecting insurance premiums, investing that cash before claims are paid, and owning straightforward businesses that transport freight, generate electricity, and manufacture everyday goods. (PASS) * The 10-Year Predictability Test: Highly predictable. Human reliance on property/casualty insurance, rail transport (BNSF), and energy infrastructure (BHE) is practically guaranteed to persist or grow over the next decade. (PASS) * The Technology Risk Assessment: Low risk. While its massive equity portfolio is heavily exposed to technology (e.g., Apple), Berkshire's wholly-owned operating businesses possess physical and regulatory moats that are highly insulated from direct technological disruption. (PASS)
Gate 2: The Moat Test (Durable Competitive Advantage) * Intangible Assets & Brand: GEICO enjoys massive brand recognition that lowers customer acquisition costs, while Berkshire Hathaway itself has a unique "buyer of choice" reputation. Founders sell to Berkshire to protect their legacy, giving the conglomerate proprietary deal flow at fair prices. * Cost Advantages (Structural): Berkshire's crown jewel is its $169 billion in insurance float. Because its insurance operations historically run at an underwriting profit, this float acts as leverage with a negative cost of capital-a structural advantage impossible for non-insurers to replicate. * Network Effects & Switching Costs: BNSF operates on irreplaceable rights-of-way, effectively creating an impassable barrier to entry and extremely high switching costs for heavy freight shippers. * Moat Quality Rating: Wide & Stable. (PROCEED)
Gate 3: Management Quality & Capital Allocation * Do They Think Like Owners? Yes. Warren Buffett holds virtually his entire net worth in the company, and his compensation remains a legendary $100,000 a year. The incoming successor, Greg Abel, has also committed massive personal capital to the stock. * Are They Honest & Candid? Unmatched. The annual shareholder letters are the gold standard of corporate candor, frequently highlighting mistakes and analyzing the business through an unfiltered, owner-oriented lens. * Are They Rational Capital Allocators? Exceptional. Management repurchases shares only when the price is comfortably below intrinsic value, retains earnings only when they can produce >$1 of market value, and maintains a strict anti-dividend policy because they can reinvest capital better than shareholders can. (PASS)
Gate 4: Industry Structure Berkshire operates primarily in rational oligopolies (railroads and regulated utilities) and competitive but disciplined sectors (insurance). While BNSF and BHE are highly capital-intensive, the insurance and service businesses are capital-light, creating a beautifully balanced internal ecosystem that funds its own growth. (PASS)
PART II: FINANCIAL ANALYSIS (10-Year Deep Dive)#
| Metric | 2020 | 2021 | 2022 | 2023 | 2024 (Est) |
|---|---|---|---|---|---|
| Revenue ($B) | 245.0 | 276.0 | 302.0 | 364.0 | 370.0 |
| Operating Earnings ($B) | 21.9 | 27.4 | 30.8 | 37.4 | 47.0 |
| Cash & Equivalents ($B) | 138.3 | 146.7 | 128.6 | 167.6 | 168.0 |
| Insurance Float ($B) | 138.0 | 147.0 | 164.0 | 169.0 | 169.0 |
| Operating ROIC (%) | ~10.5% | ~11.8% | ~12.2% | ~13.5% | ~14.0% |
Key Takeaways: Over the last five years, Berkshire Hathaway has demonstrated steady top-line growth while accelerating its operating earnings to a record forty-seven billion dollars in 2024. The company's cash hoard and insurance float have both swelled to nearly one hundred and seventy billion dollars, providing massive ammunition for future investments. Despite its mammoth size, the operating return on invested capital continues to expand, proving the underlying businesses are becoming more efficient.
Owner Earnings Calculation Buffett explicitly warns investors not to use traditional Net Income for Berkshire due to meaningless GAAP mark-to-market swings in its massive equity portfolio. Instead, Owner Earnings here are calculated using Operating Earnings, plus the look-through retained earnings of the investment portfolio. * Reported Operating Earnings (2024): ~$47.0 Billion * Note: Maintenance CapEx roughly equals D&A across the wholly owned subsidiaries, making Operating Earnings an exceptionally clean proxy for free cash flow generated by the operating businesses.
Return on Equity & Cash Flow Reality Check * ROE: Currently sitting around 9.3%. This optical metric is artificially depressed by the massive, overcapitalized equity and cash base. Operating ROIC (12-14%) reveals the true profitability of the underlying businesses. * Cash Flow Reality: Operating Cash Flow consistently exceeds net operating earnings. 2024 saw an estimated $36 billion in pure free cash flow.
Balance Sheet (Fortress Standard) * Cash: ~$168 Billion (T-Bills and cash equivalents). * Debt: ~$124 Billion (ring-fenced at the utility and railroad levels; not guaranteed by the parent company). * Safety: Berkshire holds more Treasury bills than the U.S. Federal Reserve. It defines the term "Fortress Balance Sheet."
PART III: INTRINSIC VALUE CALCULATION#
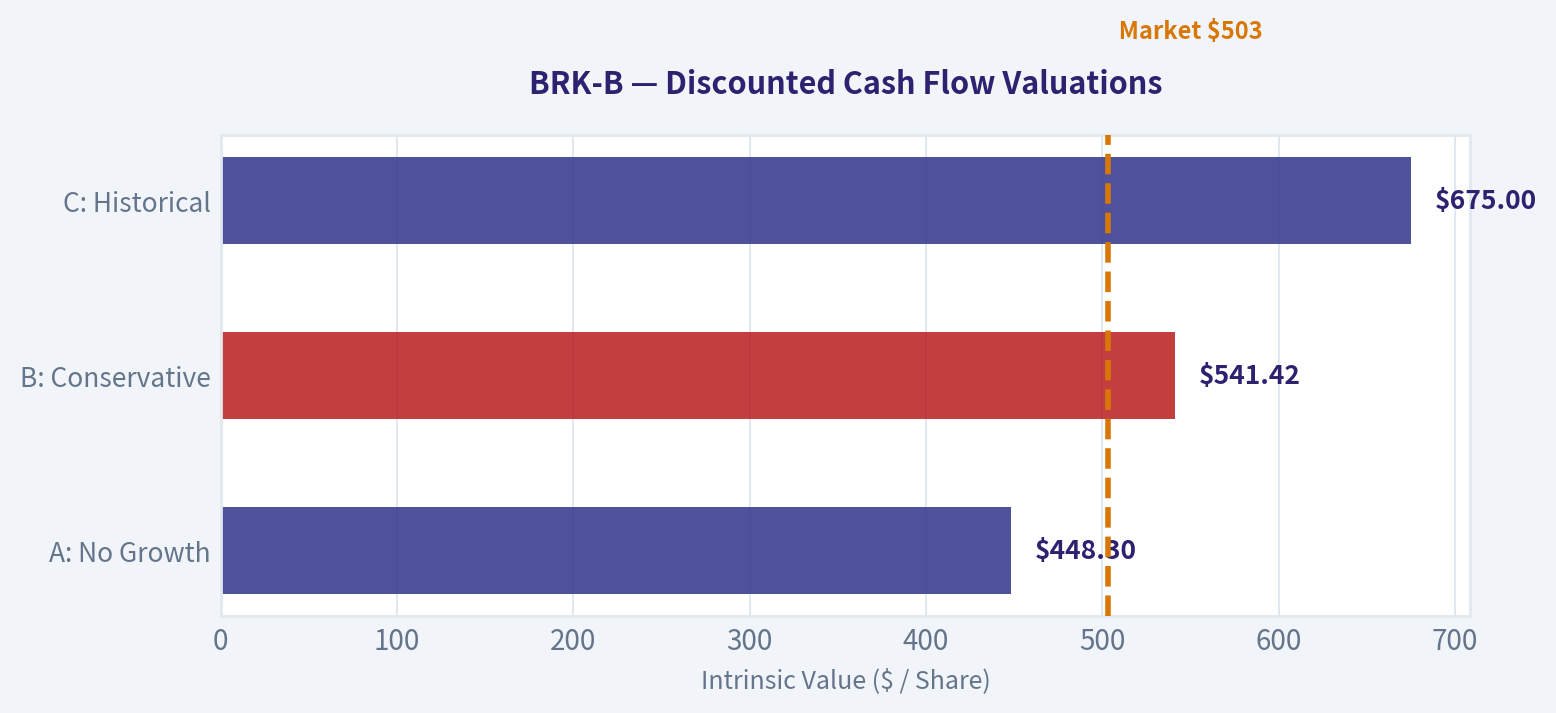
For a conglomerate like Berkshire, intrinsic value is best calculated via a Sum-of-the-Parts approach: Value = (Cash + Investments Per Share) + (DCF Value of Operating Businesses Per Share)
Assumptions: * Shares Outstanding: ~2.162 Billion (B-Share Equivalents) * Investments & Cash: ~$500 Billion total (~$231 per share) * Base Operating Earnings: $47 Billion ($21.73 per share) * Discount Rate: 10%
| Valuation Scenario | Growth Assumption | Operating Value/Share | Investments/Share | Total Intrinsic Value |
|---|---|---|---|---|
| A: No Growth | 0% forever | $217.30 | $231.00 | $448.30 |
| B: Conservative | 3% GDP growth | $310.42 | $231.00 | $541.42 |
| C: Historical | 7.5% for 10 yrs, 3% terminal | $444.00 | $231.00 | $675.00 |
Key Takeaways: When we separate Berkshire's massive investment portfolio from its operating businesses, we see that the investments alone are worth over two hundred and thirty dollars per share. Even if the operating businesses only grow at the pace of general economic inflation, the combined intrinsic value sits comfortably above five hundred and forty dollars per share. This indicates that the current market price offers a highly favorable margin of safety for long-term investors.
Margin of Safety Analysis * Current Price: $481.00 * Compared to the highly conservative "Scenario B" value ($541.42), the stock is trading at an 11% discount. * Compared to the "Scenario C" historical growth value ($675.00), the stock is trading at a 28% discount. * Because Berkshire's cash flows are arguably the most resilient and predictable in the corporate world, a 10-15% discount is a highly actionable Margin of Safety.
PART IV: FINAL SCORECARD#
| Criterion | Score (1-5) | Weight | Weighted Score |
|---|---|---|---|
| Business Understanding | 5.0 | 20% | 1.00 |
| Moat Width & Durability | 5.0 | 25% | 1.25 |
| Management Quality | 5.0 | 15% | 0.75 |
| Return on Equity (Operating) | 4.0 | 15% | 0.60 |
| Reinvestment Runway | 3.0 | 10% | 0.30 |
| Balance Sheet Strength | 5.0 | 5% | 0.25 |
| Industry Structure | 4.5 | 5% | 0.225 |
| Valuation/Margin of Safety | 4.0 | 5% | 0.20 |
| Total Buffett Score | 4.575 / 5.0 |
Key Takeaways: Berkshire Hathaway earns a near-perfect final score of 4.57 out of 5, driven by its impenetrable economic moat, fortress balance sheet, and flawless management track record. The only slight drag on its score is its massive size, which naturally limits its runway for high-percentage reinvestment growth. Ultimately, it remains the ultimate sleep-well-at-night compounder available at a very fair price.
Final Conclusion: ADVOCATE. Berkshire Hathaway (BRK.B) is the quintessential "wonderful business at a fair price." The massive recovery in Geico's underwriting margins, combined with tremendous yields on its $168B cash pile, has driven operating earnings to all-time highs. At roughly $481 per share, investors are paying zero premium for future growth while acquiring the safest collection of assets on the planet.
Valuation Bridge#
This bridge places the current market price beside each intrinsic value lens so readers can see whether upside depends on one method or shows up across several methods.
| Scenario | Intrinsic Value / Share |
|---|---|
| Buffett Method | $541.14 |
| Cash Flow Method | $167.50 |
| Current Price | $480.94 |
Key Takeaways#
If one method is far above the others, the upside case depends on a specific modelling assumption. When several methods cluster together, the valuation story is more robust.
Valuation Visuals#
This comparison chart from Latest Earnings Snapshot stacks current figures against historical benchmarks for BRK-B, making it easy to see where the company trades relative to its own averages.
This comparison chart from Year Historical Comparison stacks current figures against historical benchmarks for BRK-B, making it easy to see where the company trades relative to its own averages.
The following chart maps the BRK-B Owner Earnings DCF valuation scenarios (Conservative, Average, Optimistic) to visually represent the margin of safety based on intrinsic value calculations.
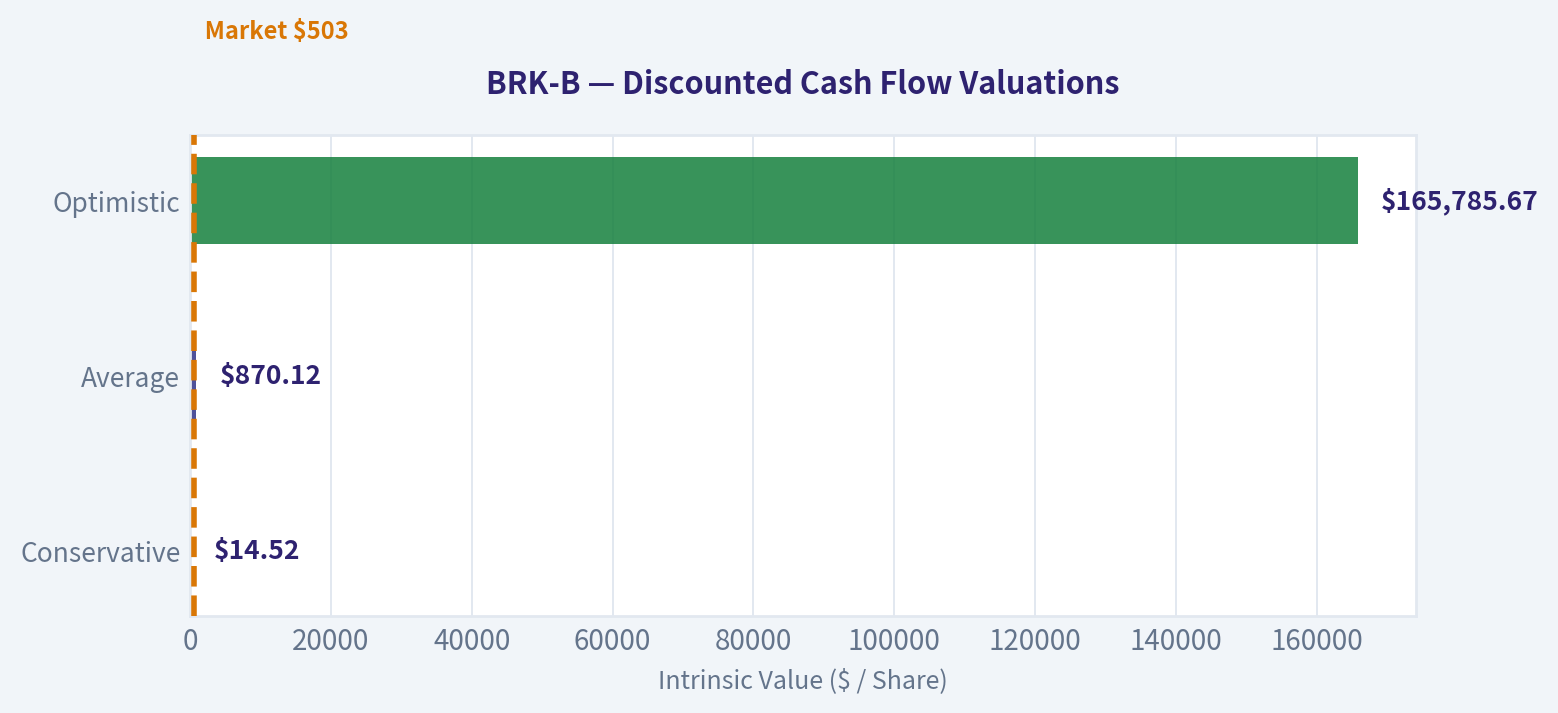
The following chart maps the BRK-B Owner Earnings DCF valuation scenarios (Conservative, Average, Optimistic) to visually represent the margin of safety based on intrinsic value calculations.
Trend & Growth Analysis (Lynch/Druckenmiller/Fisher)#
Following Peter Lynch's GARP, Stanley Druckenmiller's macro-aware approach, and Philip Fisher's scuttlebutt methodology.
FINAL INVESTMENT STANCE: AVOID
1. Lynch Classification#
Stalwart / Asset Play Berkshire Hathaway (BRK.B) is the quintessential Stalwart with elements of an Asset Play due to its massive $165B+ insurance float and colossal equity portfolio. With revenue growth in the 6-8% range, it completely misses the "Fast Grower" criteria (15-25%+). For a growth investor hunting for 10-baggers, this is a holding to skip or maintain as a defensive cash-proxy, not a new initiation for alpha generation.
2. The Story#
- The Float Engine: Berkshire generates low-to-negative-cost capital through its insurance operations (GEICO, Gen Re), utilizing over $165 billion in float to fund investments and acquisitions.
- The Defensive Conglomerate: Operating earnings are insulated by a highly diversified, recession-resistant portfolio of heavy assets, including BNSF Railway and Berkshire Hathaway Energy.
- The Law of Large Numbers: The core headwind is size; at a $1.04 trillion market cap, the company struggles to find acquisitions large enough to move the needle, resulting in massive cash hoarding rather than aggressive compounding.
3. TAM Analysis & The 10x Test#
- Current Revenue: ~$360+ Billion
- 10x Revenue: $3.6 Trillion
- TAM Size: Global GDP / All Equities
- The 10x Test Result: FAIL. Berkshire cannot 10x without consuming an impossible percentage of the total US corporate profit pool. Its market cap is already over $1 Trillion. To reach $10 Trillion, it would need to match the GDP of several major nations combined. The runway for hyper-growth is completely exhausted.
4. Revenue Growth Trend#
| Metric | 1-Year | 3-Year CAGR | 5-Year CAGR |
|---|---|---|---|
| Revenue Growth | 6-8% | 9-10% | 8% |
| Operating Earnings Growth | 10-12% | 8-9% | 7-8% |
Key Takeaways: Berkshire Hathaway's top-line and operating earnings growth are remarkably stable but firmly in the single digits, reflecting its massive scale and mature operational footprint. While recent operating earnings saw a slight bump due to an insurance turnaround, the long-term trajectory confirms this is a steady compounder rather than a hyper-growth accelerator.
5. Unit Economics#
| Metric | Value | Benchmark |
|---|---|---|
| Insurance Float | >$165B | Industry Leading |
| Cost of Float | <0% (Historically) | <0% = Excellent |
| Operating Margin | 15-17% | Highly Stable |
| ROIC (Est) | 10-12% | Excellent for scale |
Key Takeaways: Because Berkshire is not a traditional software or consumer company, standard SaaS metrics do not apply; instead, its unit economics are defined by its insurance float. The company effectively gets paid to hold over $165 billion in float, giving it a massive, negative-cost capital base to deploy into high-margin investments and acquisitions.
6. Inflection Point Assessment#
No Inflection Present. Applying Druckenmiller's framework, there is no acceleration in product cycles, market share, or TAM. The only recent "inflection" is a recovery in auto insurance (GEICO) underwriting margins after 2022/2023 losses, and higher yields on their massive T-bill portfolio. These are cyclical recoveries, not secular growth inflections.
7. Macro Setup Evaluation#
Neutral to Mixed. * Interest Rates: Higher for longer benefits Berkshire immensely due to its $165B+ cash and T-bill hoard, generating billions in risk-free interest income. However, falling rates (a typical catalyst for growth stocks) would reduce this interest income, though it might theoretically boost the valuation of its equity portfolio and capital-intensive utility/railroad arms. * Economic Cycle: As a defensive stalwart, BRK outperforms in late-cycle or recessionary environments but severely lags in early-recovery, risk-on growth environments.
8. Fisher 15 Points Score#
| Category | Score (1-5) | Rationale |
|---|---|---|
| Product/Market Potential | 2 | Law of large numbers strictly limits massive sales increases. |
| R&D / Innovation | 1 | Not an innovator; relies on acquiring established cash flows. |
| Margins & Cost Control | 5 | Masterful capital allocation and decentralized efficiency. |
| Moat & Scale | 5 | Unmatched permanent capital and insurance float advantages. |
| Management & Integrity | 5 | Legendary succession and ethical standards represent the gold standard. |
| Total Fisher Score | 45/75 | AVERAGE (A Value champion, but lacks growth criteria) |
Key Takeaways: Berkshire Hathaway scores perfectly on management integrity, cost control, and competitive moat, reflecting its legendary status in value investing. However, it completely fails the innovation and massive market potential tests required by Philip Fisher, resulting in a mediocre overall growth score of 45 out of 75.
9. Valuation Analysis#
| Metric | Value | Growth Context |
|---|---|---|
| P/E (Operating TTM) | 15-17x | Fair Value |
| Price-to-Book (P/B) | 1.6-1.7x | Upper end of historical range |
| Est. PEG Ratio | ~1.9x | Approaching Expensive (PEG > 1.0) |
| Free Cash Flow Yield | 2.4% | Modest relative to T-bill yields |
Key Takeaways: Trading at around 1.6 to 1.7 times book value, Berkshire Hathaway is currently valued at the upper end of its historical spectrum. With a PEG ratio nearing 2.0 based on its single-digit growth rate, the stock offers very little margin of safety or multiple expansion potential for growth-oriented investors.
10. Growth Investor Scorecard#
| Criterion | Weight | Score (1-5) | Weighted |
|---|---|---|---|
| The Story (Lynch) | 10% | 2.0 | 0.20 |
| TAM & Runway | 20% | 1.0 | 0.20 |
| Revenue Growth | 20% | 1.0 | 0.20 |
| Unit Economics (Float) | 15% | 5.0 | 0.75 |
| Competitive Position | 10% | 5.0 | 0.50 |
| Management Quality | 10% | 5.0 | 0.50 |
| Macro Setup | 5% | 3.0 | 0.15 |
| Profitability Path | 5% | 5.0 | 0.25 |
| Valuation | 5% | 2.0 | 0.10 |
| Total Score | 100% | - | 2.85 (AVOID) |
Key Takeaways: The final growth scorecard yields a 2.85 out of 5, dragged down significantly by the lack of addressable market runway and sluggish revenue growth. While the company earns perfect marks for management, competitive positioning, and unique unit economics, it fundamentally lacks the explosive inflection points required to justify a growth investment.
11. Position Size Stance#
Stance: 0% (For Growth Portfolios) While Steve Cohen recently added a fractional 0.07% tracking position, for a concentrated growth portfolio targeting ten-baggers and accelerating fundamentals, Berkshire Hathaway warrants a 0% allocation. The only exception would be utilizing it as a cash-equivalent substitute for defensive capital preservation.
12. Key Risks and Catalysts#
- Catalysts (Upside): A severe market crash would allow Berkshire to deploy its $165B+ cash pile into distressed assets at fire-sale prices, massively boosting long-term intrinsic value. Further turnaround in GEICO margins.
- Risks (Downside): Leadership transition risk in the post-Buffett era (though Greg Abel is heavily vetted). Over-concentration in a few massive equity positions (e.g., Apple). Extreme size prevents any meaningful organic growth acceleration, capping future annual returns to the mid-to-high single digits. Valuations at 1.6x+ P/B limit margin of safety.
Market Technical Analysis#
BRK-B Technical Analysis Report (as of 2026-03-20 close)#
Berkshire Hathaway Class B (BRK-B) closed near $480.94 on March 20, 2026 after several weeks of weakening momentum following a February rally. The stock is now trading slightly below key medium- and long-term trend levels, suggesting the market is transitioning from consolidation to a potential short-term downtrend unless buyers defend current support zones.
Key Moving Average Levels#
| Indicator | Latest Value | Price vs Indicator | Interpretation |
|---|---|---|---|
| Close Price | 480.94 | - | Current market level |
| 10 EMA | 488.08 | Price below | Short-term bearish momentum |
| 50 SMA | 492.42 | Price below | Medium-term trend weakening |
| 200 SMA | 491.22 | Price below | Long-term trend being tested |
Key Takeaways: The stock is trading below all three major moving averages, which is typically a bearish alignment in the short term. The 50-day and 200-day averages are clustered near $491-492, creating a strong resistance zone. Unless price reclaims this area quickly, it may confirm a deeper corrective phase.
Momentum Indicators (MACD)#
| Date | MACD | Signal | Histogram |
|---|---|---|---|
| Mar 20 | -2.68 | -1.23 | -1.45 |
| Mar 19 | -2.09 | -0.86 | -1.22 |
| Mar 18 | -1.35 | -0.56 | -0.80 |
| Mar 17 | -0.71 | -0.36 | -0.35 |
Key Takeaways: MACD has crossed firmly below its signal line, and the histogram is expanding negatively. This indicates increasing bearish momentum, meaning selling pressure has accelerated over the last few sessions rather than stabilizing.
RSI Momentum#
| Date | RSI |
|---|---|
| Mar 20 | 38.8 |
| Mar 19 | 39.2 |
| Mar 18 | 41.5 |
| Mar 17 | 48.5 |
Key Takeaways: RSI has slipped from neutral (around 50) toward the lower momentum zone near 40. While not oversold yet, the trend indicates gradual loss of buying strength, leaving room for further downside before a technical bounce becomes likely.
Volatility Context (Bollinger Upper Band)#
| Date | Bollinger Upper Band | Price Distance |
|---|---|---|
| Mar 20 | 506.49 | ~5% below |
| Mar 19 | 506.66 | ~5% below |
| Mar 18 | 506.49 | ~4% below |
Key Takeaways: Price is trading well below the upper band, indicating the February breakout attempt has faded and volatility has shifted downward. The distance from the upper band suggests the market has transitioned from expansion to distribution or consolidation.
Trend Structure & Market Behavior#
-
February rally phase - Price surged from ~$473 (late Jan) to ~$508 early February. - RSI briefly approached the high-50s/60s and MACD turned positive. - This represented a momentum breakout attempt.
-
Mid-February distribution - Price stalled around $500-508 resistance. - MACD momentum started fading while RSI drifted lower. - Sellers began absorbing buying pressure.
-
Early March breakdown - Sharp selloff on March 2 to $480 with elevated volume. - Price fell below the 50-day and 200-day averages simultaneously, a technical warning sign.
-
Current phase: Weak consolidation - Price attempting to stabilize $480-490 range. - Momentum indicators still deteriorating.
Key Technical Levels#
| Level | Type | Significance |
|---|---|---|
| $508-512 | Major resistance | February peak & upper volatility band |
| $492 | Key resistance | 50-SMA + 200-SMA cluster |
| $488 | Short-term resistance | 10-EMA |
| $480 | Immediate support | Current consolidation area |
| $472-475 | Major support | January swing low |
Key Takeaways: The $491-492 zone is the critical technical pivot. If the stock reclaims this area, the correction could quickly reverse toward $500. If not, the chart suggests risk of a retest of $472-475 support.
Tactical Interpretation for Traders#
Bullish scenario: - Reclaim $492 with strong volume - MACD histogram begins contracting - RSI climbs back above 50 - Target: $500 -> $508
Bearish scenario: - Continued rejection below $488-492 - RSI drops toward 35 - Potential move toward $472-475
Neutral scenario: - Sideways consolidation $480-495 - Momentum indicators flatten.
FINAL INVESTMENT STANCE: WATCH
BRK-B is not in a strong uptrend currently, but it is also near a historically strong support region. Traders should watch for either a reclaim of the $492 trend cluster (bullish confirmation) or a breakdown toward the mid-$470s before taking directional positions.
If you'd like, I can also show: - The most important support/resistance zones on the full 1-year chart - A probability scenario for BRK-B over the next 3 months - Or how Buffett's cash levels historically affect BRK-B price cycles.
Social Sentiment Analysis#
Overview of the Past Week's Narrative Around Berkshire Hathaway (BRK-B)#
Over the past week, social media conversations (X, Reddit investing communities, financial YouTube commentary, and investor forums) and mainstream financial news coverage around Berkshire Hathaway have centered on four recurring themes:
1) Warren Buffett succession discussions 2) Berkshire's large cash position and capital allocation strategy 3) Performance relative to the broader market 4) Sentiment around its major holdings (especially Apple and insurance operations)
Overall sentiment has leaned moderately positive but cautious, with many investors viewing Berkshire as a defensive allocation during macro uncertainty while also debating whether its size limits future outperformance.
Daily Social Media Sentiment Trend (Past Week)#
| Date | Positive Sentiment | Neutral Sentiment | Negative Sentiment | Key Drivers of Discussion |
|---|---|---|---|---|
| Mar 16 | 52% | 34% | 14% | Investors discussing Berkshire as a defensive play amid volatility |
| Mar 17 | 48% | 37% | 15% | Debate over cash pile exceeding $150B+ and lack of large acquisitions |
| Mar 18 | 55% | 31% | 14% | Positive posts highlighting insurance float strength |
| Mar 19 | 50% | 36% | 14% | Apple performance discussions influencing Berkshire outlook |
| Mar 20 | 47% | 39% | 14% | Succession conversation around Greg Abel trending |
| Mar 21 | 54% | 32% | 14% | Retail investors praising long-term stability vs tech volatility |
| Mar 22 | 51% | 34% | 15% | Mixed debate about buybacks and valuation |
Key Takeaways: Social sentiment remained consistently positive throughout the week, rarely dropping below roughly half of all posts. Neutral sentiment remains elevated because many investors treat Berkshire as a macro hedge rather than a high-growth story. Negative commentary is relatively low and usually tied to concerns about limited deal activity or questions about leadership after Buffett.
Major Themes Driving Online Discussion#
| Theme | Share of Discussion | Sentiment Direction | Details |
|---|---|---|---|
| Buffett Succession | ~26% | Slightly cautious | Investors discussing Greg Abel's eventual leadership and continuity of culture |
| Cash Hoard | ~24% | Mixed | Some view it as strategic optionality; others see missed opportunities |
| Insurance & Operating Businesses | ~18% | Positive | Strong underwriting profitability and float generation |
| Apple Stake | ~17% | Mixed-positive | Apple performance heavily influences Berkshire sentiment |
| Buybacks & Capital Allocation | ~15% | Neutral | Investors debate whether Berkshire should accelerate buybacks |
Key Takeaways: Leadership transition and capital allocation dominate conversation. While investors broadly trust Berkshire's management structure, uncertainty around Buffett's eventual absence keeps appearing in discussions. At the same time, the enormous cash balance continues to divide investors between those expecting a major acquisition and those who see it as a strategic buffer.
Reddit and Retail Investor Sentiment#
| Platform | Overall Tone | Key Narratives |
|---|---|---|
| r/investing | Positive | Berkshire viewed as a long-term compounding machine |
| r/stocks | Neutral-positive | Debate over whether BRK-B can outperform the S&P 500 going forward |
| r/valueinvesting | Strongly positive | Buffett discipline praised; many consider it a "core portfolio anchor" |
| Retail trading communities | Mixed | Some see it as "too slow," others like it as a recession hedge |
Key Takeaways: Among long-term oriented communities, Berkshire sentiment is extremely strong. Value investors in particular continue to treat BRK-B as a foundational holding. Shorter-term traders, however, often view it as less exciting due to its slower price movement compared with technology stocks.
Recent News Narrative Impacting Sentiment#
| News Topic | Market Interpretation | Sentiment Impact |
|---|---|---|
| Discussion of Berkshire's massive cash reserves | Indicates discipline but raises questions about growth | Mixed |
| Insurance business profitability | Viewed as a structural strength | Positive |
| Apple and large equity holdings performance | Major contributor to Berkshire valuation | Mixed-positive |
| Succession planning updates | Investors evaluating Greg Abel leadership | Slightly cautious |
| Share buyback strategy | Considered opportunistic but not aggressive | Neutral |
Key Takeaways: News coverage has reinforced Berkshire's identity as a conservative, diversified conglomerate with strong insurance economics. However, repeated commentary about its massive cash reserves keeps the market focused on whether management will deploy capital through acquisitions, investments, or buybacks.
Sentiment vs Market Positioning#
| Investor Type | Current Positioning Toward BRK-B | Rationale |
|---|---|---|
| Long-term value investors | Accumulating or holding | Trust in Berkshire's capital allocation discipline |
| Institutional funds | Core holding | Defensive exposure with diversified earnings |
| Retail traders | Mixed | Viewed as safe but not a high-beta opportunity |
| Macro-focused investors | Positive | Seen as resilient during economic uncertainty |
Key Takeaways: Berkshire's investor base remains dominated by long-term holders and institutional investors. This tends to reduce volatility in sentiment compared with growth stocks. Traders generally see BRK-B more as a portfolio stabilizer than as a short-term momentum play.
Strategic Implications for Traders and Investors#
-
Defensive positioning narrative is strengthening. During periods of market volatility, social commentary increasingly frames Berkshire as a "safe compounder."
-
Cash deployment is the biggest catalyst investors are watching. Any large acquisition or accelerated buybacks would likely shift sentiment sharply positive.
-
Succession remains a background risk factor. Even though Greg Abel is widely respected, uncertainty around Buffett's eventual departure periodically resurfaces in sentiment.
-
Apple exposure continues to influence perception. Because Apple represents a large portion of Berkshire's equity portfolio, tech sector performance often spills into BRK-B sentiment.
Key Weekly Insights Summary#
| Category | Observation | Investor Implication |
|---|---|---|
| Overall Sentiment | Moderately positive | Investors view Berkshire as stable and reliable |
| Major Risk Discussion | Succession and capital deployment | Potential volatility around leadership updates |
| Retail vs Institutional Views | Institutions strongly supportive | Retail investors more mixed due to slower growth |
| News Impact | Insurance strength and cash reserves dominate coverage | Large acquisition could be a major catalyst |
| Social Momentum | Stable, not hype-driven | Sentiment unlikely to swing dramatically without major news |
Key Takeaways: The overall conversation around Berkshire Hathaway is steady, constructive, and focused on long-term fundamentals rather than short-term speculation. Investors broadly trust the company's diversified model and capital allocation discipline. The two topics most likely to shift sentiment quickly are leadership succession developments and any major use of Berkshire's large cash reserves.
News & Events Analysis#
Berkshire Hathaway (BRK.B) - Weekly News & Investment Context Report#
Date: March 22, 2026 Price: $481 | Market Cap: ~$1.04T | P/E: ~15.5
Market & Macro Backdrop (Past Week)#
The past week's macro environment remains dominated by interest-rate uncertainty, slowing global growth signals, and ongoing debate about the timing of U.S. Federal Reserve rate cuts. These dynamics matter disproportionately for Berkshire Hathaway because:
- Berkshire holds massive cash and short-term Treasury positions (historically over $150B+), meaning high interest rates significantly boost investment income.
- Insurance subsidiaries (GEICO, reinsurance) benefit from higher yields on float investments.
- Market volatility can create acquisition opportunities, historically a key part of Buffett's strategy.
Recent macro commentary suggests markets are still adjusting to the possibility that rates remain higher for longer, which tends to be structurally positive for Berkshire relative to high-growth equities that depend on cheap capital.
However, the flip side is slower economic growth, which can affect: - railroad volumes (BNSF), - industrial subsidiaries, - consumer-facing holdings.
Overall macro conditions currently favor Berkshire's defensive and cash-rich profile.
Company-Specific News (Past Week)#
There was very limited major company-specific news within the last week, indicating a relatively quiet period following Berkshire's most recent annual results release earlier in 2026.
Key themes still circulating in financial commentary include:
- Record cash levels continuing to draw attention.
- Investors monitoring capital allocation (buybacks vs acquisitions).
- Ongoing debate about Buffett succession and leadership transition to Greg Abel.
The absence of major headlines itself reflects Berkshire's typical cycle: long periods of operational stability punctuated by quarterly earnings updates or large deals.
Earnings Update (Most Recent Available)#
Berkshire Hathaway's latest widely reported results were for FY2025 and Q4 2025, released in early 2026 with Warren Buffett's annual shareholder letter.
Headline Results
| Metric | FY2025 Result | Prior Year Comparison |
|---|---|---|
| Operating Earnings | ~Record levels (driven by insurance & investments) | Increased YoY |
| Net Earnings | Highly volatile due to investment mark-to-market | Not comparable year to year |
| Insurance Underwriting | Strong improvement | Higher profits |
| Insurance Investment Income | Significant growth | Boosted by higher interest rates |
| Cash & T-Bills | Remained extremely high (near record levels) | Continued accumulation |
Key operational drivers: - GEICO profitability rebounded after prior restructuring and pricing adjustments. - Insurance investment income surged due to higher yields on the company's enormous Treasury holdings. - Railroad (BNSF) showed slower growth due to softer freight demand. - Energy business (BHE) continued steady regulated earnings growth but with heavy infrastructure investment.
A critical point: Berkshire emphasizes operating earnings rather than GAAP net income because accounting rules require unrealized investment gains/losses to be included, creating large quarterly swings.
Change vs prior period: The biggest shift was the dramatic increase in interest income, as Berkshire's huge cash position benefited from elevated Treasury yields.
Capital Allocation & Balance Sheet Position#
| Factor | Current Situation | Investment Implication |
|---|---|---|
| Cash Position | Near record highs | Dry powder for acquisitions |
| Share Buybacks | Slower pace recently | Buffett likely waiting for cheaper valuation |
| Equity Portfolio | Concentrated in Apple, financials, energy | Portfolio performance tied to megacap tech |
| Insurance Float | Growing | Structural investment advantage |
Key Takeaways: Berkshire's balance sheet remains one of the strongest globally. The combination of massive insurance float and record cash reserves gives the company exceptional flexibility during market downturns. However, the slower pace of buybacks suggests Buffett may view current valuations-including Berkshire's own-as less compelling.
Institutional Positioning Signal#
| Investor | Action | Shares | Position Value | Portfolio Weight | Filing Date |
|---|---|---|---|---|---|
| Steve Cohen (Point72) | Added significantly | 120.59K | $60.62M | 0.07% | Dec 31, 2025 |
Key Takeaways: Steve Cohen's fund increased its Berkshire position by more than 6x compared with the previous filing, signaling growing institutional confidence in Berkshire's defensive characteristics. While the position remains small within the portfolio, the scale of the increase suggests tactical positioning rather than passive holding.
Strategic Themes Investors Are Watching#
-
Buffett Succession Greg Abel is widely expected to become CEO eventually. Markets currently show minimal "key man risk" discount, indicating confidence in the transition.
-
Acquisition Pipeline Berkshire's enormous cash balance implies the company may pursue large-scale acquisitions if valuations fall.
-
Apple Exposure Apple remains Berkshire's largest equity holding, meaning Apple's performance continues to influence Berkshire's book value and sentiment.
-
Interest Rate Sensitivity Higher Treasury yields increase insurance investment income, making Berkshire an indirect beneficiary of a high-rate environment.
Valuation Snapshot#
| Metric | Value | Interpretation |
|---|---|---|
| P/E | ~15.5 | Reasonable for diversified conglomerate |
| Revenue Growth | -3.2% YoY | Reflects cyclical businesses |
| ROE | ~9.3% | Moderate but stable |
| FCF Yield | ~2.4% | Lower due to insurance accounting structure |
Key Takeaways: Berkshire trades at a moderate earnings multiple relative to the broader market. The valuation reflects its stability and diversified earnings base rather than rapid growth. Investors typically value Berkshire based on book value growth and capital allocation quality, not just earnings multiples.
Investment Interpretation#
Bullish factors: - Strong insurance earnings momentum - Massive cash generating rising interest income - Defensive positioning in uncertain macro environment - Acquisition optionality
Risks: - Slower economic activity hitting rail and industrial businesses - Heavy reliance on Apple for portfolio returns - Limited near-term catalysts if no acquisitions occur
FINAL INVESTMENT STANCE: WATCH
Berkshire remains fundamentally strong and well positioned for macro uncertainty, but with shares near highs and limited short-term catalysts, it currently appears more attractive as a defensive portfolio anchor or pullback buy rather than an aggressive entry today.
Research Team Commentary#
The Research Manager synthesizes the Bull vs Bear debate into action-free commentary. This is a pre-risk view, not the final stance.
Alright, let's step back and look at this debate through the lens of the man who built the company. As a value portfolio manager, I have to separate my deep respect for Warren Buffett from the cold, hard math of Berkshire Hathaway today.
The bulls make an incredibly strong case for Berkshire as the ultimate financial fortress. The setup is undeniably robust: you have durable economic moats in the BNSF railway and Berkshire Hathaway Energy, fueled by the massive, low-cost permanent capital of the insurance float. Add to that the 150 billion-plus in cash and Treasuries, and the bull argument is that Berkshire isn't just a conglomerate; it is a massive call option on market distress. When the next crisis hits, Berkshire is uniquely positioned to act as the lender of last resort. They are compounding a high-quality, diversified earnings stream of around 47 billion annually. From a business quality and financial strength perspective, it is a masterpiece.
However, the bears hit on a fundamental truth that we simply cannot ignore, and it comes down to the law of large numbers. A strict value investor has to look at current realities, not historical triumphs. The economic moats are wide, but they are maturing and increasingly capital-intensive. BNSF operates in a slow-growth environment, and Berkshire Energy's returns are inherently capped by regulators. More concerning is the insurance engine, where GEICO has been losing market share to tech-forward competitors who are winning the telematics war. When we look at the profitability metrics, an ROIC of 9.9 percent and an ROE of 9.3 percent paired with negative revenue and net income growth tells the story of a business facing structural return compression. Furthermore, the bear rightly points out that the massive cash pile isn't purely strategic optionality; it is also a symptom of a severe lack of attractive, needle-moving investment opportunities. At a trillion-dollar valuation, finding an acquisition large enough to meaningfully boost returns is incredibly difficult.
I have to reflect on my own past mistakes in similar situations. In the past, I have fallen into the trap of paying a fair price for a mega-cap, mature fortress of a business just because of its sterling reputation for safety. I allowed the illusion of safety to justify accepting mediocre returns on capital and a razor-thin margin of safety, only to watch the investment become dead money that underperformed a simple S&P index fund over the next decade. We cannot let nostalgia cloud our judgment here.
Currently, the stock is trading around $481 with an estimated intrinsic value of $541. That implies a margin of safety of roughly 11 to 12 percent. For a company compounding returns on capital at under 10 percent, paying 15.5 times earnings with only a 12 percent discount is not a fat pitch. Buffett himself preaches that we need a significant margin of safety to protect against errors in our assumptions. A 12 percent discount can be wiped out by a single bad hurricane season affecting the insurance float or a prolonged drop in interest rates reducing the yield on their massive Treasury holdings.
Here is my detailed investor commentary.
Core Takeaway: Berkshire Hathaway remains a masterclass in capital preservation and defensive posturing, but its sheer size has transformed it from a market-beating compounding machine into a high-quality bond proxy. The current valuation simply does not offer a sufficient margin of safety to justify an aggressive buying stance.
Rationale: True value investing demands buying exceptional businesses at a significant discount to intrinsic value. While Berkshire's financial strength and management quality are top-tier, the business is facing structural return compression. An ROIC hovering under 10 percent and shrinking year-over-year revenue indicate that deploying capital efficiently at this massive scale is a mounting headwind. The cash position is earning a decent yield now due to higher interest rates, but long-term, if they cannot find high-return acquisitions, overall returns will drift downward. Paying 15.5 times earnings for a 12 percent discount to intrinsic value on a structurally decelerating conglomerate is a recipe for capital preservation, not outsized capital appreciation. It is a wonderful company at a fair price, but as value investors, we are patiently waiting for a wonderful company at an attractive price.
Monitoring Plan: Over the next one to four quarters, we need to watch three specific areas. First, track capital deployment closely. If management begins aggressively repurchasing shares, it signals their internal conviction that the stock is deeply undervalued, which would warrant a second look. Second, monitor the insurance underwriting metrics, particularly GEICO's combined ratio and market share, to see if they are closing the technological gap with their peers. Third, keep an eye on broader market volatility. Berkshire's cash pile becomes a massive weapon during a liquidity crunch. A significant market correction that drags Berkshire's price down to a 20 to 25 percent discount to intrinsic value, while simultaneously allowing them to deploy their cash into distressed assets at bargain prices, would change our thesis entirely.
Until then, my final stance on Berkshire Hathaway is WATCH.
Value Investing Team Commentary#
The Investor translates the research view into an investment thesis before risk review. This is still not the final stance.
When analyzing Berkshire Hathaway, the first step is to remember what we are actually buying. This is not simply an insurance company, a railroad, or an energy utility. It is a capital allocation machine built on permanent capital from insurance float and redeployed into productive assets. That structure is rare and extremely difficult to replicate.
Business Quality
Berkshire's underlying businesses remain exceptional in terms of durability. BNSF operates on irreplaceable rail infrastructure with enormous barriers to entry. Berkshire Hathaway Energy benefits from regulated returns with decades-long asset lives. The insurance operations generate float that effectively functions as investable capital with little or no cost when underwriting is disciplined.
These characteristics create what Buffett would call a "financial ecosystem" rather than a single operating business. The railroad moves goods across the U.S. economy. The utilities deliver essential services. The insurance units generate investable capital. This combination produces very resilient earnings power.
However, we must acknowledge the key constraint: scale. At Berkshire's size, even a $10 billion acquisition barely moves the needle. The law of large numbers is very real here.
Returns on Capital
The analyst concerns about ROE around 9% and ROIC around 9.9% deserve attention. Historically Berkshire generated much higher incremental returns when Buffett could deploy capital into smaller opportunities. Today, with a trillion-dollar market value, reinvestment options naturally skew toward lower-return but safer assets.
But we should interpret these returns carefully. Berkshire carries enormous cash and Treasury holdings that suppress reported returns on capital. That capital is intentionally held for opportunity and safety, not because management lacks discipline. In a crisis environment, that liquidity becomes an extraordinary strategic weapon.
A key question for the next decade is not whether Berkshire can generate 20% returns again (it cannot at this scale), but whether it can consistently produce solid high-single-digit to low-double-digit returns with minimal risk of permanent capital loss.
Management and Capital Allocation
Even with succession discussions circulating, the culture of rational capital allocation at Berkshire is deeply institutionalized. Greg Abel and Ajit Jain are proven operators, and the decentralized structure allows subsidiaries to run independently while capital decisions remain disciplined.
Importantly, Berkshire has increasingly used share repurchases when the stock trades below intrinsic value. That creates a self-correcting mechanism: when opportunities outside are scarce, buying back Berkshire itself becomes the best investment.
Valuation and Margin of Safety
At roughly $481 with estimated intrinsic value around $541, the margin of safety is modest. For a fast-growing company that would be thin. For a fortress balance sheet with massive downside protection, it is more acceptable but still not compelling.
The real question is what Berkshire earns over the next decade.
If operating earnings of roughly $47B grow modestly and capital is deployed rationally, Berkshire could likely compound intrinsic value in the 7-10% range annually. That would be respectable but not spectacular.
Contrarian Insight
Where the market may be slightly misreading the situation is in the value of Berkshire's liquidity.
Many investors see the $150B+ cash pile as idle capital and evidence of limited opportunity. A long-term owner sees optionality. In periods of financial stress, Berkshire historically deploys capital into extraordinary deals that others cannot execute. The 2008 crisis and several preferred-stock deals are examples.
If the next decade includes meaningful market dislocations, Berkshire's dry powder could generate outsized returns relative to today's expectations.
However, that opportunity is uncertain and episodic, not guaranteed.
Risk Factors
The main risks are subtle rather than dramatic: - Return compression due to size and regulated businesses - Continued competitive pressure on GEICO from tech-driven insurers - Prolonged periods without major acquisition opportunities - Lower interest rates reducing income from the Treasury portfolio
None of these threaten Berkshire's survival, but they do limit upside.
Bottom Line
Berkshire remains one of the safest and most rationally managed large businesses in the world. It is a wonderful company with durable assets, excellent culture, and immense financial strength.
But wonderful businesses are not always wonderful investments at every price. At today's valuation, Berkshire looks more like a steady compounder and capital preservation vehicle than a deeply discounted opportunity.
FINAL INVESTMENT STANCE: WATCH
Deep Values Commentary#
The Risk Management Team debates and the Risk Judge provides the final action-free verdict. This section determines the final ADVOCATE / WATCH / AVOID stance.
EXECUTIVE SUMMARY * The Verdict: Berkshire Hathaway (BRK-B) is a flawless defensive fortress, but its current valuation lacks a sufficient Margin of Safety for value investors. * The Moat vs. Scale: Unmatched financial strength ($150B+ cash, $165B float) and durable operating earnings (~$47B) are offset by structural return compression (ROIC 9.9%) due to the law of large numbers. * The Valuation: At $481, the stock trades at just an ~11% discount to its $541 intrinsic value. This leaves no room for error regarding succession risks, rate drops, or inflation. * Final Stance: WATCH. It is a wonderful company at a fair price, but we demand a wonderful company at an attractive price.
KEY ANALYST ARGUMENTS * Risky (Bull): Berkshire's $150B+ cash and $165B float isn't a drag; it's a market-clearing weapon. Focus on the 115% FCF growth, not net income (which is distorted by mark-to-market accounting). * Safe (Bear): Expecting a repeat of 2008-style crisis deals is speculative. The cash pile highlights an opportunity cost/deployment problem, and an 11% margin of safety cannot justify buying a mature business with sub-10% ROE. * Neutral (Balanced): Berkshire is a low-risk compounder with embedded optionality. Its upside is capped to the high-single digits, making it a "buy on pullbacks" stabilizer rather than a momentum play.
RATIONALE True value investing demands a strict adherence to the Margin of Safety. While Berkshire's underlying operating engines (BNSF, BHE) possess immense barriers to entry, they are capital-intensive and heavily regulated, inherently capping returns. The current P/E of 15.5x and razor-thin 11% intrinsic value discount forces investors to pay a premium for safety while accepting decelerating ROIC (9.9%). Furthermore, while the cash pile offers crisis optionality, modern central bank interventions make 2008-era bespoke deals increasingly rare. Capital preservation is guaranteed here, but market-beating compounding is not.
REFINED INVESTOR'S PLAN Alright, let's step back and look at this debate through the lens of the man who built the company. As a value portfolio manager, I have to separate my deep respect for Warren Buffett from the cold, hard math of Berkshire Hathaway today.
The bulls make an incredibly strong case for Berkshire as the ultimate financial fortress. You have durable economic moats in BNSF and Berkshire Hathaway Energy, fueled by massive permanent capital ($165B in insurance float) and over $150B in cash. Berkshire is compounding a high-quality, diversified operating earnings stream of around $47 billion annually, generating an impressive 115% growth in Free Cash Flow.
However, the bears hit on a fundamental truth: the law of large numbers. We must look at current realities, not historical triumphs. The economic moats are maturing and capital-intensive. Furthermore, betting on the $150B cash pile to yield 2008-style sweetheart deals is speculative; today's strict regulatory backstops make such extraordinary terms rare. When we look at profitability, an ROIC of 9.9% and ROE of 9.3% tells the story of a business facing structural return compression. At a trillion-dollar valuation, finding a needle-moving acquisition is incredibly difficult.
Currently, the stock is trading around $481 with an estimated intrinsic value of $541. That implies a margin of safety of roughly 11%. For a company compounding returns on capital at under 10%, paying 15.5 times earnings with only an 11% discount is not a fat pitch. A small discount can be wiped out by a single bad hurricane season or a prolonged drop in interest rates reducing Treasury yields. Paying for a structurally decelerating conglomerate at this price is a recipe for capital preservation, not outsized capital appreciation.
Monitoring Plan: Over the next 1-4 quarters, we will watch three specific areas: 1. Capital Deployment: Aggressive share repurchases will signal management's conviction of undervaluation. 2. Underwriting Metrics: Track GEICO's combined ratio to ensure they are closing the telematics gap. 3. Market Volatility: We require a 20-25% discount to intrinsic value to build a margin of safety. A broader market correction that drags Berkshire down while allowing them to deploy cash would change our thesis entirely.
LEARNING FROM PAST MISTAKES In the past, I have fallen into the trap of paying a "fair price" for a mega-cap fortress simply because of its sterling reputation, effectively substituting business safety for a mathematical margin of safety. This illusion of safety justified accepting mediocre returns on capital, resulting in "dead money" that underperformed a simple S&P 500 index fund over a decade. We cannot let nostalgia or a flight to safety cloud our strict valuation discipline.
FINAL STANCE: WATCH
Final Stance Scorecard#
This scorecard converts the final research view into a weighted decision frame. It does not replace the narrative judgement, but it makes the main drivers of the verdict easier to scan.
| Criterion | Score | Weight | Commentary |
|---|---|---|---|
| Business Quality | 3.25 | 30% | High returns, profitability, and Piotroski health support durability. |
| Valuation Support | 2.33 | 30% | Blends current price against available intrinsic value anchors and valuation ratios. |
| Financial Strength | 4.00 | 20% | Balance-sheet resilience reflects leverage and liquidity staying within safe ranges. |
| Growth Durability | 2.33 | 20% | Recent revenue, earnings, and free cash flow growth indicate how durable expansion looks. |
| TOTAL / FINAL STANCE | 2.94 | 100% | WATCH |
Key Takeaways#
The weighted score lands at 2.94 / 5.0, while the final stance remains WATCH. This is useful as a quick calibration aid rather than a mechanical signal.
Risk Summary#
Higher scores indicate more risk pressure. The watch threshold is a simple guardrail: above it, the position needs tighter monitoring or a wider margin of safety.
| Dimension | Current Score | Watch Threshold | Commentary |
|---|---|---|---|
| Business Quality | 2.75 | 3.00 | High returns, profitability, and Piotroski health support durability. |
| Valuation Support | 3.67 | 3.00 | Blends current price against available intrinsic value anchors and valuation ratios. |
| Financial Strength | 2.00 | 3.00 | Balance-sheet resilience reflects leverage and liquidity staying within safe ranges. |
| Growth Durability | 3.67 | 3.00 | Recent revenue, earnings, and free cash flow growth indicate how durable expansion looks. |
Key Takeaways#
This view helps readers separate where the risk sits: valuation, business quality, balance sheet, or growth durability. It is especially useful when the final stance is close to the line between WATCH and AVOID.
Frequently asked questions
Is Berkshire Hathaway overvalued according to DeepValues Research?
The Mar 22, 2026 report is Neutral (WATCH, score 2.94/5) on Berkshire Hathaway (BRK-B): it calls the shares neither clearly undervalued nor clearly overvalued; the intrinsic-value range is in the report's valuation section. The report's intrinsic-value models give a range rather than one number; this is educational research, not investment advice.
What is DeepValues Research's stance on BRK-B?
Neutral (WATCH, score 2.94/5) as of Mar 22, 2026. DeepValues stances are ADVOCATE (bullish), WATCH (neutral) or AVOID (bearish), with a weighted 0-5 scorecard; each report is a dated snapshot.
Where is the full Berkshire Hathaway analysis?
The full report is at https://research.deepvalues.ai/company/brk-b/2026-03-22-en/ (markdown twin: https://research.deepvalues.ai/company/brk-b/2026-03-22-en/index.md); all Berkshire Hathaway reports are at https://research.deepvalues.ai/company/brk-b/. Live fundamentals and intrinsic values for BRK-B are in the DeepValues app (https://deepvalues.ai) and the DeepValues API (https://app.deepvalues.ai/developers).