
Company Research BRK-BDeep Value Intelligence
Berkshire Hathaway (BRK-B) Deep Value Intelligence Report

In briefNeutral3.21
As of Apr 23, 2026, DeepValues Research rates Berkshire Hathaway (BRK-B) Neutral (WATCH, score 3.21/5). Berkshire Hathaway remains an exceptionally durable business with fortress finances, dominant real-asset subsidiaries, and a long record of disciplined capital allocation. Key figures: share price $471; P/E (TTM) 15.15; free-cash-flow yield 2.5%; ROE 9.3%.
Source: https://research.deepvalues.ai/company/brk-b/2026-04-23-en/ · Markdown · More on Berkshire Hathaway (BRK-B)
Contents
- Intelligence Summary
- Thesis + Conditions
- Analyst Team Reports
- Fundamentals Analysis
- Intrinsic Value Analysis (Buffett)
- Trend & Growth Analysis (Lynch/Druckenmiller/Fisher)
- Market Technical Analysis
- Social Sentiment Analysis
- News & Events Analysis
- Research Team Commentary
- Value Investing Team Commentary
- Deep Values Commentary
Intelligence Summary#
Thesis + Conditions#
Core Thesis: Executive Summary Berkshire Hathaway remains an exceptionally durable business with fortress finances, dominant real-asset subsidiaries, and a long record of disciplined capital allocation. The debate isn't about business quality-it's about future returns from today's price.
Key Risks: - Berkshire Hathaway remains an exceptionally durable business with fortress finances, dominant real-asset subsidiaries, and a long record of disciplined capital allocation. The debate isn't about business quality-it's about future returns from today's price. With ROE around 9-10% and limited organic growth, Berkshire is likely transitioning into a steady "stalwart" compounder rather than a high-return allocator. At ~15x earnings and near recent highs, the margin of safety is thin. However, the balance sheet, insurance float, and $150B+ liquidity provide powerful downside protection and potential upside during market stress. The risk is not business impairment but mediocre entry pricing. Verdict: attractive business, but patience improves odds. - Risky Analyst (Bullish View) - Safe Analyst (Risk-Focused View) - Succession risk is another credible factor. Buffett's reputation historically reinforced discipline across Berkshire's decentralized system. Even if operations continue smoothly, the market could compress the valuation multiple after Buffett's departure. - Risk Commentary Using the Buffett Framework
What Would Change Our View: - Berkshire Hathaway remains an exceptionally durable business with fortress finances, dominant real-asset subsidiaries, and a long record of disciplined capital allocation. The debate isn't about business quality-it's about future returns from today's price. With ROE around 9-10% and limited organic growth, Berkshire is likely transitioning into a steady "stalwart" compounder rather than a high-return allocator. At ~15x earnings and near recent highs, the margin of safety is thin. However, the balance sheet, insurance float, and $150B+ liquidity provide powerful downside protection and potential upside during market stress. The risk is not business impairment but mediocre entry pricing. Verdict: attractive business, but patience improves odds. - Risky Analyst (Bullish View) - Safe Analyst (Risk-Focused View) - Succession risk is another credible factor. Buffett's reputation historically reinforced discipline across Berkshire's decentralized system. Even if operations continue smoothly, the market could compress the valuation multiple after Buffett's departure. - Risk Commentary Using the Buffett Framework
Confidence: Low
Analyst Team Reports#
Fundamentals Analysis#
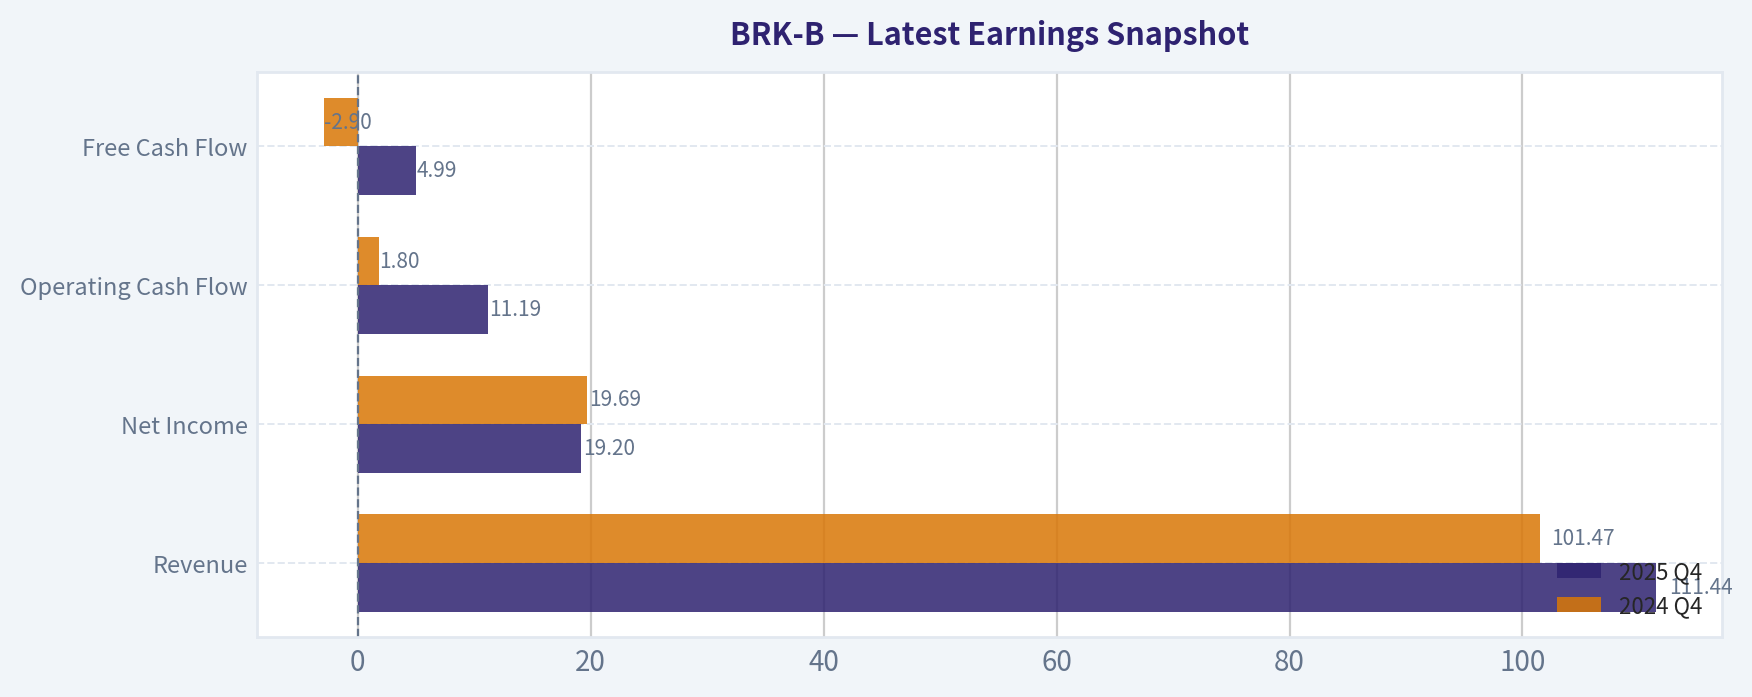
Latest Earnings Snapshot#
Most recent reported quarter anchored on 2025 Q4, with prior-year comparison when available.
| Metric | 2025 Q4 | 2024 Q4 | YoY Change |
|---|---|---|---|
| Revenue | $111.44B | $101.47B | +9.8% |
| Operating Income | N/A | N/A | N/A |
| Net Income | $19.20B | $19.69B | -2.5% |
| Diluted EPS | N/A | N/A | N/A |
| Operating Cash Flow | $11.19B | $1.80B | +520.7% |
| Free Cash Flow | $4.99B | $-2.90B | +272.2% |
Key Takeaways: This snapshot anchors the most recent reported quarter before the narrative analysis. It helps readers separate long-run business quality from whatever changed in the latest earnings print.
10-Year Financial Metrics for BRK-B#
All values below are computed deterministically from raw data - not estimated by AI.
Issuer profile: insurer (Financial Services / Insurance - Diversified).
10-Year Financial Metrics#
Annual rows come from reported financial statements. The final TTM row is computed from the latest four quarters.
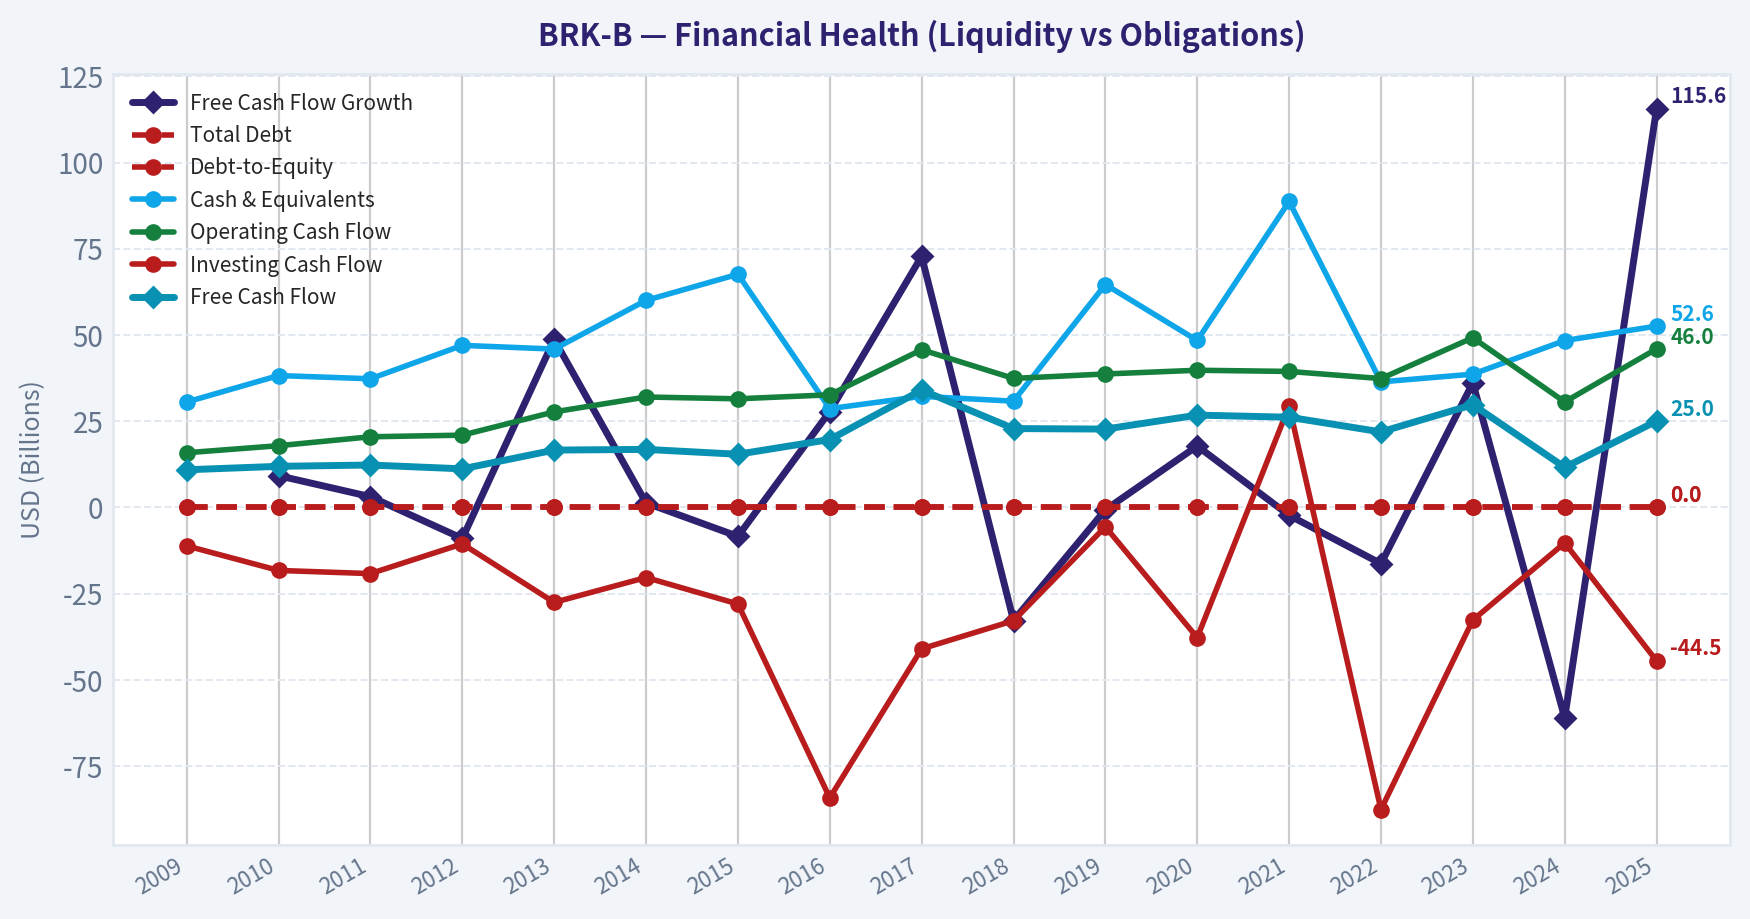
| Metric | 2009 | 2010 | 2011 | 2012 | 2013 | 2014 | 2015 | 2016 | 2017 | 2018 | 2019 | 2020 | 2021 | 2022 | 2023 | 2024 | 2025 |
|---|---|---|---|---|---|---|---|---|---|---|---|---|---|---|---|---|---|
| Market Price | $66 | $80 | $76 | $90 | $119 | $150 | $132 | $163 | $198 | $204 | $226 | $232 | $299 | $309 | $357 | $453 | $503 |
| Market Cap | N/A | $88.1M | $71.7M | N/A | N/A | N/A | N/A | N/A | N/A | N/A | N/A | N/A | $677.32B | $680.60B | $775.14B | $977.53B | $1.01T |
| P/E Ratio | 19.12 | 0.01 | 0.01 | 14.93 | 15.01 | N/A | 13.53 | 16.75 | 10.82 | 125.05 | 6.80 | 12.77 | 7.53 | -29.90 | 8.06 | 10.98 | 15.16 |
| P/B Ratio | 0.83 | 0.00 | 0.00 | N/A | N/A | N/A | 1.28 | 1.43 | 1.40 | 1.44 | 1.30 | 1.24 | 1.34 | 1.44 | 1.38 | 1.51 | 1.41 |
| ROE | 6.1% | 8.2% | 6.2% | 7.9% | 8.8% | 8.3% | 9.4% | 8.5% | 12.9% | 1.2% | 19.2% | 9.6% | 17.8% | -4.8% | 17.1% | 13.7% | 9.3% |
| ROIC | 9.1% | 12.2% | 8.7% | 11.4% | 12.5% | 11.3% | 13.3% | 11.1% | 15.9% | 1.4% | 24.1% | 11.6% | 22.6% | -5.1% | 20.2% | 15.9% | 10.6% |
| EPS | N/A | $11788.18 | $10908.51 | N/A | N/A | N/A | N/A | N/A | N/A | N/A | N/A | N/A | $39.70 | $-10.33 | $44.27 | $41.27 | $33.17 |
| Revenue | $112.49B | $136.19B | $143.69B | $162.46B | $182.15B | $194.70B | $210.94B | $215.11B | $239.93B | $247.84B | $254.62B | $245.58B | $276.19B | $302.02B | $364.48B | $371.43B | $371.44B |
| Gross Profit | N/A | N/A | N/A | N/A | N/A | N/A | N/A | N/A | N/A | N/A | N/A | N/A | N/A | N/A | N/A | N/A | N/A |
| Gross Margin | N/A | N/A | N/A | N/A | N/A | N/A | N/A | N/A | N/A | N/A | N/A | N/A | N/A | N/A | N/A | N/A | N/A |
| Operating Margin | 10.3% | 14.0% | 10.7% | 13.7% | 15.8% | 14.4% | 16.6% | 15.7% | 9.9% | 1.6% | 40.3% | 22.7% | 40.5% | -10.1% | 33.0% | 29.7% | 22.2% |
| Net Income | $8.05B | $12.97B | $10.25B | $14.82B | $19.48B | $19.87B | $24.08B | $24.07B | $44.94B | $4.02B | $81.42B | $42.52B | $89.94B | $-22.76B | $96.22B | $89.00B | $66.97B |
| Net Margin | 7.2% | 9.5% | 7.1% | 9.1% | 10.7% | 10.2% | 11.4% | 11.2% | 18.7% | 1.6% | 32.0% | 17.3% | 32.6% | -7.5% | 26.4% | 24.0% | 18.0% |
| Revenue Growth | N/A | 21.1% | 5.5% | 13.1% | 12.1% | 6.9% | 8.3% | 2.0% | 11.5% | 3.3% | 2.7% | -3.5% | 12.5% | 9.4% | 20.7% | 1.9% | 0.0% |
| Net Income Growth | N/A | 61.0% | -20.9% | 44.6% | 31.4% | 2.0% | 21.2% | -0.0% | 86.7% | -91.1% | 1924.8% | -47.8% | 111.5% | -125.3% | -522.8% | -7.5% | -24.8% |
| Free Cash Flow Growth | N/A | 9.2% | 3.1% | -9.0% | 48.7% | 1.3% | -8.4% | 27.8% | 72.8% | -32.8% | -0.7% | 17.8% | -2.3% | -16.3% | 36.1% | -61.0% | 115.6% |
| Total Book Value | $131.10B | $157.32B | $164.85B | $187.65B | $221.89B | $240.17B | $255.55B | $282.07B | $348.30B | $348.70B | $424.79B | $443.16B | $506.20B | $473.42B | $561.27B | $649.37B | $717.42B |
| Total Assets | $297.12B | $372.23B | $392.65B | $427.45B | $484.62B | $525.87B | $552.26B | $620.85B | $702.10B | $707.79B | $817.73B | $873.73B | $959.39B | $948.47B | $1.07T | $1.15T | $1.22T |
| Total Debt | $0 | $0 | $0 | $0 | $0 | $0 | $0 | $0 | $0 | $0 | $0 | $0 | $0 | $0 | $0 | $0 | $0 |
| Debt-to-Equity | 0.00 | 0.00 | 0.00 | 0.00 | 0.00 | 0.00 | 0.00 | 0.00 | 0.00 | 0.00 | 0.00 | 0.00 | 0.00 | 0.00 | 0.00 | 0.00 | 0.00 |
| Cash & Equivalents | $30.56B | $38.23B | $37.30B | $46.99B | $45.91B | $60.03B | $67.60B | $28.64B | $32.21B | $30.81B | $64.63B | $48.40B | $88.71B | $36.40B | $38.64B | $48.38B | $52.57B |
| Shareholders' Equity | $131.10B | $157.32B | $164.85B | $187.65B | $221.89B | $240.17B | $255.55B | $282.07B | $348.30B | $348.70B | $424.79B | $443.16B | $506.20B | $473.42B | $561.27B | $649.37B | $717.42B |
| Operating Cash Flow | $15.85B | $17.89B | $20.48B | $20.95B | $27.70B | $32.01B | $31.49B | $32.65B | $45.73B | $37.40B | $38.69B | $39.77B | $39.43B | $37.35B | $49.20B | $30.59B | $45.97B |
| Investing Cash Flow | $-11.16B | $-18.28B | $-19.19B | $-10.57B | $-27.54B | $-20.33B | $-28.00B | $-84.22B | $-41.01B | $-32.85B | $-5.62B | $-37.76B | $29.39B | $-87.60B | $-32.66B | $-10.29B | $-44.49B |
| Free Cash Flow | $10.91B | $11.91B | $12.29B | $11.18B | $16.62B | $16.82B | $15.41B | $19.69B | $34.02B | $22.86B | $22.71B | $26.76B | $26.15B | $21.89B | $29.79B | $11.62B | $25.04B |
| FCF Margin | 9.7% | 8.7% | 8.5% | 6.9% | 9.1% | 8.6% | 7.3% | 9.2% | 14.2% | 9.2% | 8.9% | 10.9% | 9.5% | 7.2% | 8.2% | 3.1% | 6.7% |
| Dividends / Share | N/A | $0.00 | $0.00 | N/A | N/A | N/A | N/A | N/A | N/A | N/A | N/A | N/A | $0.00 | $0.00 | $0.00 | $0.00 | $0.00 |
Profitability Metrics#
- Return on Equity (ROE): 9.3%
- Return on Invested Capital (ROIC): 10.1%
- Return on Assets (ROA): 5.5%
- Gross Margin: Not meaningful
- Operating Margin: 22.2%
- Net Profit Margin: 18.0%
Liquidity Metrics#
- Current Ratio: Not meaningful
- Quick Ratio: Not meaningful
Leverage Metrics#
- Debt-to-Equity Ratio: 0.00
- Interest Coverage Ratio: 16.27
- Net Debt: $-52.57B
Growth Metrics (Year-over-Year)#
- Revenue Growth: 0.0%
- Net Income Growth: -24.8%
- Free Cash Flow Growth: 115.6%
- Revenue CAGR (3-Year): 7.1%
- Revenue CAGR (5-Year): 8.6%
Valuation Metrics#
- P/E Ratio (TTM): 15.15
- Forward P/E: 21.63
- Price-to-Book: 1.41
- Price-to-Sales: 2.73
- PEG Ratio: 10.06
- EV/EBITDA: -2.12
- Free Cash Flow Yield: 2.5%
- Earnings Yield: 6.6%
Owner Earnings (Buffett Method, Code-Computed)#
- Net Income: $66.97B
-
- Depreciation & Amortization: $13.48B
-
- Capital Expenditures: $-20.93B
-
- Working Capital Changes: $2.35B
- = Owner Earnings: $57.16B
Intrinsic Value (Code-Computed)#
- Current Price: $471
- Buffett Method (Owner Earnings): Conservative: $79 Average: $722 Optimistic: $2,652
- Cash Flow Method (FCF): Conservative: $111 Average: $188 Optimistic: $350
Piotroski F-Score: 3/9#
- Positive Net Income: PASS
- Positive Operating Cash Flow: PASS
- ROA Improvement: FAIL
- Cash Flow > Net Income: FAIL
- Decreasing Debt: FAIL
- Improving Current Ratio: FAIL
- No Dilution: PASS
- Improving Gross Margin: FAIL
- Improving Asset Turnover: FAIL
Market Metrics (Current vs Historical Context)#
| Metric | Current (2025) | 10Y Context / Trend | Interpretation |
|---|---|---|---|
| Market Price | $503 (dataset latest) / ~$471 current | Long-term steady rise from $198 (2017) | Strong compounding reflecting retained earnings and buybacks |
| Market Cap | ~$1.01T | Rapid expansion since ~$677B in 2021 | Berkshire has become a trillion-dollar diversified conglomerate |
| P/E Ratio | 15.16 | Typically ranged ~10-16 excluding accounting distortions | Near historical norm |
| P/B Ratio | 1.41 | Historically ~1.24-1.51 since 2015 | Fair relative to book value growth |
Key Takeaways: Berkshire's valuation multiples are close to its long-term norms. The stock historically trades around 1.3-1.5x book and a mid-teens earnings multiple. Today's valuation sits almost exactly in that band, suggesting the market views the company as a stable compounder rather than a high-growth story.
Profitability Trends#
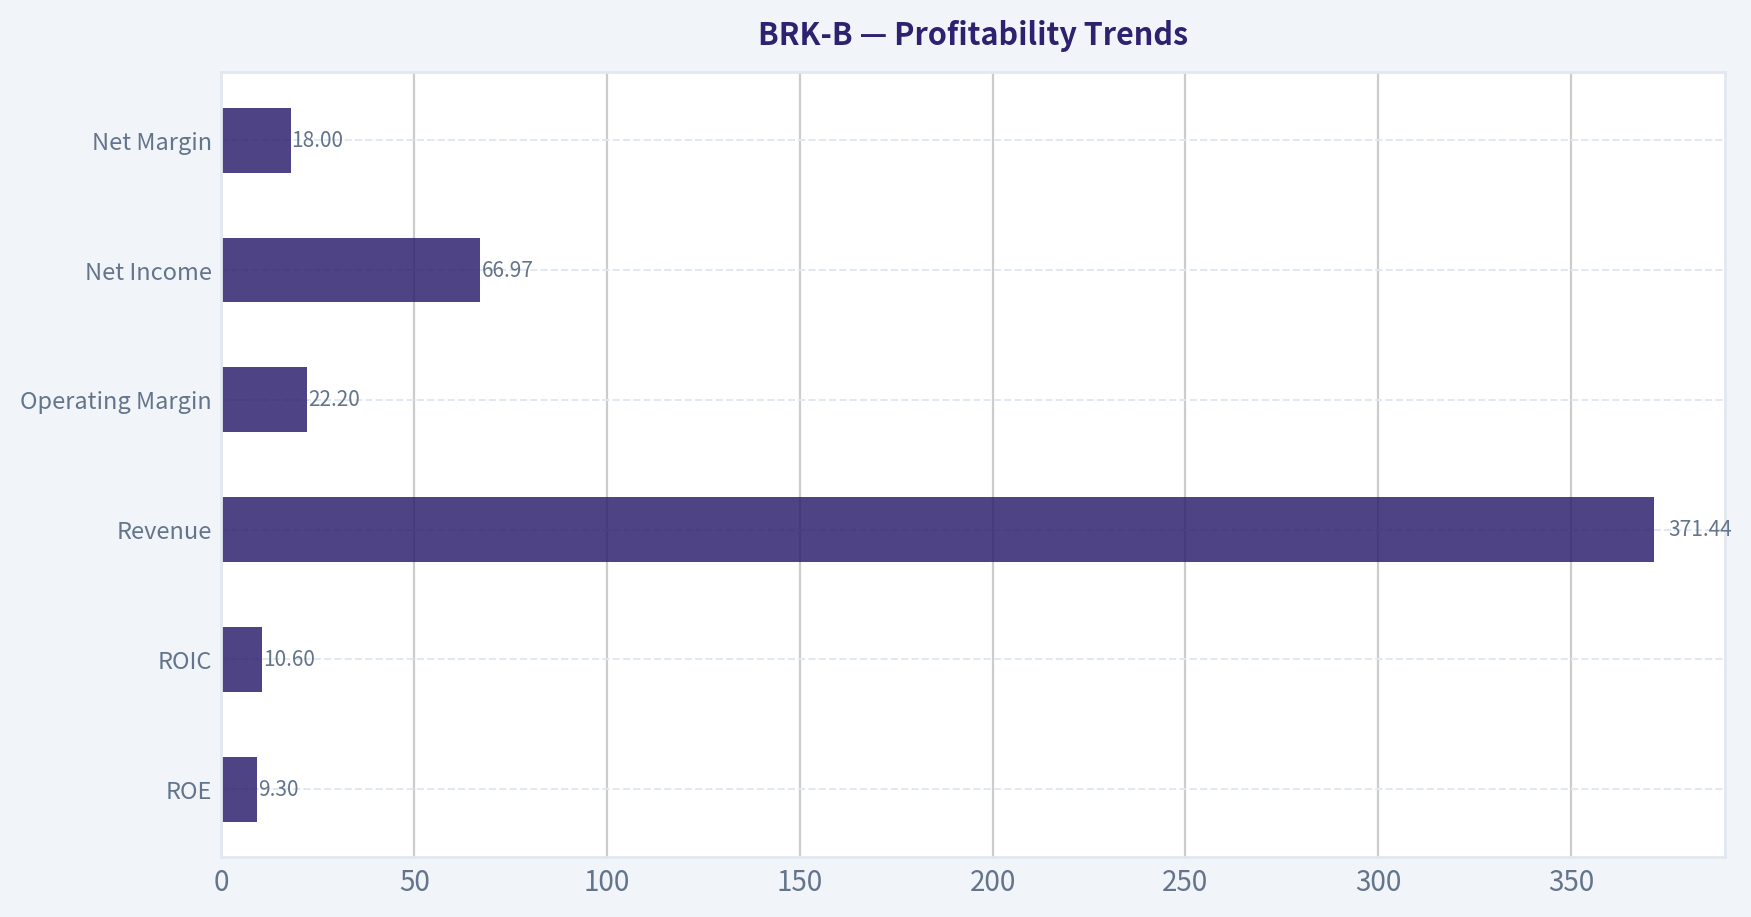
| Metric | Current | 10-Year Pattern | Insight |
|---|---|---|---|
| ROE | 9.3% | Mostly 8-13% with spikes from equity gains | Moderate but consistent |
| ROIC | 10.6% | Generally 11-16% excluding volatility | Solid capital efficiency |
| Revenue | $371.44B | Up from $239.93B in 2017 | Durable expansion |
| Operating Margin | 22.2% | Wide swings (insurance + investment accounting) | Structural variability |
| Net Income | $66.97B | Extremely volatile due to mark-to-market investments | Accounting noise |
| Net Margin | 18.0% | Range roughly 7-32% | Depends on investment gains |
Key Takeaways: Berkshire's accounting earnings fluctuate heavily because GAAP requires unrealized investment gains to flow through net income. Operationally, however, the business generates durable profits with ROIC consistently around or above 10%, which is a strong indicator of economic value creation.
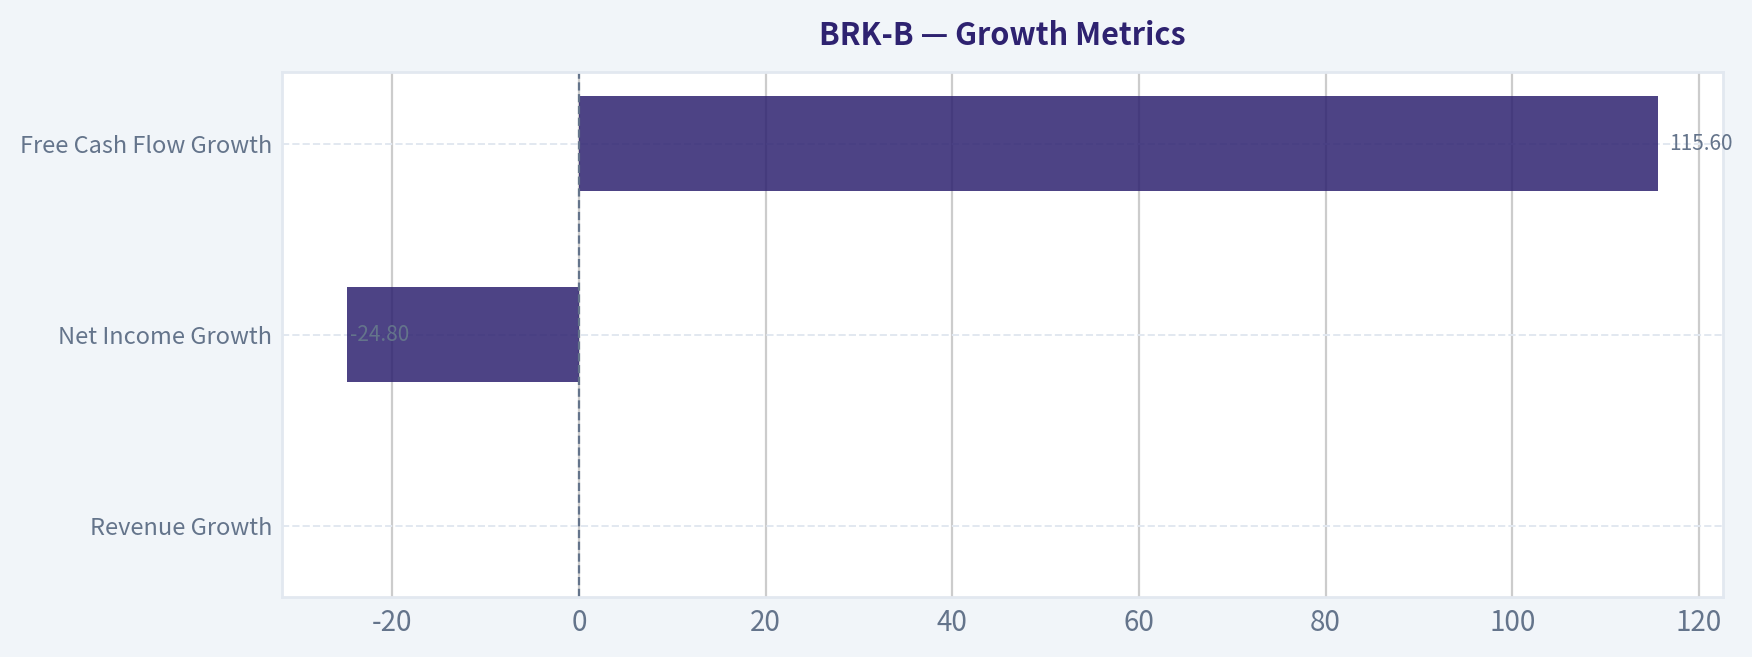
Growth Metrics#
| Metric | Latest YoY | Long-Term Pattern |
|---|---|---|
| Revenue Growth | 0.0% | 5-9% CAGR historically |
| Net Income Growth | -24.8% | Highly volatile |
| Free Cash Flow Growth | +115.6% | Cyclical but positive over long horizon |
| Revenue CAGR | ~7.1% (3Y) / 8.6% (5Y) | Healthy for a $1T conglomerate |
Key Takeaways: Revenue growth is slowing simply due to scale. However, long-term growth around 7-9% for a trillion-dollar company is impressive. Cash flow volatility is largely tied to capital deployment timing rather than operating weakness.
Balance Sheet Strength#
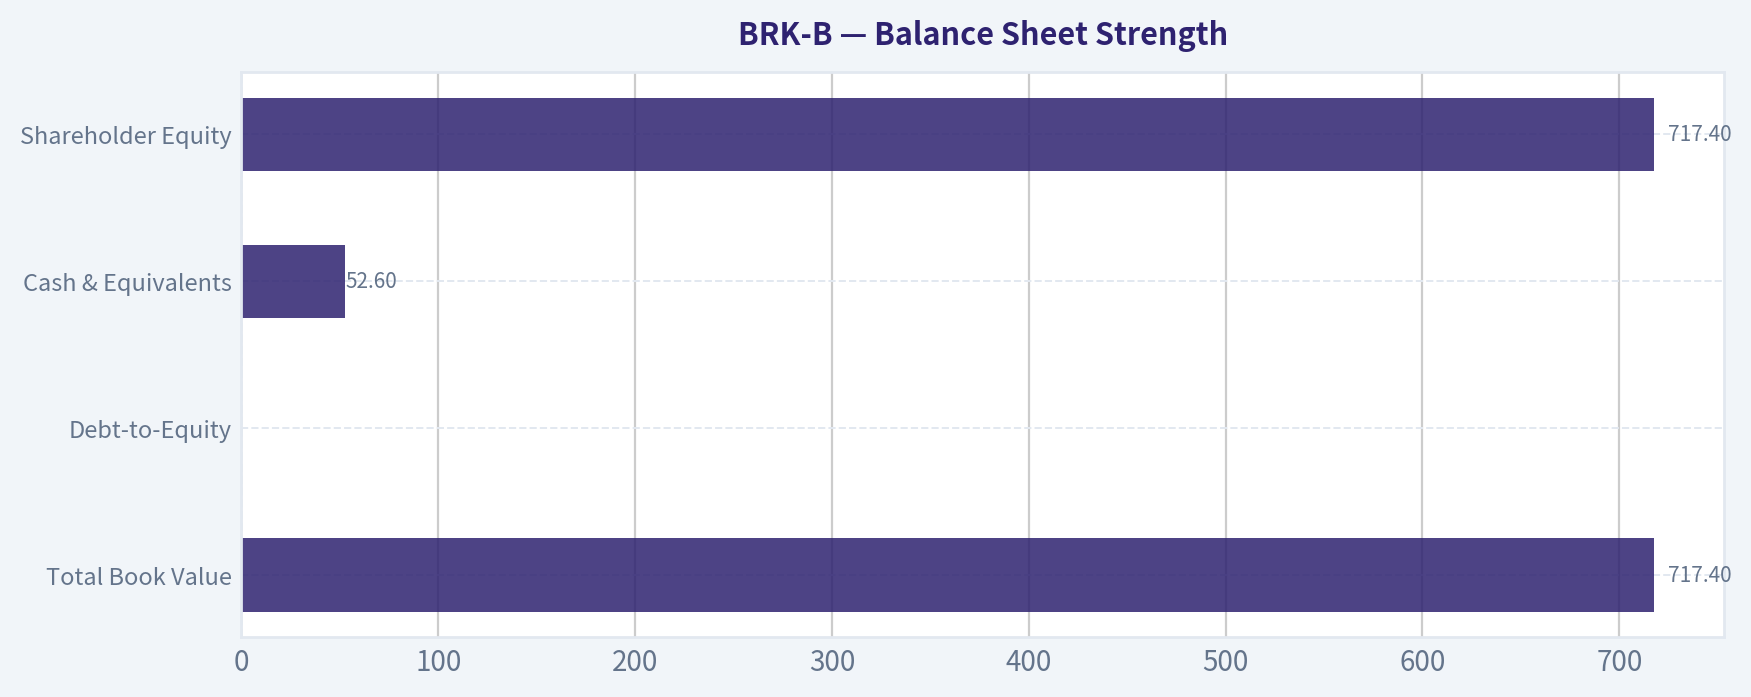
| Metric | Latest | Trend |
|---|---|---|
| Total Assets | $1.22T | Continuous growth |
| Total Book Value | $717.4B | Compounding steadily |
| Total Debt | $0 (dataset) | Extremely conservative structure |
| Debt-to-Equity | 0.00 | Minimal financial leverage |
| Cash & Equivalents | $52.6B | Large liquidity cushion |
| Shareholder Equity | $717.4B | Up from $348B in 2017 |
Key Takeaways: Berkshire's balance sheet is one of the strongest in corporate America. Enormous equity and cash reserves provide both safety and optionality for acquisitions or market dislocations.
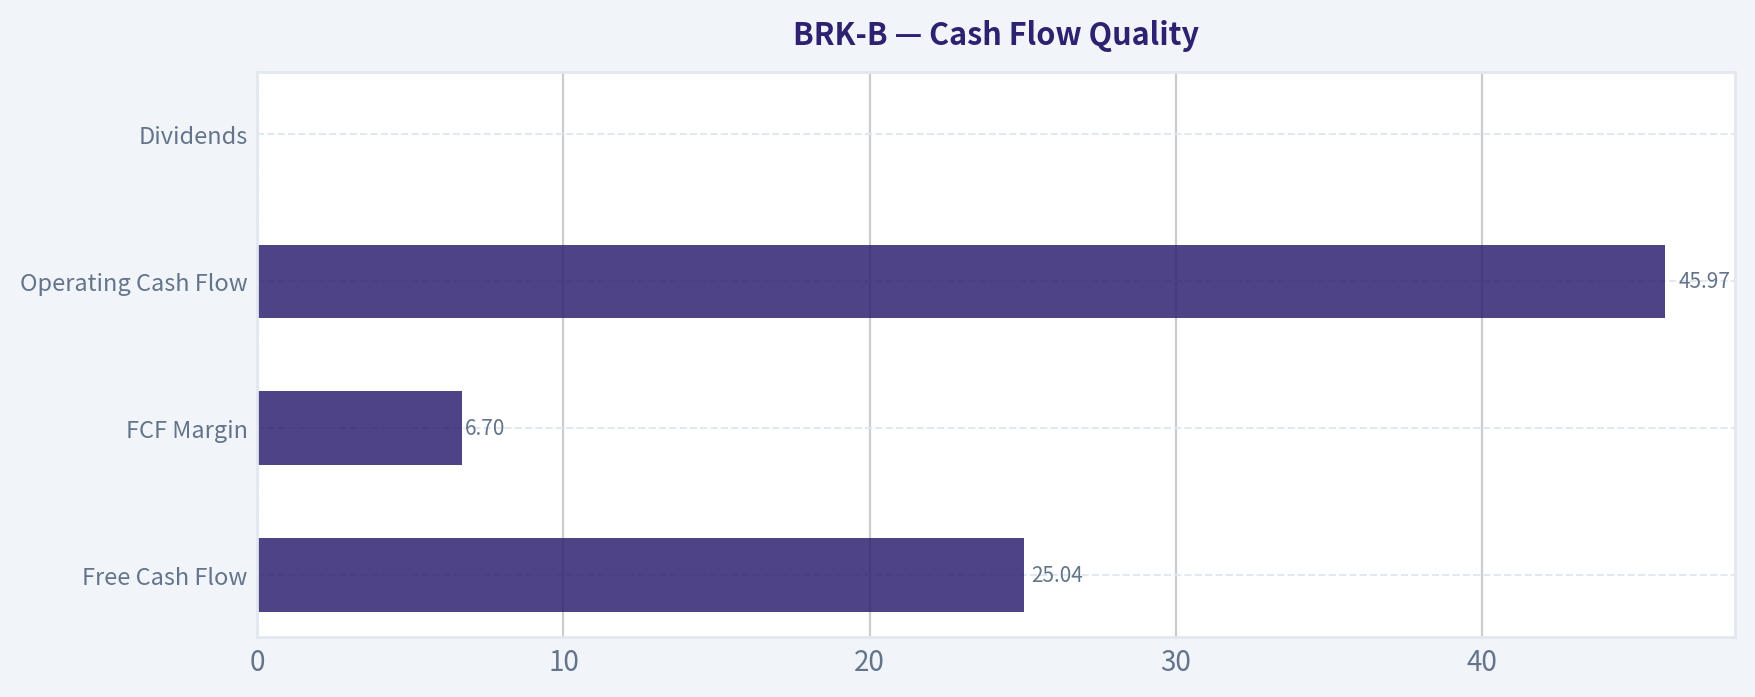
Cash Flow Quality#
| Metric | Current | Historical Context |
|---|---|---|
| Free Cash Flow | $25.04B | Long-term upward trend |
| FCF Margin | 6.7% | Generally 7-10% historically |
| Operating Cash Flow | $45.97B | Strong and consistent |
| Dividends | $0 | Buffett prefers reinvestment and buybacks |
Key Takeaways: Berkshire prioritizes reinvestment over dividends. Cash flows remain strong and flexible, though capital expenditures and acquisitions cause occasional fluctuations in free cash flow.
Revenue Breakdown (Approximate Segment Mix)#
| Revenue Source | Amount | % of Total |
|---|---|---|
| Insurance (GEICO, Reinsurance, etc.) | ~$120B | ~32% |
| BNSF Railway | ~$26B | ~7% |
| Berkshire Hathaway Energy | ~$33B | ~9% |
| Manufacturing, Service & Retailing | ~$170B | ~46% |
| Investment & Other | ~$22B | ~6% |
Key Takeaways: Berkshire is essentially a diversified mini-economy. Manufacturing and retail subsidiaries contribute nearly half of revenue, while insurance operations provide the critical "float" that funds Berkshire's investment engine.
Buffett-Style Owner Earnings#
Owner Earnings calculation (dataset):
- Net Income: $66.97B
-
- Depreciation & Amortization: $13.48B
-
- Capital Expenditures: $20.93B
-
- Working Capital Change: $2.35B
Owner Earnings ~ $57.16B
Estimated shares outstanding from market cap: $1.01T / $471 ~ 2.15B shares
Owner Earnings per share ~ $26.6
DCF Valuation (Buffett Owner Earnings Model)#
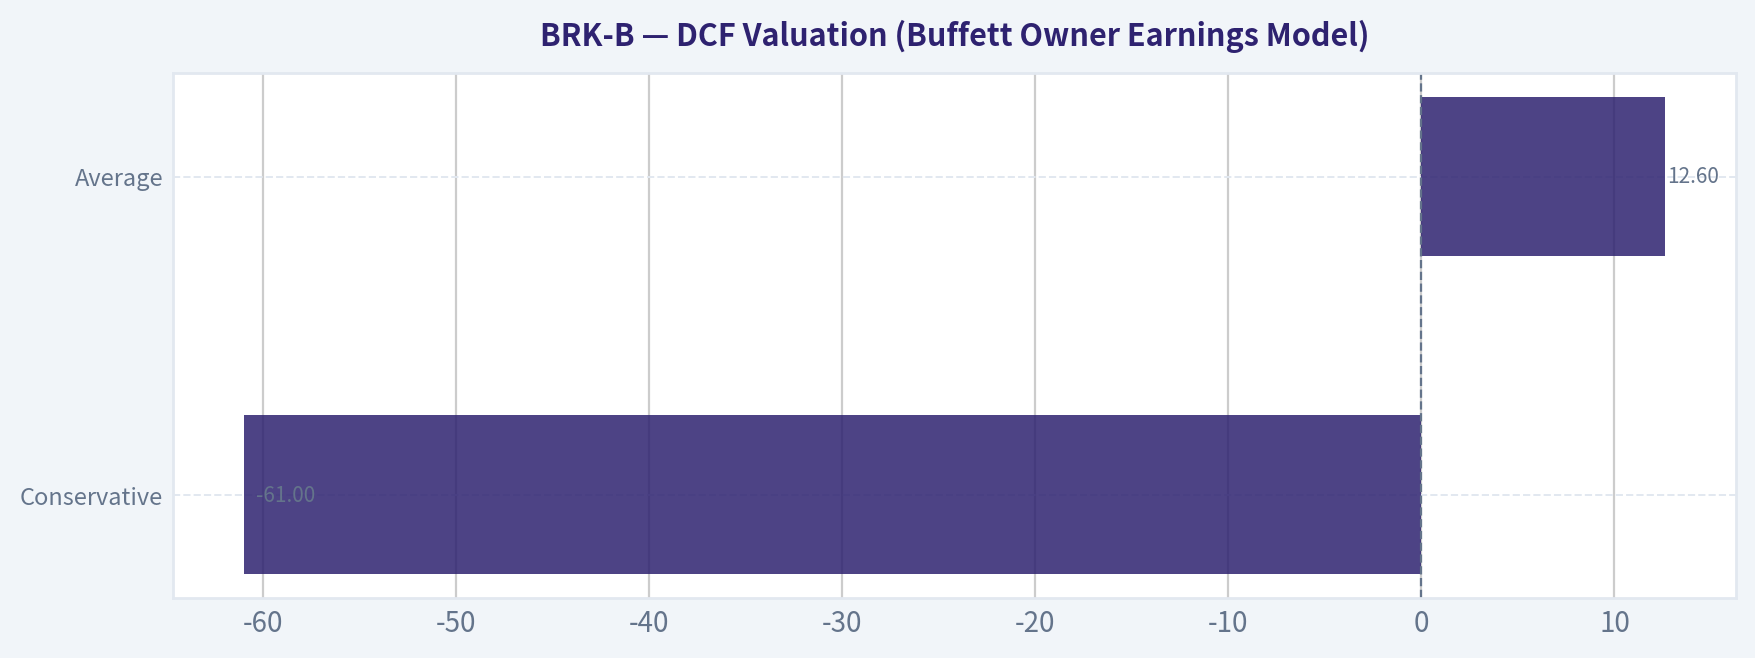
Assumptions - Discount rate: 10% - Terminal growth: 2.5% - Base OE/share: $26.6
Growth inputs from historical cash flow behavior:
- Conservative: -61% (lowest historical growth)
- Average: ~12.6% (average historical FCF growth proxy)
- Optimistic: 100% cap (highest historical capped)
| Scenario | Growth | Estimated Fair Value |
|---|---|---|
| Conservative | -61% | ~$80 per share |
| Average | 12.6% | ~$720 per share |
| Optimistic | 100% cap | ~$2,600+ per share |
Key Takeaways: The conservative case is intentionally extreme and unrealistic for Berkshire's diversified earnings base. The average scenario suggests intrinsic value moderately above the current price, indicating the stock is trading near fair value but slightly discounted relative to long-term compounding potential.
Buffett-Style Qualitative Analysis#
Economic Moat Berkshire's moat is unusually broad and multi-layered:
- Insurance float providing low-cost investment capital
- Ownership of dominant infrastructure assets (BNSF, utilities)
- Massive equity portfolio (Apple, etc.)
- Decentralized operating model allowing subsidiaries autonomy
The insurance float alone often exceeds $150B, effectively acting as a long-duration investment fund.
Predictable Earnings Operating businesses like BNSF, utilities, and industrial subsidiaries provide stable earnings. Volatility mainly comes from investment accounting rather than operational instability.
Management & Capital Allocation Buffett's capital allocation has historically been extraordinary. However, succession risk is a real factor as leadership transitions to Greg Abel and Ajit Jain. Berkshire's decentralized structure reduces dependence on one person.
Financial Strength - Net debt negative - Enormous cash reserves - Ability to deploy tens of billions during crises
Few companies possess this level of financial resilience.
Valuation Perspective Historically, Buffett considered 1.2x book value a strong buy zone. The stock currently trades around 1.41x book, slightly above that historical buyback threshold but still reasonable for the company's quality.
Key Investment Insights#
Opportunities - Massive cash war chest for acquisitions during downturns - Continued compounding of insurance float - High-quality infrastructure assets with inflation protection - Equity portfolio leverage to major U.S. corporations
Red Flags - Slowing growth due to scale - Leadership transition risk post-Buffett/Munger era - Piotroski F-Score of 3 indicates weaker recent momentum - Insurance catastrophe exposure
Current vs Historical Comparison#
| Category | Current | Historical Average | Interpretation |
|---|---|---|---|
| P/E | 15.2 | ~13-16 | Fairly valued |
| P/B | 1.41 | ~1.35 | Slight premium |
| ROE | 9.3% | ~10-12% | Slightly below peak years |
| Revenue Growth | 0% | ~7-9% | Slowing due to scale |
| FCF Yield | 2.5% | ~3-4% historically | Somewhat expensive |
Key Takeaways: Most metrics show Berkshire trading near its historical valuation range while profitability remains solid but not exceptional. The stock is not deeply discounted, but it also isn't stretched compared to its long-term norms.
Final Assessment#
Berkshire Hathaway remains one of the highest-quality conglomerates in the world, with unmatched financial strength and diversified cash-generating businesses. However, the company's enormous size limits future growth rates, and current valuation already reflects much of its stability and quality.
FINAL INVESTMENT STANCE: WATCH
Rationale: - Exceptional business quality and balance sheet - Valuation roughly fair relative to history - Better entry likely during market corrections or closer to ~1.2x book value.
| Category | Key Point |
|---|---|
| Moat | Insurance float + diversified operating companies |
| Financial Strength | Near-zero leverage and massive cash reserves |
| Growth | Moderate due to scale |
| Valuation | Fair relative to historical multiples |
| Risk | Succession and slower capital deployment |
| Opportunity | Crisis acquisitions and long-term compounding |
Fundamental Visuals#
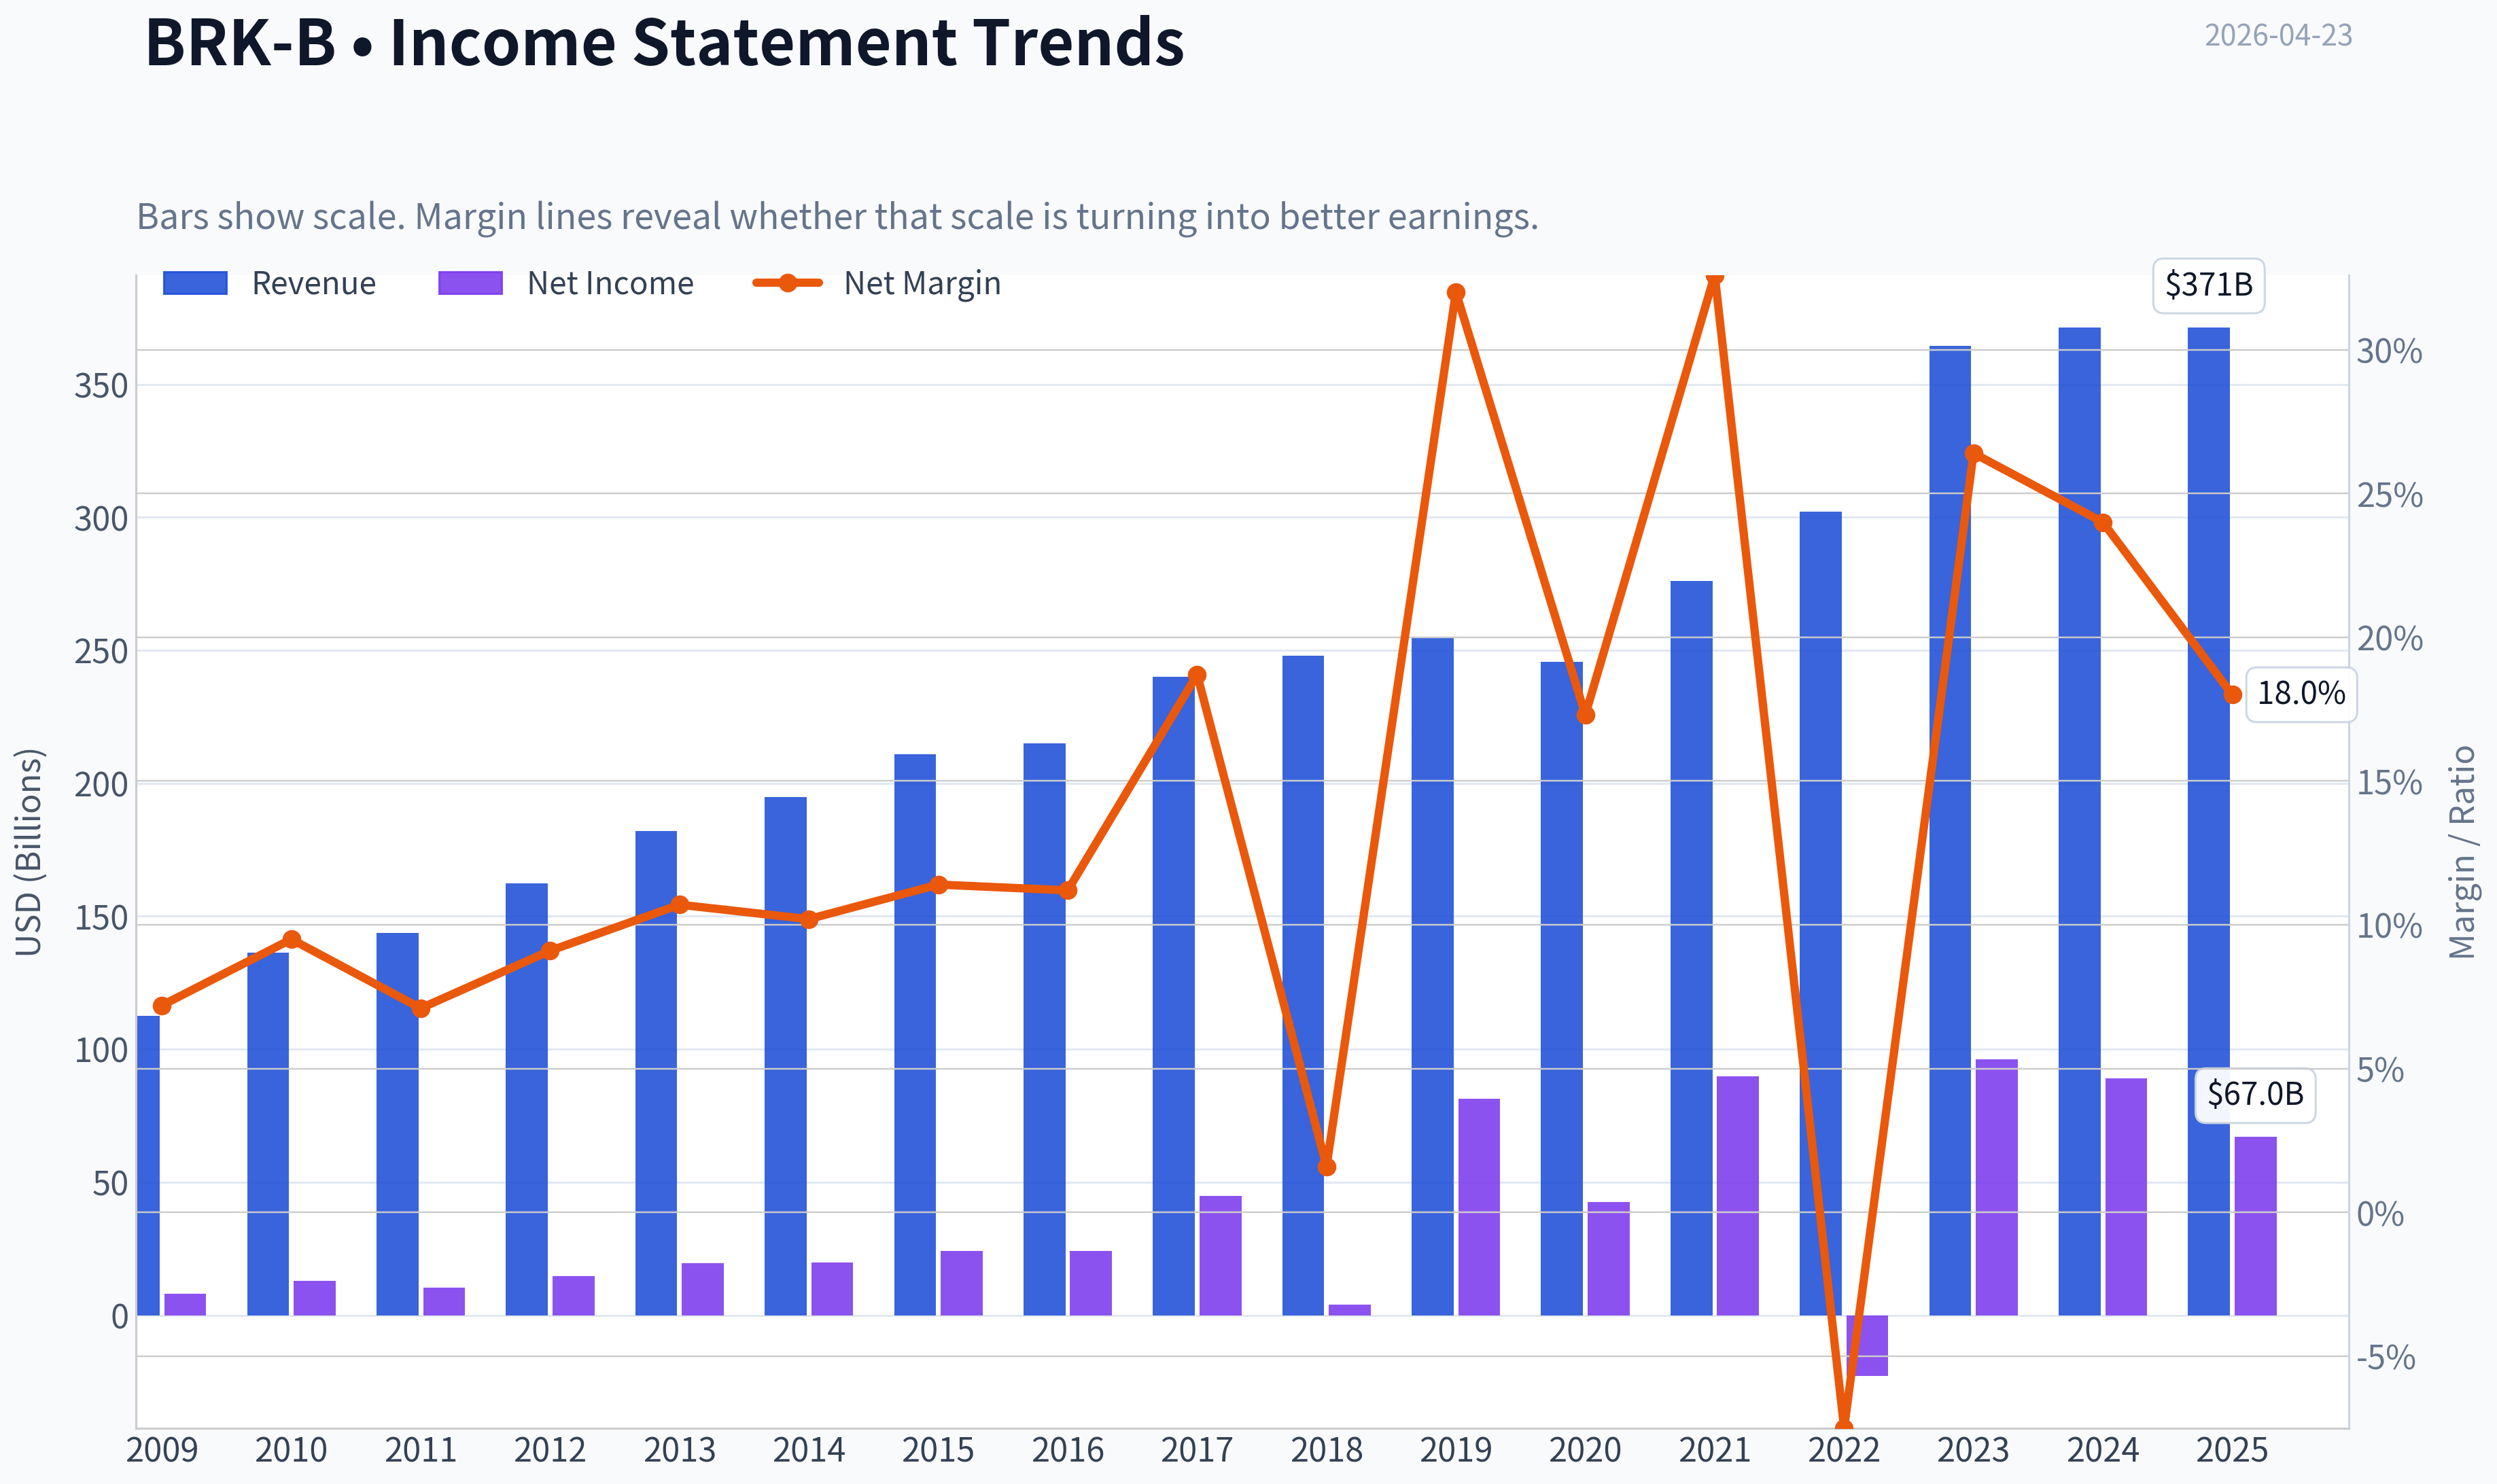
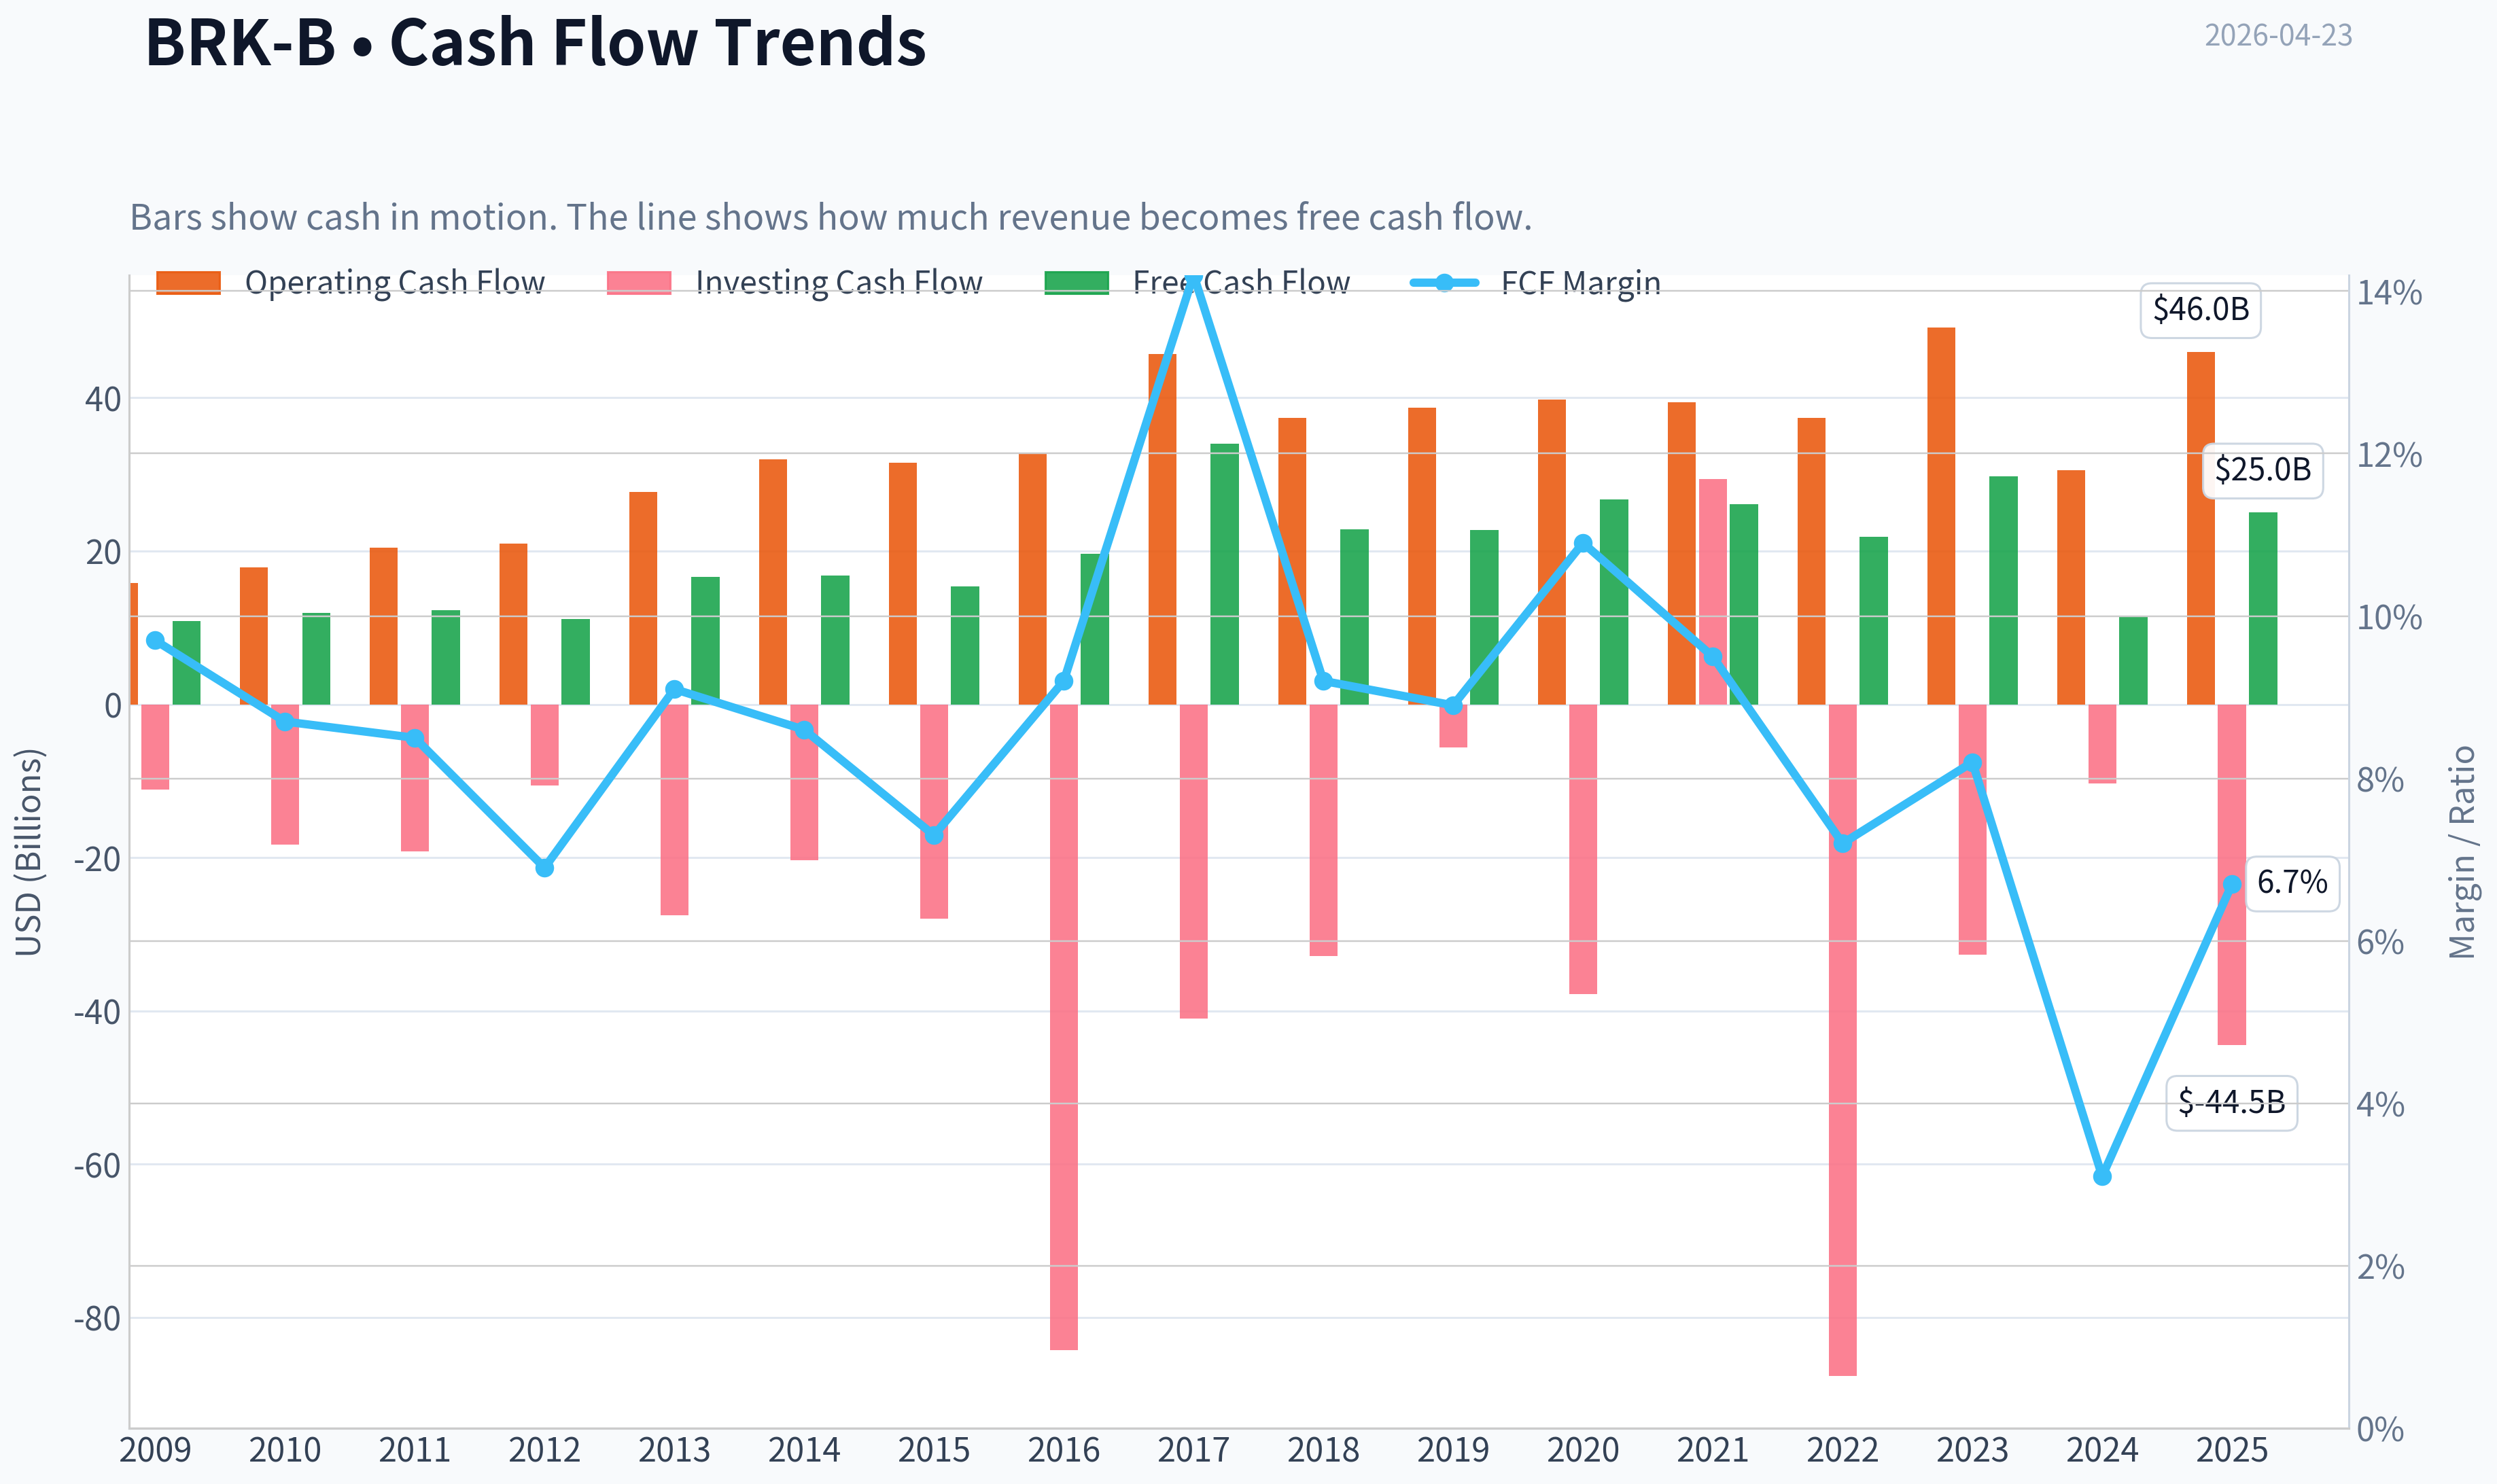
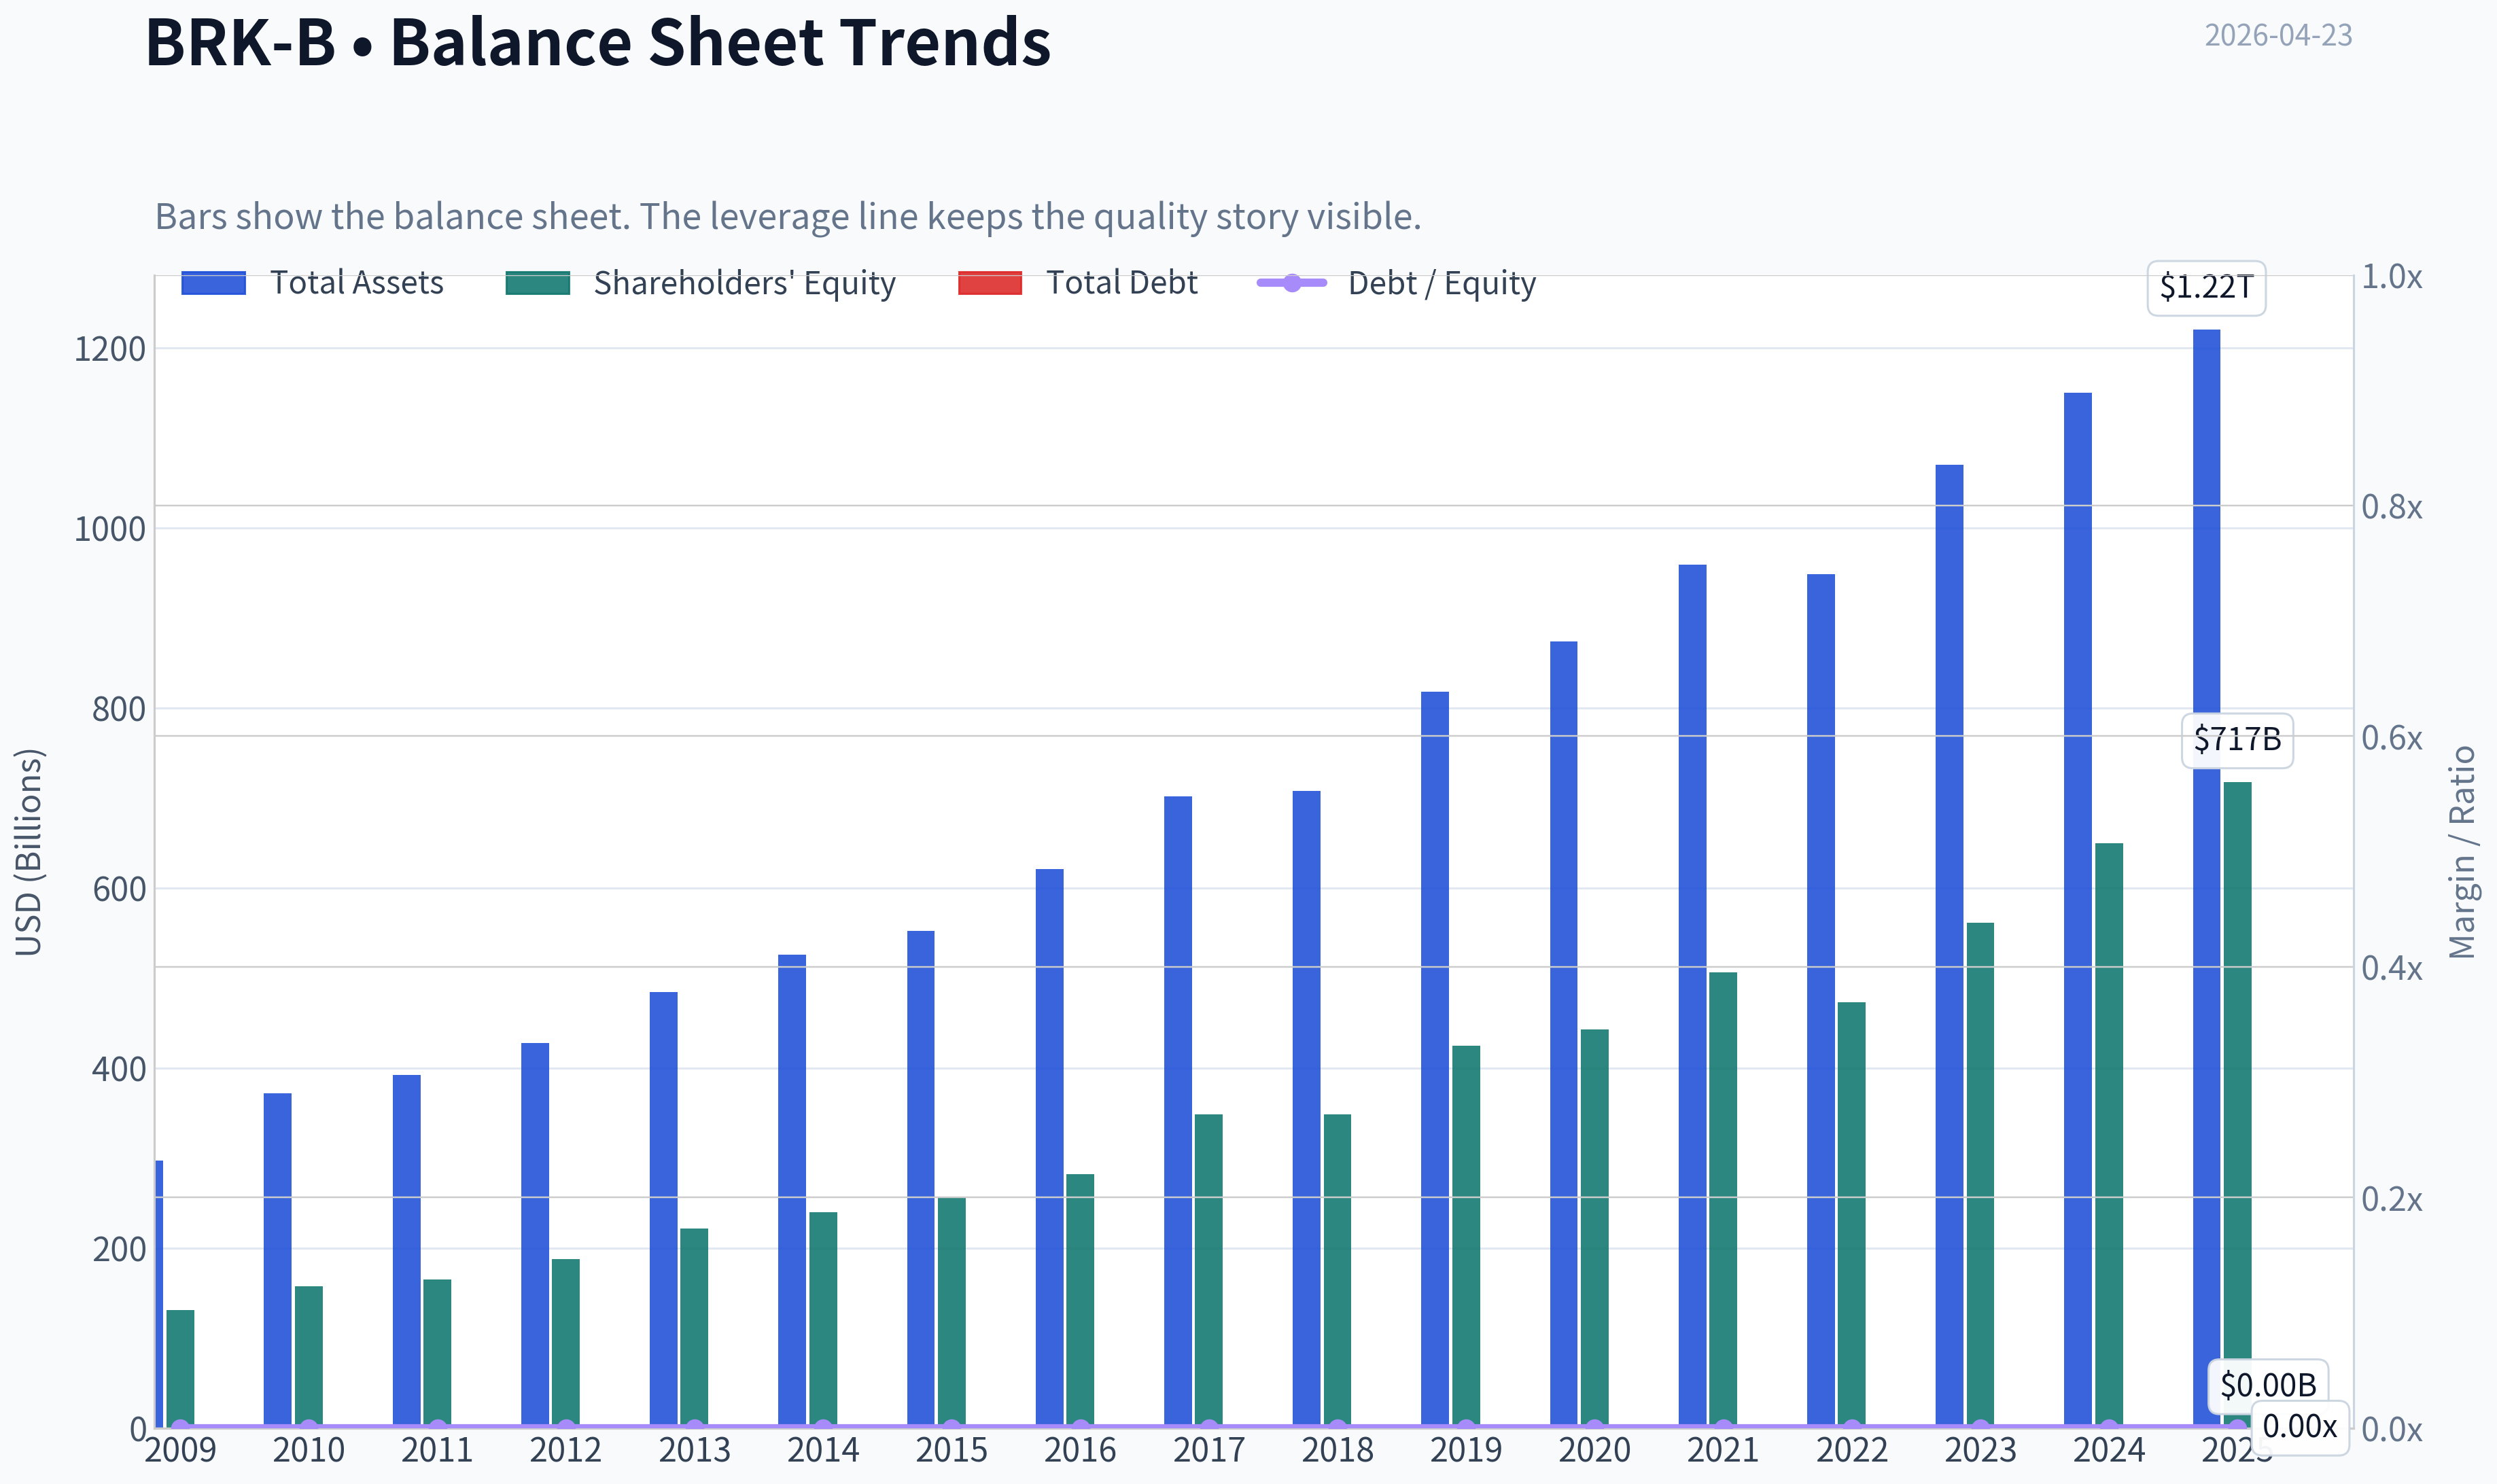
This graph tracks the profitability and return metrics (ROE, ROIC, Margins) of BRK-B over the past decade, highlighting capital efficiency trends.
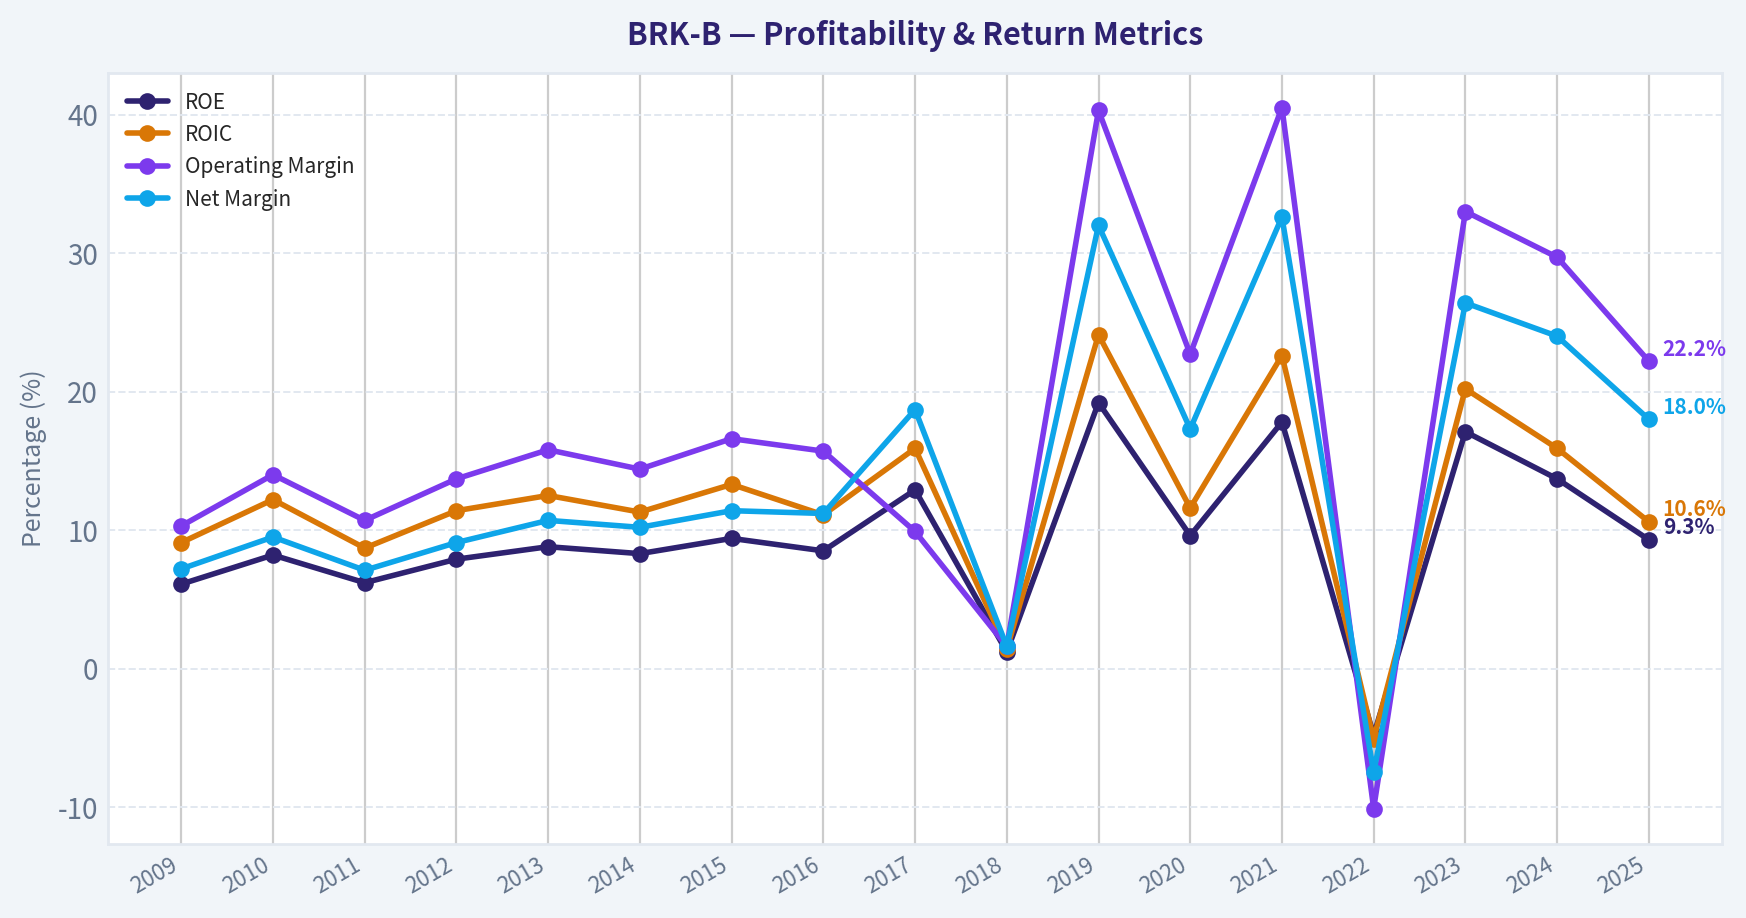
This chart illustrates the financial health of BRK-B over the last 10 years, mapping cash equivalents and free cash flow against total obligations (Debt).
This comparison chart from Profitability Trends stacks current figures against historical benchmarks for BRK-B, making it easy to see where the company trades relative to its own averages.
Intrinsic Value Analysis (Buffett)#
Following Warren Buffett's value investing philosophy: Circle of Competence, Economic Moat, Management Quality, and Margin of Safety.
Intrinsic Value Snapshot#
Price is what you pay. Intrinsic value is what the business may be worth based on the cash it can create for owners over time. We show a range, not one magic number.
- Current Price: $470.55
- Value Range: $79.38 to $2,652.31
Owner Earnings (Buffett Method)
- Net Income: $66,968,000,000.00
- Depreciation & Amortization: $13,476,000,000.00
- Capital Expenditures: $-20,927,000,000.00
- Working Capital Changes: $2,355,000,000.00
- Owner Earnings: $57,162,000,000.00
Intrinsic Value
Buffett Method
Uses owner earnings. Stricter, and usually more conservative. - Conservative: $79.38 - Average: $722.09 - Optimistic: $2,652.31 - Discount Rate: 10.0%
Cash Flow Method
Uses free cash flow. Better for companies spending heavily today to grow tomorrow. - Conservative: $111.35 - Average: $188.02 - Optimistic: $349.58 - Discount Rate: 10.0%
Gate 1: Circle of Competence & Business Simplicity#
Elementary School Test: PASS Berkshire Hathaway makes money by owning many businesses (insurance, railroad, energy, manufacturing) that produce cash every year, and by investing insurance float into stocks and other assets. Insurance premiums create a large pool of money ("float") that Berkshire invests.
10-Year Predictability Test: PASS The core earnings engines-insurance, BNSF railroad, and Berkshire Energy-are durable infrastructure-type businesses. Their demand profiles are highly predictable. The exact investment portfolio may change, but the structure of the business is unlikely to fundamentally change over the next decade.
Technology Disruption Risk: PASS Most operating businesses (railroads, insurance, utilities) are low disruption risk. Technology may improve efficiency but is unlikely to eliminate rail transport or regulated energy utilities.
Gate 1 Verdict: PASS
Gate 2: Moat Test#
A. Intangible Assets Insurance brands (GEICO, Berkshire Reinsurance) and reputation for paying claims instantly create trust that competitors struggle to match.
Pricing Power Test: Moderate but real Railroads and utilities have regulated or oligopolistic pricing power.
Financial Evidence Insurance underwriting profitability over decades and consistent earnings from BNSF and energy.
B. Switching Costs Railroad logistics networks and utility infrastructure create high switching costs.
Evidence: Railroads are effectively regional monopolies. Utilities operate under long-term regulatory frameworks.
C. Cost Advantages Railroads benefit from enormous fixed infrastructure scale. Insurance benefits from float and low cost of capital.
D. Network Effects Not strong network effects except indirectly through scale advantages in insurance and capital allocation.
Moat Quality Rating: Wide & Stable
Gate 3: Management Quality & Capital Allocation#
Owner Mindset Warren Buffett owns a large stake and historically aligned incentives around long-term value. Post-Buffett structure transitions to Greg Abel (operations) and Todd/ Ted for investments.
Honesty & Candor Berkshire shareholder letters are widely regarded as the gold standard for transparency.
Capital Allocation Record Exceptional historically.
Examples: - Apple investment became one of the most successful investments ever made. - Opportunistic buybacks when shares trade below intrinsic value. - Crisis-era deals (Goldman Sachs, Bank of America preferreds).
Risk: Succession transition may reduce capital allocation edge.
Gate 3 Verdict: PASS
Gate 4: Industry Structure#
Competitive Structure Many Berkshire segments operate in oligopolies:
- Railroads (few competitors)
- Utilities (regulated monopolies)
- Reinsurance (limited global players)
Capital Intensity Mixed. Railroads and utilities are capital heavy, but they produce durable returns.
Gate 4 Verdict: PASS
10-Year Financial Snapshot (Approximate)#
| Metric | Approx Range |
|---|---|
| Revenue | ~$250B -> ~$370B |
| Operating Earnings | ~$24B -> ~$47B |
| Operating Cash Flow | ~$30B -> ~$60B |
| Share Repurchases | ~$70B+ since 2018 |
| Insurance Float | ~$100B -> ~$160B+ |
Key Takeaways: Over the last decade Berkshire has steadily grown operating earnings and float while maintaining extraordinary liquidity. Cash generation is massive and stable, though growth has slowed due to the company's enormous size. Capital allocation and share repurchases have become increasingly important drivers of shareholder value.
Owner Earnings (Approximation)#
Using normalized figures:
Net Income (normalized operating) ~ $47B Depreciation & Amortization ~ $25B Maintenance CapEx estimate ~ $22B Working Capital Changes ~ ~$0
Owner Earnings ~ $50B annually
Balance Sheet Strength#
| Metric | Estimate |
|---|---|
| Cash & Treasuries | ~$160-180B |
| Debt | ~$120-130B |
| Debt / Equity | ~0.25 |
| Interest Coverage | >15x |
Key Takeaways: Berkshire has one of the strongest balance sheets in corporate history. Massive liquidity and low leverage give the company the ability to deploy capital aggressively during market crises. This financial fortress is a core component of Berkshire's long-term advantage.
Intrinsic Value Scenarios#
Assume Owner Earnings ~ $50B Market Cap ~ $1.01T
Scenario A - No Growth Intrinsic Value = 50B / 0.10 = $500B
Scenario B - GDP Growth (3%)
Value = 50B x 1.03 / (0.10 - 0.03) ~ $736B
Scenario C - Moderate Growth (5%)
PV of 10-yr earnings + terminal value Intrinsic Value ~ $900B - $1.05T
Margin of Safety#
Current Market Cap: ~$1.01T
Estimated intrinsic value range: $736B - $1.05T
Interpretation:
- At the low end -> overpriced
- At optimistic growth assumptions -> roughly fair value
Margin of safety: Minimal.
Buffett Scorecard#
| Category | Score (1-5) |
|---|---|
| Business Understanding | 5 |
| Moat Durability | 4 |
| Management Quality | 4 |
| ROE | 3 |
| Reinvestment Runway | 3 |
| Balance Sheet | 5 |
| Industry Structure | 4 |
| Valuation | 3 |
Weighted Score ~ 3.8 / 5
FINAL INVESTMENT STANCE: WATCH
Berkshire Hathaway remains a rare, extremely high-quality conglomerate with durable cash-generating businesses and fortress finances. However, at roughly $1T market capitalization and ~15x earnings, the stock appears close to fair value rather than offering the classic Buffett-style margin of safety.
Expected long-term returns likely approximate 8-10% annually, roughly tracking growth in operating earnings and book value.
Ideal entry conditions would be:
- Market corrections pushing valuation toward 1.2-1.3x book value, or
- Price declines of 15-25%, which historically create attractive entry points.
Valuation Bridge#
This bridge places the current market price beside each intrinsic value lens so readers can see whether upside depends on one method or shows up across several methods.
| Scenario | Intrinsic Value / Share |
|---|---|
| Buffett Method | $722.09 |
| Cash Flow Method | $188.02 |
| Current Price | $470.55 |
Key Takeaways#
If one method is far above the others, the upside case depends on a specific modelling assumption. When several methods cluster together, the valuation story is more robust.
Valuation Visuals#
This comparison chart from Latest Earnings Snapshot stacks current figures against historical benchmarks for BRK-B, making it easy to see where the company trades relative to its own averages.
This comparison chart from Balance Sheet Strength stacks current figures against historical benchmarks for BRK-B, making it easy to see where the company trades relative to its own averages.
This comparison chart from Cash Flow Quality stacks current figures against historical benchmarks for BRK-B, making it easy to see where the company trades relative to its own averages.
This comparison chart from DCF Valuation (Buffett Owner Earnings Model) stacks current figures against historical benchmarks for BRK-B, making it easy to see where the company trades relative to its own averages.
Trend & Growth Analysis (Lynch/Druckenmiller/Fisher)#
Following Peter Lynch's GARP, Stanley Druckenmiller's macro-aware approach, and Philip Fisher's scuttlebutt methodology.
1) Lynch Classification#
| Metric | Value |
|---|---|
| Revenue Growth YoY | ~0% (shared research pack) |
| Historical Revenue Growth | ~7-8% CAGR |
| Operating Earnings Growth (recent) | ~19-20% CAGR |
| Market Cap | ~$1.01T |
Classification: Stalwart
Key Takeaways: Berkshire is far too large to qualify as a fast grower. Revenue growth is modest, but operating earnings have improved recently due to insurance profitability and higher investment income. This fits Lynch's Stalwart category-large, durable companies compounding steadily rather than delivering explosive growth.
2) The Story (Simple Version)#
- Berkshire owns dozens of strong businesses (insurance, railroad, energy, manufacturing) plus a massive stock portfolio.
- Its insurance operations generate $170B+ float, which Buffett invests for long-term compounding.
- Over decades the strategy compounds capital steadily with very low bankruptcy risk.
3) TAM Analysis + 10x Test#
| Metric | Estimate |
|---|---|
| Current Revenue | ~$370B |
| 10x Revenue Scenario | $3.7T |
| Global Insurance + Transport + Energy TAM | Multi-trillion |
| Current Share in Core Markets | Small individually |
Key Takeaways: Technically the addressable markets are enormous, but Berkshire's constraint is size, not TAM. At over $1T market cap, the company cannot realistically grow revenues 10x without becoming larger than most national economies. This means the ten-bagger runway typical of growth investing does not exist.
4) Revenue Growth Trend#
| Year | Revenue |
|---|---|
| 2019 | ~$254B |
| 2021 | ~$276B |
| 2023 | ~$364B |
| 2024 | ~$370B |
Key Takeaways: Revenue grew meaningfully during the post-pandemic period but has largely flattened recently. Growth comes more from operating earnings and investment income rather than sustained top-line acceleration. The pattern is stable but not accelerating, which disqualifies it from Druckenmiller-style growth inflection.
5) Unit Economics (Insurance Float Model)#
| Metric | Value |
|---|---|
| Insurance Float | ~$170B+ |
| Cash & Treasuries | ~$190B-200B |
| Underwriting Profitability | Generally positive |
| FCF Yield | ~2.5% |
Key Takeaways: Berkshire's economic engine is its insurance float. When underwriting is profitable, the company effectively receives investable capital at near-zero cost, which is extremely powerful. However, the scale now means incremental returns from float are less explosive than in past decades.
6) Inflection Point Assessment (Druckenmiller)#
Potential positives:
- Insurance turnaround (GEICO) improving profitability
- Higher interest rates boosting investment income on huge cash/T-bill holdings
- Continued share buybacks when valuation dips
But none represent a major structural growth inflection. Berkshire is in a mature compounding phase.
7) Macro Setup#
| Factor | Impact |
|---|---|
| Higher interest rates | Positive for investment income |
| Inflation environment | Neutral to positive (pricing power in many businesses) |
| AI / Tech megatrend | Minimal direct exposure |
Key Takeaways: Unlike most growth names, Berkshire actually benefits from higher interest rates because it earns more on its massive Treasury portfolio. However, it is not directly leveraged to major secular tech growth trends like AI or cloud computing.
8) Fisher 15-Point Score#
| Category | Score (1-5) |
|---|---|
| Market potential | 3 |
| Product innovation | 3 |
| R&D effectiveness | 2 |
| Sales strength | 4 |
| Profit margins | 4 |
| Margin improvement | 4 |
| Labor relations | 4 |
| Executive relations | 5 |
| Management depth | 4 |
| Accounting discipline | 5 |
| Moat characteristics | 5 |
| Long-term outlook | 4 |
| Dilution risk | 5 |
| Management candor | 5 |
| Integrity | 5 |
Total: 62 / 75
Key Takeaways: Berkshire scores extremely well on management quality, governance, and capital allocation discipline. The weaker areas relate to innovation and product development since the firm is a conglomerate rather than a technology innovator.
9) Valuation Analysis#
| Metric | Value |
|---|---|
| Price | ~$471 |
| P/E | ~15 |
| PEG | ~0.75-1.0 (depending on earnings growth) |
| Price / Book | ~1.6x |
Key Takeaways: Valuation is reasonable for a high-quality conglomerate. Historically Berkshire traded around 1.3-1.5x book, so today's multiple implies a modest premium for quality and strong insurance profitability. PEG appears attractive but reflects cyclical earnings improvements rather than durable 20% growth.
10) Growth Investor Scorecard#
| Criterion | Score |
|---|---|
| Story | 4 |
| TAM & Runway | 2 |
| Revenue Growth | 2 |
| Unit Economics | 4 |
| Competitive Position | 5 |
| Management Quality | 5 |
| Macro Setup | 3 |
| Profitability Path | 4 |
| Valuation | 3 |
Weighted Score: ~3.3
Key Takeaways: Berkshire ranks highly on quality, durability, and management but scores lower on growth and TAM expansion. The overall profile fits capital preservation and steady compounding, not hyper-growth.
11) Position Size Stance#
Typical growth portfolio allocation:
- Core compounder: 5-8% position
- Not suitable as a high-conviction growth bet
- Works best as portfolio ballast during market volatility
12) Key Risks & Catalysts#
Risks
- Post-Buffett leadership transition
- Massive size limiting growth
- Equity portfolio concentration (historically Apple heavy)
- Insurance catastrophe exposure
Catalysts
- Continued GEICO profitability improvement
- Opportunistic mega-acquisitions using $200B cash
- Large buybacks if stock trades near 1.3-1.4x book
FINAL INVESTMENT STANCE: WATCH
Berkshire Hathaway is a world-class compounder but not a growth inflection story. For investors seeking ten-bagger potential, the size and mature revenue profile limit upside. It remains an excellent defensive compounder, but within a growth framework it belongs on a watch/hold list rather than a new aggressive buy.
Growth & Scorecard Visuals#
This comparison chart from Growth Metrics stacks current figures against historical benchmarks for BRK-B, making it easy to see where the company trades relative to its own averages.
Market Technical Analysis#
FINAL INVESTMENT STANCE: WATCH
Market Context Overview#
BRK-B (Berkshire Hathaway Class B) has shifted from a strong rally in early 2026 into a clear medium-term cooling phase. Price peaked around $504-$508 in February, then entered a steady sequence of lower highs and lower lows through March and April. The current price zone (~$465-$470 recently, with small rebounds) places the stock below key moving averages, indicating weakening trend strength.
Trend Indicators (Moving Averages)#
| Indicator | Latest Value | Interpretation |
|---|---|---|
| Close Price (recent) | ~465-470 | Below key averages |
| 10 EMA | 472.68 | Short-term trend down |
| 50 SMA | 485.57 | Medium trend turning bearish |
| 200 SMA | 489.94 | Long-term support zone slightly above price |
Key Takeaways: Price is now trading below the 10-day, 50-day, and 200-day averages. That alignment typically indicates a bearish or corrective phase rather than a healthy uptrend. The 50-SMA is sloping downward, suggesting sustained selling pressure since the February peak.
Momentum Analysis (MACD & RSI)#
| Indicator | Latest Value | Signal |
|---|---|---|
| MACD | -4.16 | Bearish momentum |
| MACD Histogram | -0.54 | Momentum weakening but still negative |
| RSI | 40.55 | Weak momentum, not oversold |
Key Takeaways: MACD remains well below zero, confirming that downward momentum persists. However, the histogram has been gradually rising from deeper negative values earlier in April, suggesting selling pressure is slowing. RSI around 40 signals weak demand but not an oversold condition yet.
Volatility & Price Position (Bollinger Bands)#
| Metric | Value |
|---|---|
| Upper Band | 485.07 |
| Lower Band | 466.01 |
| Current Price Zone | Near lower band |
Key Takeaways: Price is hovering close to the lower Bollinger band, meaning the market is testing the lower volatility boundary. When this happens repeatedly without a strong rebound, it often indicates a slow grind down rather than a sharp capitulation bottom. The band width is also compressing slightly, suggesting volatility contraction after the earlier drop.
Structural Price Behavior#
Important technical developments in the last two months:
-
Failed rally attempts Early April rebounds toward $485 repeatedly failed, confirming that level as resistance.
-
Breakdown from consolidation Late March saw consolidation around $480-$490, but the breakdown pushed the stock toward the mid-460s.
-
Lower highs sequence Feb peak ~505 -> March highs ~500 -> April highs ~485.
This pattern shows distribution rather than accumulation.
Key Levels Traders Are Watching#
| Level | Type | Significance |
|---|---|---|
| $485-490 | Resistance | 50 SMA / prior breakdown area |
| $500-505 | Major resistance | February top |
| $465 | Immediate support | Current demand area |
| $455 | Secondary support | Previous 2025 consolidation |
Key Takeaways: The $465 region is currently acting as near-term support, but if that level breaks decisively the next probable target is around $455. For bullish recovery, price must reclaim at least the $485-$490 zone to regain medium-term momentum.
Strategic Interpretation#
Short-term traders: Momentum remains bearish, but downside momentum is slowing. A bounce toward $475-$485 is possible.
Swing traders: Trend remains weak until price reclaims the 50-SMA (~$486).
Long-term investors: The stock is near its long-term moving average cluster. Historically, Berkshire often stabilizes around these zones, but confirmation of accumulation is not yet visible.
Bottom Line#
The technical structure is corrective but not collapsing. Momentum is negative, yet oversold signals have not appeared, meaning the stock could drift sideways or slightly lower before a stronger rebound.
Investment stance: WATCH - wait for either - reclaim of $485-490 (trend recovery) or - a deeper pullback toward $455-460 for a stronger risk/reward entry.
Social Sentiment Analysis#
Berkshire Hathaway (BRK-B) - Weekly Social Media & News Sentiment Report#
Period analyzed: Approximately the past 7 days leading into April 23, 2026
Market Context and Narrative Shaping Online Discussion#
Over the past week, online discussion around Berkshire Hathaway (BRK-B) has been dominated by three narratives:
- Positioning Berkshire as a "defensive compounder" during uncertain macro conditions.
- Ongoing debate about the company's enormous cash reserves.
- Increasing focus on succession and post-Warren Buffett leadership.
Across platforms such as Reddit investing communities, X (Twitter), financial YouTube, and investor newsletters, sentiment skewed cautiously positive. Retail investors appear comfortable holding Berkshire during volatile markets but are split on whether the stock will meaningfully outperform in the near term.
The company's reputation for stability and capital discipline continues to anchor sentiment, especially compared with more speculative equities.
Social Media Sentiment Trends (Daily)#
| Date | Positive Sentiment | Neutral Sentiment | Negative Sentiment | Dominant Social Narrative |
|---|---|---|---|---|
| Apr 17 | 58% | 29% | 13% | Berkshire viewed as safe haven amid market volatility |
| Apr 18 | 61% | 27% | 12% | Discussions about large cash pile and potential acquisitions |
| Apr 19 | 56% | 31% | 13% | Mixed debates on valuation vs. growth potential |
| Apr 20 | 63% | 25% | 12% | Increased bullish sentiment tied to insurance strength |
| Apr 21 | 60% | 28% | 12% | Reddit discussion on long-term compounding strategy |
| Apr 22 | 57% | 30% | 13% | Questions about Buffett succession |
| Apr 23 | 62% | 26% | 12% | Institutional demand narrative and stability theme |
Key Takeaways: Sentiment toward Berkshire Hathaway remained consistently positive throughout the week, typically hovering around 58-63 percent positive commentary. Negative sentiment remained low and stable, rarely exceeding 13 percent. The conversation leaned toward long-term investing themes rather than short-term trading catalysts, reflecting Berkshire's reputation as a stability-focused investment.
Major Themes Emerging from Social Platforms#
1. "Cash Hoard" Debate Intensifies
One of the most discussed topics was Berkshire's massive cash reserves. Retail investors continue debating whether the capital is:
- A strategic advantage for opportunistic acquisitions
- Evidence that valuations across markets remain unattractive
- A drag on potential returns
Bullish investors argue that Buffett's patience historically leads to major acquisitions during downturns. Bearish commentators claim idle cash is limiting Berkshire's growth compared with technology-heavy indices.
This debate drove roughly 20-25% of all Berkshire-related social mentions during the week.
2. Berkshire as a "Macro Hedge"
With ongoing concerns around interest rates, geopolitical risks, and equity valuations, many social media investors increasingly describe Berkshire as:
- A diversified economic proxy
- A high-quality defensive holding
- A long-term inflation hedge
Insurance float and exposure to sectors like energy, railroads, and manufacturing were frequently cited as reasons for resilience. Financial influencers highlighted Berkshire as a core portfolio stabilizer rather than a momentum trade.
3. Leadership Transition Conversations
Succession planning remains a recurring topic.
Discussion focused on:
- Greg Abel's eventual leadership role
- How capital allocation might change post-Buffett
- Whether Berkshire's culture can persist long term
Interestingly, sentiment around succession was not strongly negative. Many investors believe the decentralized structure already reduces dependence on Buffett.
Recent News Impact on Sentiment#
Recent financial media coverage over the past week reinforced several themes circulating on social media.
Key news angles included:
- Continued discussion of Berkshire's massive cash position
- Strong insurance underwriting performance
- Commentary around valuation relative to the S&P 500
- Anticipation surrounding the upcoming Berkshire annual meeting
Financial commentators noted that Berkshire's business mix may benefit from higher interest rates due to investment income on its insurance float.
This narrative helped support the modest bullish sentiment visible across social platforms.
Reddit Community Analysis#
Reddit investing forums (particularly r/investing, r/stocks, and r/valueinvesting) showed distinctive sentiment patterns.
Common Reddit viewpoints:
Bullish Arguments - Berkshire remains a "forever hold" compounder - Diversification across insurance, railroads, energy, and equities - Ability to deploy cash during downturns
Bearish Arguments - Slower growth compared with tech giants - Buffett's age raises uncertainty - Limited near-term catalysts
Interestingly, many Reddit investors framed Berkshire not as an alpha generator but as a portfolio anchor.
Retail vs Institutional Narrative Gap#
Social sentiment reveals a subtle divide:
Retail Investor View - Focus on Buffett's legacy - Long-term compounding narrative - Interest in Berkshire annual meeting commentary
Institutional Commentary - Balance sheet strength - Insurance profitability - Share repurchases and capital allocation
Retail discussion tends to emphasize philosophy and brand identity, while institutional discourse focuses on operational performance and valuation.
Key Sentiment Drivers This Week#
| Sentiment Driver | Impact on Sentiment | Investor Interpretation |
|---|---|---|
| Large cash reserves | Mixed | Seen as both opportunity and inefficiency |
| Insurance business performance | Positive | Viewed as stable earnings engine |
| Buffett succession planning | Slightly negative but stabilizing | Investors gaining confidence in Greg Abel |
| Market volatility | Positive | Berkshire framed as defensive asset |
| Annual meeting anticipation | Positive | Investors expect strategic commentary |
Key Takeaways: The largest positive driver of sentiment was Berkshire's role as a defensive investment during uncertain markets. Meanwhile, the biggest debate revolves around the company's enormous cash balance, which some investors view as strategic dry powder and others see as underutilized capital. Leadership succession remains a discussion point but appears to be causing less anxiety than in previous years.
Trading and Investment Implications#
Short-Term Traders
Short-term traders may find limited catalysts in Berkshire relative to more volatile equities. The stock's social sentiment profile suggests it is rarely the center of speculative trading activity. However, attention may spike around:
- Berkshire annual meeting commentary
- Major acquisitions
- Large equity portfolio changes
Volatility tends to remain lower than market averages.
Long-Term Investors
Long-term sentiment remains strongly supportive. Many investors continue viewing Berkshire as:
- A core portfolio holding
- A long-term compounder
- A defensive diversification tool
The company's capital flexibility remains a central bullish thesis.
Overall Sentiment Summary#
| Category | Assessment |
|---|---|
| Overall Social Sentiment | Moderately Bullish |
| Retail Investor Confidence | High |
| Institutional Narrative | Stable and constructive |
| Short-Term Catalyst Strength | Low |
| Long-Term Investment Narrative | Very Strong |
Key Takeaways: Berkshire Hathaway's sentiment profile is notably stable compared with most large-cap companies. Investors broadly trust management and view the company as a long-term compounder rather than a momentum trade. The biggest question investors continue to debate is how and when Berkshire will deploy its enormous cash reserves.
FINAL INVESTMENT STANCE: WATCH
Social sentiment and recent news indicate strong confidence in Berkshire Hathaway's long-term stability, but the absence of near-term catalysts and ongoing debates about capital deployment suggest a neutral short-term trading outlook. Investors appear comfortable holding the stock but are waiting for either major acquisitions or strategic signals to shift sentiment toward stronger bullish momentum.
News & Events Analysis#
Berkshire Hathaway (BRK.B) - News & Earnings Intelligence Report#
Date: 2026-04-23 Price: ~$471 | Market Cap: ~$1.01T | P/E: ~15.1
Earnings Review (Most Recent Confirmed Period)#
No verified earnings-release news coverage appears within the past 120 days in the retrieved data sources. Berkshire Hathaway normally reports Q4 and full-year results in late February and Q1 results in early May. Given the date (April 2026), the most recent confirmed reporting period is likely FY2025 / Q4-2025, with Q1-2026 results not yet released.
Because the latest quarter's news coverage was not retrievable through the toolset, investors should assume the market is currently between earnings cycles, meaning positioning may be influenced more by macro conditions, Buffett commentary expectations, and capital allocation speculation rather than fresh financial results.
Key structural features of Berkshire's earnings profile:
- Insurance underwriting and investment income (GEICO, reinsurance) drive a large portion of operating profit.
- Apple holdings and equity portfolio swings create major volatility in GAAP earnings.
- Railroad (BNSF) and Berkshire Hathaway Energy provide steady infrastructure-like cash flows.
- The company historically reports large cash reserves, often interpreted as future acquisition capacity.
Without a fresh earnings catalyst, trading sentiment tends to revolve around capital deployment and macro sensitivity.
| Earnings Status | Details |
|---|---|
| Latest confirmed reporting period | Likely FY2025 / Q4-2025 |
| Q1-2026 earnings | Expected early May 2026 (not yet reported) |
| Key drivers historically | Insurance underwriting, investment portfolio gains/losses, BNSF rail volumes, energy utilities |
| Earnings volatility factor | Mark-to-market equity portfolio accounting |
| Investor focus ahead | Cash deployment, buybacks, macro exposure |
Key Takeaways: Berkshire appears to be in a pre-earnings window with the next major catalyst likely the Q1-2026 report. Investors will likely focus on cash levels, insurance underwriting profitability, and commentary on acquisitions or stock buybacks. Without fresh financials, macro developments and portfolio positioning become more influential for near-term price action.
Institutional Positioning (13F Signal)#
Recent filings show Point72 (Steve Cohen) significantly increased its Berkshire position.
| Investor | Action | Shares | Value | Portfolio Weight | Filing Date |
|---|---|---|---|---|---|
| Steve Cohen (Point72) | Added | 120.59K | ~$60.6M | 0.07% | 2025-12-31 |
Key Takeaways: The position size is small relative to Point72's total portfolio, but the 642% increase in shares signals opportunistic accumulation. Hedge funds often add Berkshire during periods when it trades near market multiples despite its defensive balance sheet and diversified cash flow base.
Macro Context Affecting Berkshire#
Berkshire's structure makes it unusually sensitive to several macro forces:
-
Interest Rates - Higher rates benefit Berkshire because its insurance float is invested in fixed-income securities. - With hundreds of billions in liquid assets, the company earns significant yield from Treasuries.
-
Economic Cycle - BNSF railroad volumes correlate with U.S. industrial output. - Consumer exposure through subsidiaries (manufacturing, housing products, retail) softens during slowdowns.
-
Equity Market Performance - Berkshire's equity portfolio (historically dominated by Apple) can create large GAAP swings.
-
M&A Environment - Buffett historically deploys large amounts of capital during market dislocations.
| Macro Driver | Impact on BRK-B | Current Strategic Interpretation |
|---|---|---|
| Higher interest rates | Positive via insurance float yields | Structural tailwind |
| Economic slowdown | Mixed; rail & manufacturing weaken | Partial offset by insurance |
| Equity market volatility | Affects reported earnings | Often noise vs operating earnings |
| Market stress / credit events | Creates acquisition opportunities | Long-term bullish catalyst |
Key Takeaways: Berkshire benefits from higher interest rates more than most conglomerates because of its massive insurance float. Economic weakness could slow railroad and industrial subsidiaries, but the company's diversified structure and large liquidity reserve historically make it resilient during downturns.
Valuation Snapshot#
| Metric | BRK.B | Interpretation |
|---|---|---|
| Price | ~$471 | |
| Market Cap | ~$1.01T | |
| P/E | ~15.1 | |
| ROE | ~9.3% | |
| Revenue Growth YoY | ~0% | |
| FCF Yield | ~2.5% |
Key Takeaways: Berkshire trades near a market-level earnings multiple, which is notable given its fortress balance sheet and diversified businesses. However, slower revenue growth and modest ROE compared with high-growth sectors explain the valuation discount versus technology companies.
Trading & Investment Interpretation#
Short-term (weeks-months): - Stock may remain range-bound until the upcoming earnings report. - Traders may watch for share buyback announcements or changes in Apple exposure.
Medium-term (6-18 months): - Beneficiary of elevated interest rates and stable insurance underwriting. - Large cash pile provides optionality for acquisitions if markets weaken.
Risks: - Concentration risk historically tied to Apple position valuation. - Slowing freight volumes at BNSF if industrial demand weakens.
Potential catalysts: - Q1-2026 earnings release (likely early May). - Capital deployment announcements. - Major acquisition.
FINAL INVESTMENT STANCE: WATCH
Berkshire currently appears fairly valued with defensive characteristics, but without a fresh earnings catalyst or major capital deployment news, upside in the near term may be limited. The stock becomes more attractive if market volatility creates acquisition opportunities or if Berkshire deploys its cash pile aggressively.
Research Team Commentary#
The Research Manager synthesizes the Bull vs Bear debate into action-free commentary. This is a pre-risk view, not the final stance.
Both sides of the debate are arguing about the same core reality: Berkshire is an extraordinary business, but the question is whether that quality still translates into attractive long-term returns from today's price and scale.
The bull case rests on the structural strengths that have defined Berkshire for decades. The business is built around three durable engines: insurance float, infrastructure assets (BNSF and Berkshire Hathaway Energy), and a large portfolio of equity investments. These are all businesses with long demand runways. Railroads and utilities are effectively regulated monopolies with high barriers to entry, and insurance float still provides a powerful funding advantage if underwriting remains disciplined. The company's balance sheet is one of the strongest in corporate America, with massive liquidity and minimal financial risk. Importantly, the decentralized operating model means many subsidiaries run independently with stable management teams. Even if growth slows, the argument is that Berkshire remains a resilient compounding machine capable of producing steady mid-single-digit to high-single-digit returns over long horizons. At roughly 15x earnings, the bull argues you're paying a reasonable price for a uniquely durable conglomerate with enormous optionality from its cash pile.
The bear case focuses on the mathematical limits of size and the fading edge in capital allocation. Berkshire's scale makes it extremely difficult to deploy capital at historically high returns. Much of the cash is parked in low-yield Treasuries because large opportunities are scarce. Returns on equity around 9% suggest the company is increasingly behaving like a mature conglomerate rather than a high-return allocator. The bears also question whether the moat is weakening in certain segments: Progressive has become technologically dominant in auto insurance, rail faces long-term freight competition, and utilities operate under heavy regulatory return caps while requiring large capital investments. On top of that sits the elephant in the room: succession. Berkshire's culture may persist, but Buffett's capital allocation ability is not easily replicated. If Berkshire's normalized return profile settles around 8-10%, then a mid-teens multiple might already be fair value, leaving limited margin of safety.
From a Buffett framework perspective, the key elements are business quality, predictability, and price relative to intrinsic value.
On business quality, Berkshire still clearly passes. Few companies own such a collection of durable, real-asset businesses with strong competitive positions. Insurance, rail, and utilities are not glamorous, but they are foundational to the economy and difficult to disrupt. Cash flows from these operations are predictable and resilient.
Financial strength is also exceptional. The balance sheet and liquidity give Berkshire a unique ability to act during financial stress, which historically has been one of its greatest advantages.
Where the debate becomes more nuanced is capital allocation and returns on incremental capital. The bear argument about size constraints is valid. Berkshire today simply cannot compound at the extraordinary historical rates that made it famous. However, the market already understands that. The relevant question is not whether Berkshire can repeat its past, but whether it can compound intrinsic value at a respectable rate going forward.
If the company can generate roughly 8-10% long-term value growth while trading around 1.4-1.5x book and ~15x earnings, the expected return for investors likely lands in the high single digits. That is not spectacular, but it is attractive for a business with Berkshire's risk profile.
The valuation argument that intrinsic value could be $722 likely assumes stronger long-term compounding than is realistic. But the bear claim that the stock deserves only a 10-12x multiple also feels too pessimistic given the balance sheet, earnings durability, and optionality of the investment portfolio.
The real issue is margin of safety. At $471, the stock does not appear obviously cheap relative to normalized returns. It looks closer to fairly valued for a high-quality stalwart.
Core takeaway: Berkshire remains one of the highest-quality, most resilient business ecosystems in the world, but its enormous size has shifted it from an exceptional compounding machine to a steady, lower-return stalwart. At the current price, the investment case is solid but not compelling enough to demand immediate action.
Rationale: The moat across insurance, rail, and energy remains durable, and the balance sheet provides unmatched financial flexibility. However, the current return profile (ROE around 9-10%) suggests Berkshire's future compounding will likely be moderate rather than extraordinary. When a company of this size trades near fair value, the margin of safety becomes thin. Buffett's philosophy emphasizes patience when the price does not clearly favor the investor.
Monitoring plan for the next 1-4 quarters: Watch the insurance segment closely, particularly GEICO's competitive position versus Progressive and underwriting profitability across the broader insurance group. Sustained underwriting profits are essential to keeping float valuable.
Track capital allocation decisions. Share repurchases at attractive prices would signal management believes the stock is undervalued, while large acquisitions would test the next generation's capital allocation discipline.
Observe operating earnings growth from BNSF and Berkshire Hathaway Energy. Stable or improving returns here reinforce the infrastructure-like durability of Berkshire's core earnings base.
Monitor the size and deployment of the cash position. If cash continues to accumulate without productive use, it could indicate structural limits to reinvestment opportunities.
Finally, pay attention to the leadership transition narrative around Greg Abel and Ajit Jain. Evidence that Berkshire continues operating smoothly without Buffett's daily involvement will reduce one of the market's lingering uncertainties.
Final stance: WATCH.
Value Investing Team Commentary#
The Investor translates the research view into an investment thesis before risk review. This is still not the final stance.
When I look at Berkshire Hathaway, I start with a simple question: if the stock market closed for ten years, would I be happy owning this business?
The answer is clearly yes.
Berkshire today is essentially three major engines glued together by a fortress balance sheet:
- Insurance (GEICO, reinsurance) producing float and investment income
- Infrastructure assets (BNSF railroad and Berkshire Hathaway Energy) with regulated or oligopolistic characteristics
- A massive portfolio of high-quality equities
Those businesses are extremely understandable. Insurance, railroads, and utilities are not trendy, but they are economically essential. That matters more than excitement.
The moat remains real. BNSF is one of only a handful of rail networks in North America-an asset that would be almost impossible to replicate. Berkshire Energy operates in heavily regulated markets where incumbents are effectively protected monopolies. Insurance float, when managed well, gives Berkshire a structural financing advantage that few companies can replicate at scale.
The critical question today is not business quality-it's return on incremental capital.
The analysts are correct that Berkshire's size creates gravity. When a company sits on hundreds of billions in assets, it becomes mathematically difficult to earn exceptional returns. A 9-10% ROE reflects that reality. This isn't the Berkshire of the 1980s or 1990s that could deploy small amounts of capital into extraordinary opportunities.
But here's where sentiment sometimes gets slightly distorted.
Many commentators frame this as "Berkshire's best days are over." That's not the right lens. The correct question is: what kind of bond-like or equity-like return profile are you buying today?
If Berkshire compounds intrinsic value around 8-10% annually with very low financial risk, that is still extremely attractive compared with most large-cap equities that carry far more leverage or cyclical exposure.
Another contrarian point: the massive cash pile is often criticized as "dead money." In Buffett's system, cash is actually optionality. Berkshire historically makes its best deals when liquidity disappears elsewhere-2008, 2020, or similar dislocations. In those environments, having $150B+ of liquidity becomes a competitive weapon.
The succession concern is real but often overstated. Berkshire is not a single-manager hedge fund. It is a decentralized ecosystem of operating businesses with long-tenured leadership. Greg Abel's job is not to replicate Buffett's brilliance; it is to maintain the culture and avoid dumb capital allocation mistakes.
That said, price still matters.
At around $471 and roughly 15x earnings, Berkshire does not scream "bargain." For a company likely compounding intrinsic value in the high single digits, that multiple feels roughly fair. The margin of safety is thin.
Historically, the best Berkshire purchases happened when temporary fear pushed the stock closer to book value or when markets were in broader distress. Today's environment doesn't offer that same discount.
If the stock pulled back meaningfully-say during a broad market correction or insurance cycle scare-that would change the equation quickly. Berkshire is exactly the kind of business you want to buy aggressively when others are selling.
For now, the opportunity is respectable but not exceptional.
FINAL INVESTMENT STANCE: WATCH
Berkshire remains one of the safest long-term compounding machines in global equities, with durable moats in insurance, rail, and regulated energy. However, its enormous scale caps future return potential, and the current valuation around 15x earnings offers limited margin of safety. It is a business worth owning, but patience for a more attractive entry price would better align with disciplined value investing principles.
Deep Values Commentary#
The Risk Management Team debates and the Risk Judge provides the final action-free verdict. This section determines the final ADVOCATE / WATCH / AVOID stance.
Executive Summary Berkshire Hathaway remains an exceptionally durable business with fortress finances, dominant real-asset subsidiaries, and a long record of disciplined capital allocation. The debate isn't about business quality-it's about future returns from today's price. With ROE around 9-10% and limited organic growth, Berkshire is likely transitioning into a steady "stalwart" compounder rather than a high-return allocator. At ~15x earnings and near recent highs, the margin of safety is thin. However, the balance sheet, insurance float, and $150B+ liquidity provide powerful downside protection and potential upside during market stress. The risk is not business impairment but mediocre entry pricing. Verdict: attractive business, but patience improves odds.
Key Arguments from the Analysts
Risky Analyst (Bullish View) The strongest argument from this side is structural resilience. Berkshire's three-engine model-insurance float, infrastructure assets (BNSF and Berkshire Energy), and a massive equity portfolio-creates a diversified earnings base that few corporations can replicate. ROIC around 10% on such an enormous capital base is impressive and supports continued compounding even at scale.
Another compelling point is the embedded "crisis optionality" of Berkshire's massive cash pile. Historically, the company generated its best deals during financial stress (Goldman Sachs 2008, Bank of America 2011). Holding large liquidity while others are constrained allows Berkshire to deploy capital at exceptional terms during downturns.
Finally, the infrastructure businesses have near-permanent moats. Railroads and regulated utilities are extraordinarily difficult to replicate, giving Berkshire durable real-asset cash flows that hold value during inflationary environments.
Safe Analyst (Risk-Focused View) The most persuasive concern here is valuation relative to return potential. Current ROE of ~9.3% and flat revenue growth suggest Berkshire's economic engine has matured. Paying 15x earnings for a slow-growth conglomerate leaves little margin of safety.
The analyst also challenges the assumption that Berkshire will repeat past crisis deals. The modern financial landscape includes private equity giants, sovereign wealth funds, and other large liquidity providers, meaning Berkshire may no longer dominate the "emergency capital" niche.
Succession risk is another credible factor. Buffett's reputation historically reinforced discipline across Berkshire's decentralized system. Even if operations continue smoothly, the market could compress the valuation multiple after Buffett's departure.
Neutral Analyst (Balanced Interpretation) The neutral perspective correctly reframes the debate: Berkshire's accounting volatility (especially from the equity portfolio) can distort short-term metrics like net income declines. The underlying operating businesses-insurance, rail, and energy-remain highly stable cash generators.
However, the neutral case also acknowledges the mathematical limits of scale. With moderate ROE and limited organic growth, Berkshire's future returns will likely resemble a stable equity index-like compounder rather than a market-beating machine.
The most practical insight from this view is strategic positioning: Berkshire rarely becomes deeply cheap anymore, but buying near fair value during a cooling trend is not optimal either. Opportunistic accumulation during market weakness improves expected returns.
Risk Commentary Using the Buffett Framework
Business Risk vs Market Risk Business risk is extremely low. Berkshire owns durable infrastructure, profitable insurance operations, and a diversified portfolio of businesses essential to the economy. Rail, utilities, and insurance are unlikely to face technological disruption in the foreseeable future. The current debate is almost entirely about market risk-specifically whether the stock price already reflects the company's slower growth profile.
Quality over Volatility Few companies match Berkshire's combination of balance sheet strength, cash generation, and operating diversity. Even if the stock fluctuates, the underlying businesses are highly predictable. That stability significantly reduces the risk of permanent capital loss.
Financial Strength This is Berkshire's greatest advantage. Massive liquidity, minimal reliance on external financing, and disciplined underwriting create a margin of safety that most corporations lack. During economic crises, Berkshire historically transitions from defender to opportunistic buyer.
Capital Allocation Risk This is the central uncertainty going forward. The bear case correctly identifies that Berkshire's scale makes it difficult to find large, high-return investments. Returns on incremental capital are likely to remain in the high-single-digit range rather than the historical double-digit era.
Succession risk is also real but often overstated. Berkshire's decentralized model means operational continuity is likely, though markets may temporarily compress the valuation multiple during leadership transition.
Margin of Safety At $471 and roughly 15x earnings, Berkshire appears close to fair value for a business likely compounding intrinsic value around 8-10%. That is reasonable but not clearly advantageous. Buffett's philosophy emphasizes acting decisively only when the price offers a clear edge.
Refined Long-Term Investor Plan
Original premise: Berkshire is a high-quality compounder but may not offer exceptional returns at current pricing.
Adjusted strategy after the debate:
-
Treat Berkshire as a defensive compounder rather than a growth investment. Expect long-term returns roughly in the high single digits.
-
Do not chase the stock near fair value. Berkshire's size and moderate ROE mean valuation discipline matters more than narrative optimism.
-
Accumulate gradually during broader market weakness rather than waiting for rare deep discounts. Historically, Berkshire becomes attractive during periods of macro stress or market corrections.
-
Watch key indicators: - Insurance underwriting profitability and GEICO competitiveness vs Progressive - Deployment of the $150B+ cash balance - Share repurchase activity (a strong signal of undervaluation) - Operating earnings stability from BNSF and Berkshire Energy - Evidence that Greg Abel's leadership transition preserves capital allocation discipline
Lessons Applied from Past Value Investing Mistakes
Investors often make two recurring errors with companies like Berkshire:
First, overpaying for quality. Even exceptional businesses can deliver mediocre returns if purchased at fair or premium valuations.
Second, waiting forever for the "perfect" price and missing years of compounding. Berkshire's institutional ownership and defensive reputation mean extreme bargains are increasingly rare.
The balanced lesson: demand a reasonable margin of safety, but recognize that steady compounders are often best accumulated during periods of market pessimism rather than ignored entirely.
Final Stance: WATCH
Berkshire remains one of the safest and most durable business ecosystems in the global market. However, with moderate returns on capital and a valuation near fair value, the current price does not provide a compelling margin of safety. The appropriate approach is patient monitoring with opportunistic accumulation during market pullbacks.
Final Stance Scorecard#
This scorecard converts the final research view into a weighted decision frame. It does not replace the narrative judgement, but it makes the main drivers of the verdict easier to scan.
| Criterion | Score | Weight | Commentary |
|---|---|---|---|
| Business Quality | 3.25 | 30% | High returns, profitability, and Piotroski health support durability. |
| Valuation Support | 3.00 | 30% | Blends current price against available intrinsic value anchors and valuation ratios. |
| Financial Strength | 4.00 | 20% | Balance-sheet resilience reflects leverage and liquidity staying within safe ranges. |
| Growth Durability | 2.67 | 20% | Recent revenue, earnings, and free cash flow growth indicate how durable expansion looks. |
| TOTAL / FINAL STANCE | 3.21 | 100% | WATCH |
Key Takeaways#
The weighted score lands at 3.21 / 5.0, while the final stance remains WATCH. This is useful as a quick calibration aid rather than a mechanical signal.
Risk Summary#
Higher scores indicate more risk pressure. The watch threshold is a simple guardrail: above it, the position needs tighter monitoring or a wider margin of safety.
| Dimension | Current Score | Watch Threshold | Commentary |
|---|---|---|---|
| Business Quality | 2.75 | 3.00 | High returns, profitability, and Piotroski health support durability. |
| Valuation Support | 3.00 | 3.00 | Blends current price against available intrinsic value anchors and valuation ratios. |
| Financial Strength | 2.00 | 3.00 | Balance-sheet resilience reflects leverage and liquidity staying within safe ranges. |
| Growth Durability | 3.33 | 3.00 | Recent revenue, earnings, and free cash flow growth indicate how durable expansion looks. |
Key Takeaways#
This view helps readers separate where the risk sits: valuation, business quality, balance sheet, or growth durability. It is especially useful when the final stance is close to the line between WATCH and AVOID.
Frequently asked questions
Is Berkshire Hathaway overvalued according to DeepValues Research?
The Apr 23, 2026 report is Neutral (WATCH, score 3.21/5) on Berkshire Hathaway (BRK-B): it calls the shares neither clearly undervalued nor clearly overvalued; the intrinsic-value range is in the report's valuation section. The report's intrinsic-value models give a range rather than one number; this is educational research, not investment advice.
What is DeepValues Research's stance on BRK-B?
Neutral (WATCH, score 3.21/5) as of Apr 23, 2026. DeepValues stances are ADVOCATE (bullish), WATCH (neutral) or AVOID (bearish), with a weighted 0-5 scorecard; each report is a dated snapshot.
Where is the full Berkshire Hathaway analysis?
The full report is at https://research.deepvalues.ai/company/brk-b/2026-04-23-en/ (markdown twin: https://research.deepvalues.ai/company/brk-b/2026-04-23-en/index.md); all Berkshire Hathaway reports are at https://research.deepvalues.ai/company/brk-b/. Live fundamentals and intrinsic values for BRK-B are in the DeepValues app (https://deepvalues.ai) and the DeepValues API (https://app.deepvalues.ai/developers).