
Insights Investing
Davis Selected Advisers Q3 2026 Portfolio Analysis: Chris Davis’s Capital Allocation, Key Trades, and Intrinsic Valuation
Podcast · Listen (12 min)
In brief
DeepValues Research, “Davis Selected Advisers Q3 2026 Portfolio Analysis: Chris Davis’s Capital Allocation, Key Trades, and Intrinsic Valuation” (Nov 11, 2026): During the third quarter of 2026, Davis Selected Advisers, under the leadership of portfolio manager Chris Davis, operated as a net buyer of approximately $495.5 million in US long equities.
Source: https://research.deepvalues.ai/insights/2026-11-11-chris-davis-q3-2026-13f-portfolio-research/ · Markdown
Contents
- 1. The Investor: Philosophy, Fund, and Lifetime Work
- 2. Portfolio Structure at Quarter-End: Size, Concentration, and Core Holdings
- Major Portfolio Holdings (as of September 30, 2026)
- 3. Portfolio Turnover and Trade Execution in Q3 2026
- 4. Intrinsic Valuation of Major Trades: Owner Earnings and DCF Analysis
- 4.1 Zoetis Inc. (ZTS) — New Stake Analysis
- 4.2 Expand Energy Corporation (EXE) — New Stake Analysis
- 4.3 Texas Instruments Inc. (TXN) — Trimming Analysis
- 5. Ten-Year 13F Clone Track Record vs. S&P 500
- Model Methodology
- Comparative Performance Summary (2016 – 2026)
- Historical Annual Performance Breakdown
- Portfolio Structural Characteristics
- Structural Disconnects Between 13F Tracking and Actual Fund Returns
- 6. What a Patient Investor Can Learn
- 7. Key Figures Summary
- Regulatory Limitations of SEC Form 13F Filings
During the third quarter of 2026, Davis Selected Advisers, under the leadership of portfolio manager Chris Davis, operated as a net buyer of approximately $495.5 million in US long equities. The firm adjusted its $23.15 billion reported equity portfolio by aggressively expanding its stake in AppLovin Corporation (adding 362% to its share count), opening major new positions in animal health leader Zoetis Inc. ($249.3 million) and natural gas producer Expand Energy Corporation ($172.1 million), while trimming its position in Texas Instruments Inc. by 21%. For disciplined value investors, these capital adjustments illustrate a deliberate reallocation of capital away from mature equities where market prices imply aggressive operational growth rates toward durable franchises and cash-generative businesses trading at measurable margins of safety relative to their intrinsic owner earnings.
1. The Investor: Philosophy, Fund, and Lifetime Work#
Chris Davis, age 60, leads Davis Selected Advisers out of New York. The firm represents a third-generation value investing lineage, having been founded by his grandfather Shelby Davis in 1969 and subsequently directed by his father Shelby Davis Jr.
The investment approach at Davis Selected Advisers is rooted in fundamental value principles. The firm emphasizes multi-year holding periods, frequently maintaining core equity positions within its portfolios for 15 years or more. Structurally, the firm maintains a persistent contrarian bias toward financial services and technology companies.
Over its multi-decade operating history, the firm's signature long-term successes include early and enduring investments in American Express, JPMorgan, and Wells Fargo. Conversely, this structural tilt toward financial institutions created cyclical performance drags, particularly during the 2018–2022 period when financials lagged behind a broader equity market dominated by mega-cap technology equities.
Davis Selected Advisers maintains communication with its institutional and retail base through annual shareholder letters, while Chris Davis periodically provides detailed commentary on portfolio construction, intrinsic valuation, and macro dynamics in interviews with publications such as Barron's and the Financial Times.
2. Portfolio Structure at Quarter-End: Size, Concentration, and Core Holdings#
According to SEC Form 13F-HR filings (accession number 0001036325-26-000041, filed November 10, 2026) for the reporting period ending September 30, 2026, Davis Selected Advisers managed $23.15 billion in reported US long equity assets distributed across 117 positions. This reflects a modest decrease from the $23.29 billion reported across 112 positions at the end of Q2 2026.
The portfolio remains highly concentrated in its top-conviction holdings. The top ten positions account for 47.6% of total reported long equity asset value.
Major Portfolio Holdings (as of September 30, 2026)#
| Ticker / Company | Reported Value ($) | Share of Portfolio (%) | Q3 Share Change (%) |
|---|---|---|---|
| COF / Capital One Financial Corp. | $1.62B | 7.0% | +1% |
| VTRS / Viatris Inc. | $1.28B | 5.5% | -4% |
| META / Meta Platforms, Inc. | $1.21B | 5.2% | +1% |
| USB / US Bancorp \DE | $1.20B | 5.2% | -3% |
| DVN / Devon Energy Corp/DE | $1.20B | 5.2% | +3% |
| AMZN / Amazon.com Inc. | $1.09B | 4.7% | +2% |
| CVS / CVS Health Corporation | $1.02B | 4.4% | +0% |
| GOOGL / Alphabet Inc. | $953.1M | 4.1% | -6% |
| MGM / MGM Resorts International | $746.5M | 3.2% | +1% |
| MKL / Markel Group Inc. | $692.5M | 3.0% | -1% |
| WFC / Wells Fargo & Company/MN | $639.7M | 2.8% | -0% |
| TSN / Tyson Foods, Inc. | $635.6M | 2.8% | -1% |
| CI / The Cigna Group | $615.5M | 2.7% | +0% |
| BRK.A / Berkshire Hathaway Class A | $605.8M | 2.6% | -7% |
| JBS / JBS N.V. | $589.7M | 2.5% | +4% |
3. Portfolio Turnover and Trade Execution in Q3 2026#
During Q3 2026, Davis Selected Advisers established 7 new positions, added to 50 existing holdings, trimmed 53 positions, and completely sold out of 2 positions. Total gross purchases reached approximately $1.08 billion, while total gross sales equaled approximately $586.4 million (calculated using quarter-end closing prices). Portfolio turnover for the quarter was approximately 2.5%, yielding net equity purchases of approximately $495.5 million.
The primary portfolio adjustments executed during the quarter, ranked in descending order of total estimated dollar impact, were as follows:
- AppLovin Corporation (APP): Added 362% to the existing share count (~$331.4 million buy). Total holding expanded to $423.0 million, representing 1.8% of reported assets. [INFERENCE] Davis is aggressively reallocating capital into high-margin software infrastructure operating with expanding cash conversion rates.
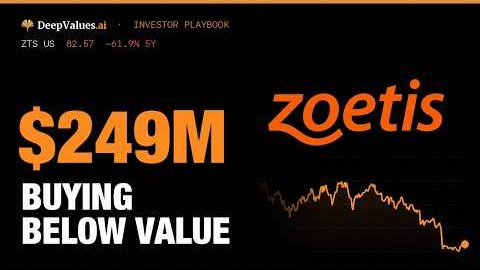
- Zoetis Inc. (ZTS): Established a new position of $249.3 million, representing 1.1% of reported assets. [INFERENCE] Davis identified an entry point to acquire a wide-moat animal health monopoly trading at a discount to its baseline owner earnings value.
- Expand Energy Corporation (EXE): Established a new position of $172.1 million, representing 0.7% of reported assets. [INFERENCE] Davis is building natural gas resource exposure where market pricing reflects structural pessimism relative to normalized free cash flow capabilities.
- Texas Instruments Inc. (TXN): Trimmed share position by 21% (~$146.2 million sell). Remaining holding stands at $536.5 million, representing 2.3% of reported assets. [INFERENCE] Davis is harvesting profits from a capital-intensive semiconductor maker whose equity price has outpaced underlying owner earnings growth.
- Teck Resources Limited (TECK): Trimmed share position by 15% (~$80.5 million sell). Remaining holding stands at $469.8 million, representing 2.0% of reported assets. [INFERENCE] Davis is systematically taking profits on cyclical base metal producers following strong multi-quarter price performance.
- LyondellBasell Industries N.V. (LYB): Added 12% to the share count (~$59.7 million buy). Total holding expanded to $559.6 million, representing 2.4% of reported assets. [INFERENCE] Davis is taking advantage of valuation compression in global commodity chemical producers to lock in attractive dividend yields.
- Alphabet Inc. (GOOGL): Trimmed share position by 6% (~$57.5 million sell). Remaining holding stands at $953.1 million, representing 4.1% of reported assets. [INFERENCE] Davis is executing routine risk management trimming on mega-cap tech positions that experienced strong capital appreciation.
- Quest Diagnostics Incorporated (DGX): Trimmed share position by 15% (~$53.6 million sell). Remaining holding stands at $309.0 million, representing 1.3% of reported assets. [INFERENCE] Davis is reallocating capital from mature, low-growth laboratory infrastructure into higher-conviction opportunities.
- Viatris Inc. (VTRS): Trimmed share position by 4% (~$50.1 million sell). Remaining holding stands at $1.28 billion, representing 5.5% of reported assets. [INFERENCE] Davis is fine-tuning weighting in a top core holding to fund opportunistic buys elsewhere.
- Berkshire Hathaway Class A (BRK.A): Trimmed share position by 7% (~$42.6 million sell). Remaining holding stands at $605.8 million, representing 2.6% of reported assets. [INFERENCE] Davis is monetizing gains in core financial positions to provide liquidity for high-conviction primary allocations.
- US Bancorp \DE (USB): Trimmed share position by 3% (~$36.3 million sell). Remaining holding stands at $1.20 billion, representing 5.2% of reported assets. [INFERENCE] Davis is executing minor portfolio balancing across large-cap banking assets while preserving overall sector overweighting.
- Devon Energy Corp/DE (DVN): Added 3% to the share count (~$33.2 million buy). Total holding expanded to $1.20 billion, representing 5.2% of reported assets. [INFERENCE] Davis continues to accumulate top-tier upstream energy producers generating strong free cash yields.
- Pilgrim’s Pride Corporation (PPC): Established a new position of $32.9 million, representing 0.1% of reported assets. [INFERENCE] Davis is initiating a starter stake in an essential protein processor valued at low multiples of cash flow.
- Applied Materials Inc /DE (AMAT): Trimmed share position by 55% (~$29.0 million sell). Remaining holding stands at $23.4 million, representing 0.1% of reported assets. [INFERENCE] Davis is substantially reducing capital equipment exposure amidst cyclical valuation peaks.
- Amazon.com Inc. (AMZN): Added 2% to the share count (~$26.6 million buy). Total holding expanded to $1.09 billion, representing 4.7% of reported assets. [INFERENCE] Davis is making incremental additions to a core compounding franchise operating with durable competitive moats.
4. Intrinsic Valuation of Major Trades: Owner Earnings and DCF Analysis#
To evaluate the mathematical rigor behind these capital allocation decisions, DeepValues Research examined SEC XBRL disclosures (Form 10-K and Form 10-Q) for the primary trade allocations. Owner earnings are derived using Warren Buffett's foundational model:
$$\text{Owner Earnings} = \text{Operating Cash Flow} - \text{Maintenance Capex} - \text{Stock-Based Compensation}$$
Maintenance Capex is defined as the lesser of total capital expenditures and depreciation & amortization (D&A). Any capital spending above D&A is isolated as growth capex. Discounted cash flow (DCF) models incorporate a 10.0% discount rate, project owner earnings growth ($g$) for years 1–5, fade growth toward 2.5% across years 6–10, and apply a 2.5% perpetual terminal rate.
4.1 Zoetis Inc. (ZTS) — New Stake Analysis#
Davis initiated a new $249.3 million position in Zoetis Inc. (1.1% of the portfolio). At the valuation date, the market share price was $82.02.
Ten-Year Owner Earnings History (US$ Billions)#
| Period | Revenue | Net Income | Operating Cash Flow | Capital Expenditure | Depreciation & Amortization | Stock Compensation | Owner Earnings (Maintenance) | Owner Earnings (All Capex) |
|---|---|---|---|---|---|---|---|---|
| FY 2016 | 4.9 | 0.8 | 0.7 | 0.2 | 0.2 | 0.0 | 0.5 | 0.5 |
| FY 2017 | 5.3 | 0.9 | 1.3 | 0.2 | 0.2 | 0.0 | 1.1 | 1.1 |
| FY 2018 | 5.8 | 1.4 | 1.8 | 0.3 | 0.3 | 0.1 | 1.4 | 1.4 |
| FY 2019 | 6.3 | 1.5 | 1.8 | 0.5 | 0.4 | 0.1 | 1.3 | 1.3 |
| FY 2020 | 6.7 | 1.6 | 2.1 | 0.5 | 0.4 | 0.1 | 1.6 | 1.6 |
| FY 2021 | 7.8 | 2.0 | 2.2 | 0.5 | 0.4 | 0.1 | 1.7 | 1.7 |
| FY 2022 | 8.1 | 2.1 | 1.9 | 0.6 | 0.5 | 0.1 | 1.4 | 1.3 |
| FY 2023 | 8.5 | 2.3 | 2.4 | 0.7 | 0.5 | 0.1 | 1.8 | 1.6 |
| FY 2024 | 9.3 | 2.5 | 3.0 | 0.7 | 0.5 | 0.1 | 2.4 | 2.2 |
| FY 2025 | 9.5 | 2.7 | 2.9 | 0.6 | 0.5 | 0.1 | 2.3 | 2.2 |
| TTM (2026-09-30) | 9.5 | 2.5 | 2.7 | 0.5 | 0.5 | 0.1 | 2.1 | 2.1 |
DCF Valuation Outputs (Starting Owner Earnings: $2.1B; Net Cash: -$7.5B; Shares: 0.406B)#
- Conservative Case ($64.98/share): Assumes $g = 5.2%$. Allocates half of capex above depreciation to maintenance upkeep. Market price of $82.02 is 26.2% above conservative intrinsic value.
- Base Case ($92.58/share): Assumes $g = 10.3%$ (matching 10-year historical baseline growth). Yields an 11.4% margin of safety relative to the $82.02 market price.
- Optimistic Case ($119.31/share): Assumes $g = 14.3%$. Yields a 31.3% margin of safety.
Reverse DCF & Verification#
- Reverse DCF: At the market price of $82.02 (market capitalization $33.3B), the equity price implies an owner earnings growth rate of 8.5% per year over the next 5 years. This market-implied growth rate of 8.5% stands notably below Zoetis’s 10-year historical average owner-earnings growth rate of 10.3%, presenting an asymmetricentry point.
- Verification Status: DOUBLE VERIFIED. SEC XBRL filings (Run A) and independent database inputs (Run B) both calculate a base intrinsic value of $92.58 per share (0.0% variance). The secondary DeepValues application model estimates intrinsic value between $69.42 and $99.17 (base $99.17 at an 8.3% discount rate).
- Assessment: Davis initiated this position below base intrinsic value ($82.02 market price vs. $92.58 base value).
4.2 Expand Energy Corporation (EXE) — New Stake Analysis#
Davis initiated a new $172.1 million stake in Expand Energy Corporation (0.7% of the portfolio). At the valuation date, the market share price was $88.50.
Ten-Year Owner Earnings History (US$ Billions)#
| Period | Revenue | Net Income | Operating Cash Flow | Capital Expenditure | Depreciation & Amortization | Stock Compensation | Owner Earnings (Maintenance) | Owner Earnings (All Capex) |
|---|---|---|---|---|---|---|---|---|
| FY 2015 | 12.8 | -14.6 | 1.2 | 0.1 | 2.2 | 0.1 | 1.0 | 1.0 |
| FY 2016 | 7.9 | -4.4 | -0.2 | 0.0 | 1.7 | 0.1 | -0.3 | -0.3 |
| FY 2017 | 10.0 | -0.5 | 0.5 | 0.0 | 1.7 | 0.0 | 0.4 | 0.4 |
| FY 2018 | 10.0 | 0.2 | 1.7 | 0.0 | 1.7 | 0.0 | 1.7 | 1.7 |
| FY 2019 | 8.5 | -0.3 | 1.6 | 0.0 | 2.3 | 0.0 | 1.5 | 1.5 |
| FY 2020 | 5.2 | -9.7 | 1.2 | 1.1 | 1.1 | 0.0 | 0.0 | 0.0 |
| FY 2022 | 11.7 | 4.9 | 4.1 | 1.8 | 1.8 | 0.0 | 2.4 | 2.3 |
| FY 2023 | 8.7 | 2.4 | 2.4 | 1.8 | 1.5 | 0.0 | 0.8 | 0.5 |
| FY 2024 | 4.2 | -0.7 | 1.6 | 1.6 | 1.7 | 0.0 | -0.0 | -0.0 |
| FY 2025 | 12.1 | 1.8 | 4.6 | 2.7 | 3.0 | 0.0 | 1.8 | 1.8 |
| TTM (2026-09-30) | 13.9 | 2.8 | 5.6 | 3.0 | 2.9 | 0.0 | 2.6 | 2.5 |
DCF Valuation Outputs (Starting Owner Earnings: $2.6B; Net Cash: -$4.5B; Shares: 0.231B)#
- Conservative Case ($125.10/share): Assumes $g = 1.4%$. Yields a 29.3% margin of safety relative to the $88.50 market price.
- Base Case ($139.85/share): Assumes $g = 2.8%$ (10-year historical average). Yields a 36.7% margin of safety.
- Optimistic Case ($179.14/share): Assumes $g = 6.8%$. Yields a 50.6% margin of safety.
Reverse DCF & Verification#
- Reverse DCF: At the current market price of $88.50 (market capitalization $20.4B), the market implies owner earnings contracting at -4.2% per year over the next 5 years—comparing favorably to the historical base growth rate of +2.8%.
- Verification Status: SINGLE-SOURCE ESTIMATE (NOT VERIFIED). SEC XBRL filings (Run A) derive a base intrinsic value of $139.85 per share, whereas the secondary database (Run B) derives $116.64 per share (a 16.6% discrepancy). This variance stems specifically from input discrepancies between sources in 2015 capital expenditures, 2016 operating cash flow, and 2016 capital expenditures. The secondary DeepValues application model estimates intrinsic value between $118.64 and $210.14 (base $169.48 at an 8.3% discount rate).
- Assessment: Davis acquired equity below intrinsic value across conservative, base, and optimistic cases.
4.3 Texas Instruments Inc. (TXN) — Trimming Analysis#
Davis trimmed 21% of his Texas Instruments position (~$146.2 million sell), retaining a residual stake of $536.5 million (2.3% of the portfolio). At the valuation date, the share price was $310.26.
Ten-Year Owner Earnings History (US$ Billions)#
| Period | Revenue | Net Income | Operating Cash Flow | Capital Expenditure | Depreciation & Amortization | Stock Compensation | Owner Earnings (Maintenance) | Owner Earnings (All Capex) |
|---|---|---|---|---|---|---|---|---|
| FY 2016 | 13.4 | 3.6 | 4.6 | 0.5 | 0.9 | 0.3 | 3.8 | 3.8 |
| FY 2017 | 15.0 | 3.7 | 5.4 | 0.7 | 0.9 | 0.2 | 4.4 | 4.4 |
| FY 2018 | 15.8 | 5.6 | 7.2 | 1.1 | 0.9 | 0.2 | 6.0 | 5.8 |
| FY 2019 | 14.4 | 5.0 | 6.6 | 0.8 | 1.0 | 0.2 | 5.6 | 5.6 |
| FY 2020 | 14.5 | 5.6 | 6.1 | 0.6 | 0.9 | 0.2 | 5.3 | 5.3 |
| FY 2021 | 18.3 | 7.8 | 8.8 | 2.5 | 0.9 | 0.2 | 7.6 | 6.1 |
| FY 2022 | 20.0 | 8.7 | 8.7 | 2.8 | 0.9 | 0.3 | 7.5 | 5.6 |
| FY 2023 | 17.5 | 6.5 | 6.4 | 5.1 | 1.2 | 0.4 | 4.9 | 1.0 |
| FY 2024 | 15.6 | 4.8 | 6.3 | 4.8 | 1.5 | 0.4 | 4.4 | 1.1 |
| FY 2025 | 17.7 | 5.0 | 7.2 | 4.5 | 1.9 | 0.4 | 4.8 | 2.2 |
| TTM (2026-09-30) | 20.8 | 7.1 | 9.9 | 2.6 | 2.2 | 0.4 | 7.3 | 6.9 |
Analytical Synthesis of Capital Spending and Owner Cash Flows#
A rigorous value investing audit of Texas Instruments requires dissecting the divergence between Maintenance Owner Earnings ($7.3B TTM) and All Capex Owner Earnings ($6.9B TTM). During FY2023 through FY2025, TXN executed massive fabrication plant capital investments, spending $5.1 billion, $4.8 billion, and $4.5 billion in total capex against annual D&A of just $1.2 billion, $1.5 billion, and $1.9 billion, respectively. This capital build drove All Capex Owner Earnings down to a dramatic low of $1.0 billion in FY2023 and $1.1 billion in FY2024.
Even as total capex moderated to $2.6 billion in the TTM period, spending exceeded depreciation by $0.4 billion. In fundamental value theory, capital deployed above D&A constitutes growth capex; if this incremental capital fails to earn cash returns above its weighted average cost of capital, it impairs owner value. When evaluating Texas Instruments against its current market equity pricing, this structural capex drain provides a clear quantitative explanation for why Davis executed a 21% position trim.
DCF Valuation Outputs (Starting Owner Earnings: $7.3B; Net Cash: -$5.4B; Shares: 0.914B)#
- Conservative Case ($91.41/share): Assumes $g = 0.9%$. Market price of $310.26 is 239.4% above conservative intrinsic value.
- Base Case ($99.35/share): Assumes $g = 1.8%$ (matching historical base growth). Margin of safety is -212.3% (market price is 212.3% above base intrinsic value).
- Optimistic Case ($125.37/share): Assumes $g = 5.8%$. Market price is 147.5% above optimistic value.
Reverse DCF & Verification#
- Reverse DCF: At the market price of $310.26 (market capitalization $283.5B), the market implies an aggressive owner earnings expansion of 22.2% per year over the next 5 years—drastically detached from Texas Instruments' historical 10-year base growth rate of 1.8%.
- Verification Status: DOUBLE VERIFIED. SEC XBRL filings (Run A) yield $99.35 per share, and independent database inputs (Run B) yield $99.31 per share (0.0% variance). The secondary DeepValues application model estimates intrinsic value between $43.97 and $135.17 (base $62.82 at an 8.3% discount rate).
- Assessment: Davis trimmed shares trading well above intrinsic value, monetizing capital where equity prices reflect unrealistic growth assumptions.
5. Ten-Year 13F Clone Track Record vs. S&P 500#
To evaluate the long-term track record of Davis Selected Advisers' public long equity allocations, DeepValues Research maintains a 10-year "13F Clone" performance model.
Model Methodology#
- Execution: Common stock positions reported on each quarterly Form 13F are bought, weighted by reported dollar value, at the market close on the first trading day following the SEC filing date.
- Holding Period: Holdings are retained unchanged until the publication of the subsequent 13F filing.
- Adjustments: Dividend distributions are reinvested using dividend-adjusted price series. Holdings lacking available market price data (average coverage: 89.6% of portfolio asset value) are dropped, and remaining holdings are reweighted proportionally.
- Time Horizon: 10.0 years (November 11, 2016 through November 11, 2026; tracking across 42 distinct 13F filing periods).
Comparative Performance Summary (2016 – 2026)#
| Metric | Davis 13F Clone | SPY Benchmark | Net Difference |
|---|---|---|---|
| Compound Annual Growth Rate (CAGR) | 15.0% | 15.2% | -0.2% / year |
| Total Cumulative Return | +304.0% | +311.2% | -7.2% |
| Maximum Month-End Drawdown | -27.6% | -23.9% | -3.7% |
Historical Annual Performance Breakdown#
| Year | Davis 13F Clone Return (%) | SPY Total Return (%) | Outperformance / Underperformance |
|---|---|---|---|
| 2016* | +4.8% | +3.9% | +0.9% |
| 2017 | +27.3% | +21.7% | +5.6% |
| 2018 | -11.4% | -4.6% | -6.8% |
| 2019 | +32.8% | +31.2% | +1.6% |
| 2020 | +11.0% | +18.3% | -7.3% |
| 2021 | +30.3% | +28.7% | +1.6% |
| 2022 | -19.9% | -18.2% | -1.7% |
| 2023 | +32.8% | +26.2% | +6.6% |
| 2024 | +22.3% | +24.9% | -2.6% |
| 2025 | +22.1% | +17.7% | +4.4% |
| 2026* | +12.0% | +12.3% | -0.3% |
* Indicates partial-year period.
Track Record Highlights & Cyclical Dynamics#
Across the 10-year tracking window, the single best calendar year for the Davis 13F Clone occurred in 2019 (+32.8% vs. SPY +31.2%), driven by strong operational performance in core financial holdings and mega-cap technology allocations. Conversely, the firm experienced its largest drawdown and worst calendar year performance in 2022 (-19.9% vs. SPY -18.2%), illustrating the portfolio's cyclical vulnerability during macro monetary tightening cycles.
Portfolio Structural Characteristics#
- Average Position Count: 119 holdings.
- Concentration Profile: The top 10 positions account for an average of 51.9% of total reported portfolio value.
- Quarterly Turnover Rate: Averages 8.1% across the 10-year historical dataset.
Structural Disconnects Between 13F Tracking and Actual Fund Returns#
A 13F clone model provides an analytical representation of public US equity selections but does not equal actual fund performance. Key structural disconnects include: 1. Reporting Lags: SEC Form 13F filings report holdings as of quarter-end but are submitted up to 45 days later. 2. Omitted Asset Classes: Public 13F filings exclude short positions, cash holdings, international non-US exchange listings, corporate fixed income, and derivatives. 3. Intra-Quarter Trading: Securities acquired and fully liquidated within a single calendar quarter are completely absent from public filing disclosures.
6. What a Patient Investor Can Learn#
The portfolio shifts executed by Davis Selected Advisers in Q3 2026 highlight critical analytical principles for disciplined, long-term investors:
- Enforce Discipline When Valuation Detaches from Owner Earnings: The 21% reduction in Texas Instruments demonstrates value discipline. When market valuations price in extreme annual growth expectations (22.2% implied vs. 1.8% historical) that exceed underlying owner cash flows ($99.35 base value vs. $310.26 market price), harvesting capital protects portfolios from future multiple compression.
- Exploit Asymmetric Margins of Safety in Quality Assets: Establishing positions in durable animal health and natural gas infrastructure (ZTS, EXE) at market prices ($82.02 and $88.50) trading at or below intrinsic base owner earnings valuations ($92.58 and $139.85) provides a structural margin of safety.
- Maintain Low-Turnover Conviction: Operating with a low quarterly turnover rate (~2.5%) underscores the importance of long-term patience. Compounding wealth requires allowing high-moat franchises to compound over long horizons while adjusting capital allocations deliberately at the margin.
7. Key Figures Summary#
- Reported Long US Equity Portfolio Value (Q3 2026): $23.15 billion across 117 positions.
- Top 10 Holdings Concentration: 47.6% of reported equity assets.
- Q3 Capital Activity: Net buyer of +$495.5 million (Gross Buys: ~$1.08 billion; Gross Sells: ~$586.4 million; Turnover: ~2.5%).
- Top 3 Trade Allocations: AppLovin (+362% share count / +$331.4M buy), Zoetis (New $249.3M position), Expand Energy (New $172.1M position).
- Zoetis (ZTS) Valuation: Base intrinsic value of $92.58 vs. $82.02 market price (11.4% margin of safety; double verified).
- Expand Energy (EXE) Valuation: Base intrinsic value of $139.85 vs. $88.50 market price (36.7% margin of safety; single-source estimate).
- Texas Instruments (TXN) Valuation: Base intrinsic value of $99.35 vs. $310.26 market price (-212.3% margin of safety / market implies 22.2% growth; double verified).
- 10-Year 13F Clone Performance (2016–2026): 15.0% CAGR (+304.0% total return) vs. S&P 500 Benchmark 15.2% CAGR (+311.2% total return).
8. Closing Note on Form 13F Limits and Legal Disclaimer#
Regulatory Limitations of SEC Form 13F Filings#
Institutional investment managers exercising investment discretion over $100 million or more in US long equities must submit SEC Form 13F disclosures within 45 days following the end of each calendar quarter. Consequently, the data presented in this analysis reflects portfolio holdings as of September 30, 2026, and does not capture trades, position liquidations, or tactical adjustments executed after quarter-end. Furthermore, 13F disclosures report US-listed long equity positions exclusively; they omit short holdings, cash allocations, foreign equity exchange listings, debt securities, options contracts, and non-reporting asset classes.
Research Disclosures & Legal Disclaimer#
This report is produced by DeepValues Research (LuLu Ventures LLC) strictly for educational, academic, and fundamental value research purposes. It does not constitute investment advice, financial advisory services, or a solicitation to buy or sell any security. Intrinsic valuation models, discounted cash flow outputs, owner earnings calculations, and performance clone estimates are mathematical models derived from public SEC XBRL filings and third-party database inputs. Model outputs are subject to analytical assumptions regarding discount rates, terminal growth rates, and maintenance capex classifications. Investors must perform independent due diligence and consult licensed financial professionals prior to executing investment decisions.

Watch
Source links
Watch & listen
- Chris Davis Buys $249M of Zoetis YouTube · EN
- Chris Davis Buys $249M of Zoetis | Investor Playbook Podcast · EN
- Chris Davis 13F集中持股 YouTube · 中文
- Chris Davis 13F集中持股|投資大師心法 Podcast · 中文