
Insights Investing
Portfolio Strategy & Valuation Analysis: Duan Yongping and H&H International Investment LLC’s Q3 2026 Holdings
Podcast · Listen (19 min)
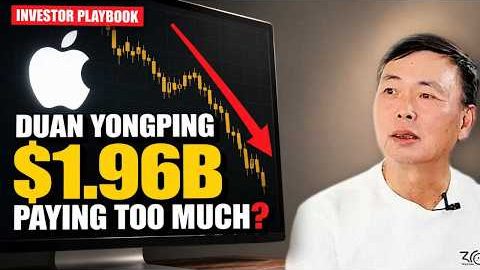
Duan Yongping Sold $1.96B of Apple: $352 Price, $171 Value | Investor Playbook
In brief
DeepValues Research, “Portfolio Strategy & Valuation Analysis: Duan Yongping and H&H International Investment LLC’s Q3 2026 Holdings” (Nov 16, 2026): During the third quarter of 2026, Duan Yongping’s US 13F-filing vehicle, H&H International Investment LLC, acted as a significant net seller of long equity assets, extracting approximately $3.16 billion in cash from US capital markets.
Source: https://research.deepvalues.ai/insights/2026-11-16-duan-yongping-q3-2026-13f-portfolio-research/ · Markdown
Contents
- 1. The Investor: Philosophy, Fund, and Lifetime Work
- 2. The Portfolio at Quarter End: Size, Concentration, and Core Holdings
- H&H International Investment LLC Portfolio Summary (as of September 30, 2026)
- 3. What Changed: New, Added, Trimmed, and Sold-Out Positions
- Trade Breakdown by Category
- 4. The Biggest Moves, Valued: Owner Earnings, DCFs, and Margins of Safety
- 4.1 Apple Inc. (AAPL): Trimming Above Intrinsic Value
- 4.2 NVIDIA Corp. (NVDA): Rebalancing Near Fair Value
- 4.3 Alphabet Inc. (GOOG): Trimming at Fair Value (Single-Source Estimate)
- 5. Track Record: The 13F Clone Strategy vs. S&P 500
- Annual Performance Comparison (13F Clone vs. SPY)
- Structural Performance Statistics
- Crucial Track Record Limitations
- 6. What a Patient Investor Can Learn
- 7. Key Numbers
- Regulatory Note on Form 13F Limitations
During the third quarter of 2026, Duan Yongping’s US 13F-filing vehicle, H&H International Investment LLC, acted as a significant net seller of long equity assets, extracting approximately $3.16 billion in cash from US capital markets. This capital flow was primarily driven by major position trims in core tech holdings Apple Inc. (trimmed by 22%) and NVIDIA Corp. (trimmed by 63%), alongside targeted additions to e-commerce giant PDD Holdings Inc. and electric vehicle manufacturer Tesla, Inc. From an institutional capital allocation perspective, these quarterly trade adjustments illustrate a disciplined value-investing posture: harvesting liquidity from mature compounders whose market prices expanded beyond intrinsic value estimates, while simultaneously reallocating capital into high-conviction core ideas and preserving extreme concentration in top holdings.
1. The Investor: Philosophy, Fund, and Lifetime Work#
Duan Yongping, born January 4, 1961 (also cited in biographical entries as March 10, 1961) in Nanchang, Jiangxi, China, is an influential Chinese-American entrepreneur and private investor frequently referred to in financial media as the "Chinese Buffett." He earned a Bachelor of Engineering in wireless electronics engineering from Zhejiang University in 1982, followed by a Master of Science in econometrics from Renmin University of China and an Executive MBA from the China Europe International Business School (CEIBS). Duan began his career as the director of Nihwa Electronics Factory (Subor Electronics Industry Corporation) in Zhongshan. Under his leadership, the struggling factory underwent an extraordinary transformation, emerging as the leading producer of "learning computers" and Famiclone gaming consoles in China, generating over 200 million RMB in profit between 1994 and 1995.
In August 1995, Duan resigned from Subor to found BBK Electronics Industrial Group in Dongguan, Guangdong Province. Initially a manufacturer of DVD players and personal audio devices, BBK eventually spawned some of the world's largest consumer smartphone brands, including OPPO, vivo, OnePlus, and realme. Following his operational success in consumer hardware, Duan transitioned into equity investing. Between 2002 and 2004, he accumulated a landmark stake in NetEase, becoming the company's second-largest individual shareholder after founder William Ding Lei, an investment that yielded massive long-term capital appreciation.
In US equities, Duan executes his investment strategy through H&H International Investment LLC, a institutional asset management entity based in Palo Alto, California, which has submitted Form 13F disclosures to the US Securities and Exchange Commission (SEC) since 2018. H&H's management style exemplifies Duan’s "do less, do well" investment philosophy. The entity maintains extreme portfolio concentration, multi-year holding periods, and exceptionally low turnover, focusing capital almost exclusively on moat-protected economic compounders such as Apple Inc., Berkshire Hathaway Inc., Alphabet Inc., Kweichow Moutai, and Tencent Holdings Ltd.
Duan maintains an active qualitative presence on the Chinese investor platform Xueqiu (Snowball) under the handles "@大道至简" and "大道无形我有型." His concise commentary on business economic moats and corporate management is widely studied by institutional and retail value investors alike. His intellectual alignment with Warren Buffett's investment framework was highlighted in 2007 when he submitted a record winning bid of $620,100 for the 2006 "Power Lunch with Warren Buffett" charity auction benefiting the Glide Foundation. Notably, Duan brought a young Colin Huang—the future founder of Pinduoduo (PDD Holdings)—to the lunch as his guest.
2. The Portfolio at Quarter End: Size, Concentration, and Core Holdings#
As reported in Form 13F-HR filed with the SEC on November 16, 2026, for the quarter ending September 30, 2026, H&H International Investment LLC managed $17.19 billion in reported US long equity assets distributed across 16 positions. This represents a contraction from the $19.10 billion asset base across 18 holdings reported at the close of Q2 2026.
The portfolio demonstrates structural concentration: the 10 largest reported equity positions account for 99.0% of total disclosed US equity assets. Apple Inc. remains the firm's foundational holding, accounting for 41.1% ($7.06 billion) of reported assets, followed by Berkshire Hathaway Inc. Class B shares at 24.2% ($4.16 billion).
H&H International Investment LLC Portfolio Summary (as of September 30, 2026)#
| Ticker | Company Name | Value ($) | Portfolio Share (%) | Quarterly Share Count Change (%) |
|---|---|---|---|---|
| AAPL | Apple Inc. | $7,060,000,000 | 41.1% | -22% |
| BRK.B | Berkshire Hathaway Inc. | $4,160,000,000 | 24.2% | -9% |
| PDD | PDD Holdings Inc. | $2,180,000,000 | 12.7% | +12% |
| TSLA | Tesla, Inc. | $1,450,000,000 | 8.4% | +21% |
| OXY | Occidental Petroleum Corp. | $567,700,000 | 3.3% | 0% |
| NVDA | NVIDIA Corp. | $529,700,000 | 3.1% | -63% |
| GOOG | Alphabet Inc. | $392,400,000 | 2.3% | -41% |
| MSFT | Microsoft Corporation | $356,000,000 | 2.1% | -8% |
| DIS | The Walt Disney Co. | $179,000,000 | 1.0% | 0% |
| UNH | UnitedHealth Group Inc. | $146,700,000 | 0.9% | 0% |
| CRDO | Credo Technology Group Holding Ltd | $117,100,000 | 0.7% | -14% |
| SPCX | Space Exploration Technologies Corp. (SpaceX) | $30,200,000 | 0.2% | New |
| PLTR | Palantir Technologies Inc. | $11,200,000 | 0.1% | 0% |
| SNPS | Synopsys Inc. | $4,300,000 | 0.0% | 0% |
| SNOW | Snowflake Inc. | $3,400,000 | 0.0% | 0% |
3. What Changed: New, Added, Trimmed, and Sold-Out Positions#
Trading activity during Q3 2026 was characterized by systematic net capital extraction. H&H International Investment LLC established 1 new position, added to 2 existing positions, trimmed 6 holdings, and fully liquidated 3 positions. Estimated gross purchases totaled $509.8 million against estimated gross sales of $3.67 billion, resulting in a net cash inflow of $3.16 billion to the fund. Portfolio turnover was low at approximately 2.8%.
Trade Breakdown by Category#
1. Trimming Core Holdings#
- Apple Inc. (AAPL): Reduced share count by 22% (an estimated cash realization of ~$1.96 billion). The remaining holding is valued at $7.06 billion, comprising 41.1% of US long equity assets.
- Inference: Trimming Apple represents valuation-based profit-taking, as the stock's market valuation expanded past conservative intrinsic value metrics.
- NVIDIA Corp. (NVDA): Cut position by 63% (an estimated sale of ~$904.7 million). The remaining position is valued at $529.7 million, or 3.1% of the portfolio.
- Inference: The sharp reduction in NVIDIA reflects a deliberate harvesting of capital following massive price appreciation that pushed the stock above its base-case DCF valuation.
- Berkshire Hathaway Inc. (BRK.B): Reduced share count by 9% (an estimated sale of ~$434.7 million). Remaining allocation stands at $4.16 billion (24.2% of the portfolio).
- Inference: Trimming Berkshire Hathaway served as a routine source of general liquidity while retaining the holding as the fund's secondary anchor asset.
- Alphabet Inc. (GOOG): Trimmed position by 41% (an estimated sale of ~$278.4 million). The remaining stake is valued at $392.4 million (2.3% of reported assets).
- Inference: Reducing Alphabet freed up capital from a secondary technology holding that was trading near fair value.
- Microsoft Corporation (MSFT): Trimmed share count by 8% (an estimated sale of ~$30.8 million). The position stands at $356.0 million (2.1% of the portfolio).
- Inference: The minor trim in Microsoft represents incremental portfolio rebalancing within enterprise software.
- Credo Technology Group Holding Ltd (CRDO): Trimmed share count by 14% (an estimated sale of ~$19.5 million). Remaining value is $117.1 million (0.7% of reported assets).
- Inference: Trimming Credo reflects minor profit-taking in a smaller technology infrastructure holding.
2. Capital Additions#
- Tesla, Inc. (TSLA): Expanded share count by 21% (an estimated purchase of ~$248.2 million). The stake is valued at $1.45 billion, accounting for 8.4% of reported assets.
- Inference: Adding to Tesla indicates growing conviction in the company’s long-term competitive positioning relative to market pricing during the quarter.
- PDD Holdings Inc. (PDD): Increased position by 12% (an estimated purchase of ~$231.4 million). PDD is now the third-largest holding at $2.18 billion (12.7% of the portfolio).
- Inference: The $231.4 million expansion of PDD occurred concurrently with the complete liquidation of Alibaba ($28.9 million). This shift represents a strategic consolidation of Chinese e-commerce exposure into a single high-conviction compounder operating directly within Duan’s core domain of expertise.
3. New Position#
- Space Exploration Technologies Corp. / SpaceX (SPCX): Initiated a new position valued at $30.2 million (0.2% of reported assets).
- Inference: Opening a initial position in SpaceX represents a selective entry into commercial space transport infrastructure.
4. Complete Liquidations#
- Alibaba Group Holding Limited (BABA): Liquidated 100% of the holding (valued at ~$28.9 million in Q2).
- Inference: Exiting Alibaba reflects a total capital reallocation toward PDD Holdings as the preferred vehicle for Chinese consumer market exposure.
- Circle Internet Financial / Circle Internet Group, Inc. (CRCL): Liquidated 100% of the holding (valued at ~$12.5 million in Q2).
- Inference: Selling out of Circle eliminates a non-core financial technology stake.
- Innodata Inc. (INOD): Liquidated 100% of the holding (valued at ~$755,800 in Q2).
- Inference: Liquidating Innodata closes out a non-material micro-cap technology holding.
4. The Biggest Moves, Valued: Owner Earnings, DCFs, and Margins of Safety#
To analyze the strategic logic driving Duan Yongping's portfolio adjustments, DeepValues evaluates underlying business cash flows using ten years of SEC XBRL filings (Forms 10-K and 10-Q).
Under the DeepValues framework, Owner Earnings are defined as: $$\text{Owner Earnings} = \text{Operating Cash Flow} - \text{Maintenance Capex} - \text{Stock Compensation}$$
A critical analytical nuance lies in the structural definition of Maintenance Capex, calculated as: $$\text{Maintenance Capex} = \min(\text{Capital Expenditures}, \text{Depreciation & Amortization})$$
Capital spent above Depreciation & Amortization (D&A) represents growth investment. Subtracting all capex provides a stricter liquidity view. When capital expenditures exceed D&A by extraordinary margins—such as in corporate buildouts of AI infrastructure—evaluating both metrics reveals whether growth spending is building true economic value or functioning as mandatory defensive capital expense.
All DCF models employ a standard 10.0% discount rate, project growth over Years 1–5 ($g$), fade growth toward 2.5% across Years 6–10, and apply a 2.5% perpetual terminal rate.
4.1 Apple Inc. (AAPL): Trimming Above Intrinsic Value#
Financial & Cash Flow Context (TTM Ended September 26, 2026)#
- Revenue: $478.8 billion
- Net Income: $132.2 billion
- Operating Cash Flow: $145.1 billion
- Capital Expenditures: $9.0 billion
- Depreciation & Amortization: $13.4 billion
- Stock Compensation: $13.8 billion
- TTM Owner Earnings (Maintenance Capex): $122.3 billion (Owner Earnings after all capex also equals $122.3B, as capex of $9.0B was below D&A of $13.4B)
DCF Valuation Models (10.0% Discount Rate)#
Balance Sheet Net Cash: $136.9B cash and marketable securities - $78.1B total debt = $58.8 billion. Shares Outstanding: 14.532 billion.
- Conservative Case ($g = 4.6%$): Intrinsic Value = $133.38 per share (Market price 163.7% above value)
- Base Case ($g = 9.3%$): Intrinsic Value = $170.71 per share (Market price 106.0% above value; Margin of Safety: -106.0%)
- Optimistic Case ($g = 13.3%$): Intrinsic Value = $210.98 per share (Market price 66.7% above value)
Reverse DCF & Forensic Analysis#
At the prevailing market price of $351.68, the stock implied a five-year owner earnings growth rate of 23.1% per annum. This implied growth rate is 2.5 times Apple’s actual 10-year historical owner-earnings CAGR of 9.3%.
Duan Yongping trimmed 22% of H&H's Apple holdings (~$1.96 billion sold) while the share price traded at a 106.0% premium to its Base Case intrinsic value ($351.68 vs. $170.71). This move captures valuation-driven profit harvesting in a mature asset whose price outpaced underlying fundamental cash flows. Verification Status: Double Verified (0.0% variance across independent SEC XBRL databases).
4.2 NVIDIA Corp. (NVDA): Rebalancing Near Fair Value#
Financial & Cash Flow Context (TTM Ended July 26, 2026)#
- Revenue: $303.0 billion
- Net Income: $192.9 billion
- Operating Cash Flow: $134.4 billion
- Capital Expenditures: $7.4 billion
- Depreciation & Amortization: $3.7 billion
- Stock Compensation: $7.2 billion
- TTM Owner Earnings (Maintenance Capex): $123.4 billion (Deducting all capex yields $119.8B, as $3.7B in capex exceeded D&A)
DCF Valuation Models (10.0% Discount Rate)#
Balance Sheet Net Cash: $71.6B cash and marketable securities - $33.4B total debt = $38.2 billion. Shares Outstanding: 24.147 billion.
- Conservative Case ($g = 7.5%$, half growth capex as upkeep): Intrinsic Value = $92.22 per share (Market price 68.6% above value)
- Base Case ($g = 15.0%$): Intrinsic Value = $139.61 per share (Market price 11.3% above value; Margin of Safety: -11.3%)
- Optimistic Case ($g = 19.0%$): Intrinsic Value = $172.22 per share (Margin of Safety: +9.7%)
Reverse DCF & Forensic Analysis#
At a market price of $155.45, NVIDIA implied five-year owner earnings growth of 17.0% per annum, closely matching its 10-year historical growth rate of 15.0%.
Duan trimmed 63% of the NVIDIA stake (~$904.7 million sold) as the market price ($155.45) slightly surpassed Base Case intrinsic value ($139.61). The trim allowed the fund to lock in realized gains on a holding that had reached full valuation relative to historical growth benchmarks. Verification Status: Double Verified (0.0% variance across independent runs).
4.3 Alphabet Inc. (GOOG): Trimming at Fair Value (Single-Source Estimate)#
Financial & Cash Flow Context (TTM Ended September 30, 2026)#
- Revenue: $471.1 billion
- Net Income: $235.7 billion
- Operating Cash Flow: $179.6 billion
- Capital Expenditures: $159.8 billion
- Depreciation & Amortization: $28.0 billion
- Stock Compensation: $30.4 billion
- TTM Owner Earnings (Maintenance Capex): $121.1 billion
Strategic Divergence: Growth Capex & AI Infrastructure#
A substantial divergence appears between maintenance-based Owner Earnings ($121.1 billion) and net cash flow after deducting all capital expenditures (-$10.7 billion). Alphabet’s trailing annual capex reached $159.8 billion against $28.0 billion in depreciation, creating $131.8 billion in growth capex above maintenance levels.
This $131.8 billion spending surge reflects an aggressive defensive investment cycle in server capacity, custom silicon, and data center infrastructure required to protect its core Search monopoly against AI competitors. If these massive capital outlays yield lower returns on invested capital than historic benchmarks, cash flow after all capex (-$10.7B) becomes a critical risk indicator.
DCF Valuation Models (10.0% Discount Rate)#
Balance Sheet Net Cash: $265.1B cash and marketable securities - $126.1B total debt = $139.0 billion. Shares Outstanding: 12.294 billion.
- Conservative Case ($g = 7.5%$, half growth capex as upkeep, starting OE $60.6B): Intrinsic Value = $99.98 per share
- Base Case ($g = 15.0%$): Intrinsic Value = $277.40 per share (Market price 1.5% above value; Margin of Safety: -1.5%)
- Optimistic Case ($g = 19.0%$): Intrinsic Value = $340.25 per share (Margin of Safety: +17.2%)
Reverse DCF & Valuation Implication#
At a market price of $281.63, the stock implied owner earnings growth of 15.3% per annum, virtually identical to the 10-year historical base growth rate of 15.0%.
Duan trimmed 41% of H&H's Alphabet holdings (~$278.4 million sold) as the share price traded directly at fair value ($281.63 vs. $277.40), reducing exposure while capital spending requirements escalated. Verification Status: Single-Source Estimate (Run B historical periods incomplete).
5. Track Record: The 13F Clone Strategy vs. S&P 500#
To measure the institutional effectiveness of Duan Yongping's disclosed US long equity allocations, DeepValues backtested a public "13F clone portfolio." The model purchases common stock positions disclosed in H&H International Investment LLC’s quarterly Form 13F filings, weighted by reported dollar value, at the market close on the first trading day following the SEC filing deadline. Holdings are rebalanced upon subsequent filing releases and evaluated on a total-return basis against the SPDR S&P 500 ETF Trust (SPY).
Evaluation Window: April 3, 2019, to November 16, 2026 (7.6 years across 31 consecutive filing cycles).
Annual Performance Comparison (13F Clone vs. SPY)#
| Year / Period | 13F Clone Return (%) | SPY Total Return (%) | Outperformance (pts) |
|---|---|---|---|
| 2019* | +33.8% | +14.0% | +19.8 |
| 2020 | +65.8% | +18.3% | +47.5 |
| 2021 | +33.8% | +28.7% | +5.1 |
| 2022 | -21.2% | -18.2% | -3.0 |
| 2023 | +40.7% | +26.2% | +14.5 |
| 2024 | +29.0% | +24.9% | +4.1 |
| 2025 | +9.2% | +17.7% | -8.5 |
| 2026* | +14.6% | +9.2% | +5.4 |
* Partial year performance within backtest window.
Structural Performance Statistics#
- 13F Clone CAGR: 24.5% (Cumulative Total Return: +431.2%; Maximum Month-End Drawdown: -23.3%)
- SPY Benchmark CAGR: 14.9% (Cumulative Total Return: +187.7%; Maximum Month-End Drawdown: -23.9%)
- Annualized Alpha: +9.6 percentage points per year
- Portfolio Characteristics: Average of 11 positions per filing; top 10 holdings average 99.9% of portfolio value; average quarterly turnover of 6.9%.
Crucial Track Record Limitations#
A 13F clone model does not equal the overall fund performance of H&H International Investment LLC. SEC Form 13F disclosures strictly track US-listed long equity holdings and exclude: 1. Short positions, cash balances, fixed income, and option overlay strategies. 2. Non-US exchange listings, such as Duan’s core personal allocations in Kweichow Moutai (Shanghai) and Tencent Holdings (Hong Kong). 3. Intra-quarter execution and portfolio adjustments. 4. Real-time trading prices, as disclosures carry up to a 45-day reporting lag.
6. What a Patient Investor Can Learn#
The strategic mechanics of H&H International Investment LLC’s Q3 2026 filing offer several practical principles for long-term investors:
- Extreme Concentration in High-Conviction Compounders: Duan Yongping’s long-term performance demonstrates that broad diversification is unnecessary to achieve multi-decade outperformance. By concentrating over 65% of reported assets in just two holdings (Apple and Berkshire Hathaway), H&H maximizes capital exposure to businesses with durable moats.
- Disciplined Profit Harvesting Above Intrinsic Value: Great businesses can trade at non-compelling prices. Reducing Apple by 22% while it traded at a 106% premium to base intrinsic value—and where market-implied growth (23.1%) was 2.5 times historic norms (9.3%)—demonstrates a commitment to selling when market valuations detach from fundamentals.
- Patience and Low Turnover: Operating with quarterly portfolio turnover of ~2.8% (and a multi-year average of 6.9%), H&H avoids friction costs and allows core business operations to compound value naturally over multi-year horizons.
- Strict Adherence to a Circle of Competence: The fund’s capital remains anchored in hardware engineering, consumer platforms, enterprise tech, and capital allocation platforms—domains directly aligned with Duan’s background as a electronics industrialist and long-term tech investor.
7. Key Numbers#
- Reported 13F Portfolio Value: $17.19 Billion across 16 positions (Top 10 holdings = 99.0% of portfolio).
- Net Quarterly Capital Flow: -$3.16 Billion (Gross Buys ~$509.8M; Gross Sells ~$3.67B; Turnover ~2.8%).
- Largest Equity Holding: Apple Inc. (AAPL) at $7.06 Billion (41.1% of portfolio; trimmed 22%).
- AAPL Base Intrinsic Value vs. Market Price: $170.71 vs. $351.68 (Margin of Safety: -106.0%).
- NVDA Base Intrinsic Value vs. Market Price: $139.61 vs. $155.45 (Margin of Safety: -11.3%).
- GOOG Base Intrinsic Value vs. Market Price: $277.40 vs. $281.63 (Margin of Safety: -1.5%).
- 13F Clone CAGR (2019–2026): 24.5% vs. SPY CAGR 14.9% (Annualized Alpha: +9.6 pts/year).
8. Closing Note & Regulatory Disclaimer#
Regulatory Note on Form 13F Limitations#
Form 13F reports reflect institutional US long equity positions as of the final day of the calendar quarter, submitted up to 45 days after quarter end. They omit cash allocations, short positions, options contracts, fixed-income instruments, non-US listed equities, and any investment decisions executed after September 30, 2026.
Mandatory Disclaimer#
This article is provided for education and research purposes only and does not constitute investment advice.

Watch
Source links
Watch & listen
- Duan Yongping Sold $1.96B of Apple: $352 Price, $171 Value YouTube · EN
- Duan Yongping Sold $1.96B of Apple: $352 Price, $171 Value | Investor Playbook Podcast · EN
- 段永平砍輝達63%、蘋果22%,為何好公司也要賣? YouTube · 中文
- 段永平砍輝達63%、蘋果22%,為何好公司也要賣?|投資大師心法 Podcast · 中文