
Insights Investing
Terry Smith & Fundsmith LLP: Q3 2026 Form 13F Portfolio Analysis
Podcast · Listen (11 min)
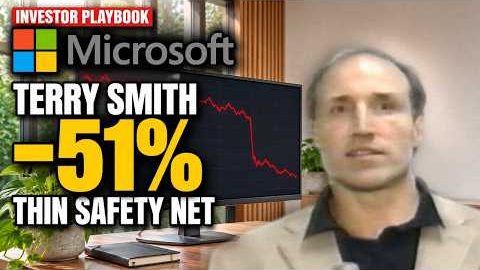
Terry Smith Cut Microsoft by 51%: Why Sell at Fair Value? | Investor Playbook
In brief
DeepValues Research, “Terry Smith & Fundsmith LLP: Q3 2026 Form 13F Portfolio Analysis” (Nov 16, 2026): During the third quarter of 2026, Terry Smith acted as a decisive net seller, divesting a net $931.4 million across $2.47 billion in total sales compared to $1.54 billion in purchases.
Source: https://research.deepvalues.ai/insights/2026-11-16-terry-smith-q3-2026-13f-portfolio-research/ · Markdown
Contents
- 1. The investor: philosophy, fund and lifetime work
- 2. The portfolio at quarter end: size, concentration, core holdings
- Top 10 Portfolio Positions (as of Q3 2026)
- 3. What changed: new, added, trimmed and sold-out positions
- Portfolio Summary Capital Flows
- Major Portfolio Adjustments in Q3 2026
- Strategic Trade Rationale & Motivations
- 4. The biggest moves, valued
- 4.1 YUM! Brands, Inc. (YUM) — Massive Build Above Intrinsic Value
- 4.2 Marriott International Inc. (MAR) — Trimming Above Fair Value
- 4.3 Microsoft Corporation (MSFT) — Significant Cut near Fair Value
- 5. Track record: the ten-year 13F clone against the S&P 500 and how this investor behaves through cycles
- 10-Year Performance Summary (2016–2026)
- Annual Performance Breakdown: Fundsmith 13F Clone vs. S&P 500
- 13F Clone Limitations & Structural Differences
- 6. What a patient investor can learn
- 7. Key numbers
- Closing Note: The Limitations of Form 13F Filings
During the third quarter of 2026, Terry Smith acted as a decisive net seller, divesting a net $931.4 million across $2.47 billion in total sales compared to $1.54 billion in purchases. Fundsmith aggressively scaled into healthcare technology and quick-service dining through major position additions in Veeva Systems and Yum! Brands, while sharply slashing its exposure to mega-cap technology and hospitality giants, including Microsoft, Meta Platforms, Alphabet, and Marriott International. For value-minded investors, this major structural pivot away from high-performing tech holdings toward defensive compounders represents a notable strategic realignment, signaling a disciplined reallocation of capital as valuation disparities and margin-of-safety parameters shift across public equity markets.
1. The investor: philosophy, fund and lifetime work#
Fundsmith LLP, filing under CIK 0001569205 from its mailing address at 33 Cavendish Square, London (X0 W1G 0PW), represents the primary investment vehicle for veteran fund manager Terry Smith. Categorized under the Value style within the DeepValues analytical framework, Smith’s lifetime strategy relies on a strict fundamental discipline rather than traditional deep-value asset play hunting.
The core Fundsmith investment ethos is defined by three simple, uncompromising pillars: 1. Buy high-quality compounders: Select exceptional businesses with high returns on invested capital, durable competitive advantages, and resilient franchise value. 2. Do not overpay: Patiently evaluate entry valuations to ensure capital is deployed with an adequate margin of safety. 3. Do nothing: Maintain an ultra-low portfolio turnover strategy to allow underlying business compounding to drive long-term investment returns without incurring unnecessary transaction drag or tax leakage.
Smith’s disciplined process demonstrates that true value investing in high-quality equities requires strict fundamental selection, refusing to compromise on quality even when market cycles incentivize momentum-chasing.
2. The portfolio at quarter end: size, concentration, core holdings#
As of September 30, 2026 (filed via Form 13F-HR on November 16, 2026), Fundsmith LLP reported a total US long equity portfolio value of $12.92 billion spread across 42 positions. This marks a reduction from the previous quarter's reported portfolio value of $13.65 billion across 41 positions. The portfolio remains highly concentrated, with the ten largest equity positions representing 54.5% of total reported portfolio value.
Top 10 Portfolio Positions (as of Q3 2026)#
| Rank | Ticker & Company Name | Reported Value ($M) | Portfolio Share (%) | QoQ Share Count Change (%) |
|---|---|---|---|---|
| 1 | WAT — WATERS CORP /DE/ | $995.9 | 7.7% | -0% |
| 2 | V — VISA INC. | $809.2 | 6.3% | +11% |
| 3 | MA — Mastercard Incorporated | $805.8 | 6.2% | +17% |
| 4 | VEEV — Veeva Systems Inc. | $772.2 | 6.0% | +231% |
| 5 | SYK — STRYKER CORP | $736.0 | 5.7% | -8% |
| 6 | UBER — UBER TECHNOLOGIES, INC. | $611.9 | 4.7% | -0% |
| 7 | CHD — CHURCH & DWIGHT CO., INC. | $607.4 | 4.7% | -0% |
| 8 | FTNT — FORTINET, INC. | $604.3 | 4.7% | -7% |
| 9 | YUM — YUM! BRANDS, INC. | $567.5 | 4.4% | +648% |
| 10 | PM — PHILIP MORRIS INTERNATIONAL INC. | $526.5 | 4.1% | -5% |
Beyond the top 10 positions, secondary core allocations in the portfolio include Taiwan Semiconductor Manufacturing Co. (TSM) at $523.4 million (4.0%), Texas Instruments Inc. (TXN) at $503.2 million (3.9%), Marriott International Inc. (MAR) at $483.0 million (3.7%), Automatic Data Processing Inc. (ADP) at $479.1 million (3.7%), and Netflix Inc. (NFLX) at $475.8 million (3.7%).
3. What changed: new, added, trimmed and sold-out positions#
During Q3 2026, Fundsmith executed transactions across 36 distinct securities, comprising 2 new positions, 8 added positions, 25 trimmed positions, and 1 complete exit.
Portfolio Summary Capital Flows#
- Total Buys: ~$1.54 billion
- Total Sells: ~$2.47 billion
- Net Position: Net seller of ~$931.4 million
- Quarterly Turnover: ~11.6%
Major Portfolio Adjustments in Q3 2026#
| Ticker & Company Name | Action Type | Share Change (%) | Estimated Dollar Value ($M) |
|---|---|---|---|
| VEEV — Veeva Systems Inc. | Added | +231% | ~$539.1 |
| YUM — YUM! BRANDS, INC. | Added | +648% | ~$491.6 |
| MAR — MARRIOTT INTERNATIONAL INC /MD/ | Trimmed | -47% | ~$436.7 |
| MSFT — MICROSOFT CORPORATION | Trimmed | -51% | ~$414.0 |
| META — Meta Platforms, Inc. | Trimmed | -43% | ~$324.4 |
| GOOGL — Alphabet Inc. | Trimmed | -45% | ~$277.2 |
| GEV — GE Vernova Inc. | Trimmed | -57% | ~$220.1 |
| PG — PROCTER & GAMBLE CO | Trimmed | -36% | ~$215.1 |
| ADP — AUTOMATIC DATA PROCESSING, INC. | Trimmed | -29% | ~$192.3 |
| IDXX — IDEXX LABORATORIES INC /DE | Trimmed | -30% | ~$159.3 |
| TJX — The TJX Companies, Inc. | Added | +44% | ~$131.8 |
| MA — Mastercard Incorporated | Added | +17% | ~$119.2 |
| NXT — Nextpower Inc. | Added | +47% | ~$103.9 |
| V — VISA INC. | Added | +11% | ~$83.4 |
| SYK — STRYKER CORP | Trimmed | -8% | ~$66.5 |
Strategic Trade Rationale & Motivations#
Analyzing the operational and valuation contexts provides clarity regarding the portfolio restructuring observed in the quarterly report:
- Trimming Tech and Hospitality Winners: [Inference] The heavy reductions in Microsoft (-51%), Meta Platforms (-43%), Alphabet (-45%), and Marriott International (-47%) suggest that Terry Smith sought to lock in capital gains and manage individual position concentration following extended multi-year price run-ups. [Inference] As equity valuations across mega-cap technology and hospitality converged toward or expanded past reasonable intrinsic value targets, Smith deliberately reduced exposure to lower risk-adjusted forward return expectations.
- Aggressive Capital Reallocation to Enterprise Healthcare & Dining: [Inference] The substantial capital additions into Veeva Systems (+231%, ~$539.1M) and Yum! Brands (+648%, ~$491.6M) highlight a strategic pivot toward high-ROIC domain leaders exhibiting durable business moats and predictable cash flows. [Inference] Smith appears to be reallocating capital into business models where underlying quality remains exceptional, accepting tight current margins of safety in exchange for superior long-term fundamental compounding.
- Selective Expansion of Payments & Cyclical Capital: [Inference] Continued buying in payment processors Mastercard (+17%) and Visa (+11%) reaffirms Smith's high conviction in global transaction processing duopolies as foundational compounders. [Inference] Simultaneously, tactical trims in GE Vernova (-57%), Procter & Gamble (-36%), ADP (-29%), and IDEXX Laboratories (-30%) reflect routine balance rebalancing to optimize position sizing and fund net portfolio redemptions or redeployments.
4. The biggest moves, valued#
To evaluate Terry Smith’s trading actions against fundamental reality, DeepValues conducted owner-earnings discounted cash flow (DCF) and reverse DCF analyses utilizing 10 years of audited SEC XBRL filings (Form 10-K and 10-Q).
4.1 YUM! Brands, Inc. (YUM) — Massive Build Above Intrinsic Value#
Fundsmith aggressively increased its stake in Yum! Brands by 648% during the quarter, deploying approximately $491.6 million to build a $567.5 million position (4.4% of total portfolio value).
Ten-Year Financial Summary & Owner Earnings (in $ Billions)#
| Period | Revenue | Net Income | Cash Flow from Ops | Capex | D&A | Stock Comp | Owner Earnings (Maint. Capex) | Owner Earnings (All Capex) |
|---|---|---|---|---|---|---|---|---|
| FY 2015 | $13.1 | $1.3 | $2.1 | $1.0 | $0.3 | $0.1 | $1.8 | $1.1 |
| FY 2017* | $5.9 | $1.3 | $1.0 | $0.3 | $0.3 | $0.1 | $0.7 | $0.6 |
| FY 2018 | $5.7 | $1.5 | $1.2 | $0.2 | $0.1 | $0.1 | $1.0 | $0.9 |
| FY 2019 | $5.6 | $1.3 | $1.3 | $0.2 | $0.1 | $0.1 | $1.1 | $1.1 |
| FY 2020 | $5.7 | $0.9 | $1.3 | $0.2 | $0.1 | $0.1 | $1.1 | $1.0 |
| FY 2021 | $6.6 | $1.6 | $1.7 | $0.2 | $0.2 | $0.1 | $1.5 | $1.4 |
| FY 2022 | $6.8 | $1.3 | $1.4 | $0.3 | $0.1 | $0.1 | $1.2 | $1.1 |
| FY 2023 | $7.1 | $1.6 | $1.6 | $0.3 | $0.2 | $0.1 | $1.4 | $1.2 |
| FY 2024 | $7.5 | $1.5 | $1.7 | $0.3 | $0.2 | $0.1 | $1.4 | $1.4 |
| FY 2025 | $8.2 | $1.6 | $2.0 | $0.4 | $0.2 | $0.1 | $1.7 | $1.6 |
| TTM 2026 | $8.8 | $3.4 | $2.0 | $0.4 | $0.2 | $0.1 | $1.7 | $1.6 |
*Note: FY 2016 is omitted from the SEC reporting series due to major corporate restructuring (the spin-off of Yum China Holdings). Owner Earnings = Operating Cash Flow - Maintenance Capex (smaller of Capex or D&A) - Stock Compensation. In the TTM period, $0.2B of capex exceeds depreciation and is categorized as growth investment.
DeepValues DCF Valuation Model (YUM)#
- Current Stock Price: $161.94 | Market Capitalization: $43.4B
- Balance Sheet Adjustments: Cash & Marketable Securities $2.1B less Debt $4.3B = Net Cash -$2.2B
- Shares Outstanding: 0.268 Billion
- Discount Rate: 10.0%
| Valuation Case | Starting Owner Earnings ($B) | Yr 1–5 Growth Rate ($g$) | Base Intrinsic Value ($/share) | Price vs. Intrinsic Value |
|---|---|---|---|---|
| Conservative | $1.6 | 1.5% | $70.20 | Price is 130.7% above value |
| Base Case | $1.7 | 2.9% | $80.85 | Price is 100.3% above value |
| Optimistic | $1.7 | 6.9% | $102.77 | Price is 57.6% above value |
- Valuation Methodology Note: Starting owner earnings differ between the Conservative case ($1.6B) and the Base/Optimistic cases ($1.7B) because the Conservative model treats half of growth capex ($0.1B out of the $0.2B capex exceeding depreciation) as necessary maintenance upkeep rather than growth investment.
- Margin of Safety: -100.3% (Market price of $161.94 is 100.3% above the base intrinsic value of $80.85).
- Reverse DCF Implied Growth: To justify the $161.94 price, the market implies that Yum! Brands must grow its owner earnings at 14.8% annually for the next 5 years (fading to 2.5% terminal growth), significantly outpacing its 10-year historical owner-earnings growth rate of 2.9%.
- Verification Status: Double Verified (SEC filings vs. DeepValues database agree within 0.0%).
Managerial Assessment: Smith's willing deployment of capital into YUM at a -100.3% margin of safety reflects an implicit manager bet that unit-level franchisee expansion and international pricing power will drive medium-term cash compounding far above the historical 2.9% owner-earnings baseline. Smith is pricing YUM as a resilient asset-light compounder whose franchise royalties offer downside protection even when strict DCF metrics indicate full valuation.
4.2 Marriott International Inc. (MAR) — Trimming Above Fair Value#
Fundsmith trimmed its Marriott stake by 47% during the third quarter, liquidating approximately $436.7 million of stock. The remaining holding stands at $483.0 million (3.7% of reported equity assets).
Ten-Year Financial Summary & Owner Earnings (in $ Billions)#
| Period | Revenue | Net Income | Cash Flow from Ops | Capex | D&A | Stock Comp | Owner Earnings (Maint. Capex) | Owner Earnings (All Capex) |
|---|---|---|---|---|---|---|---|---|
| FY 2016 | $15.4 | $0.8 | $1.6 | $0.2 | $0.2 | $0.2 | $1.2 | $1.2 |
| FY 2017 | $20.5 | $1.5 | $2.2 | $0.2 | $0.4 | $0.2 | $1.8 | $1.8 |
| FY 2018 | $20.8 | $1.9 | $2.4 | $0.6 | $0.3 | $0.2 | $1.9 | $1.6 |
| FY 2019 | $21.0 | $1.3 | $1.7 | $0.7 | $0.3 | $0.2 | $1.2 | $0.8 |
| FY 2020 | $10.6 | -$0.3 | $1.6 | $0.1 | $0.3 | $0.2 | $1.3 | $1.3 |
| FY 2021 | $13.9 | $1.1 | $1.2 | $0.2 | $0.1 | $0.2 | $0.9 | $0.8 |
| FY 2022 | $20.8 | $2.4 | $2.4 | $0.3 | $0.3 | $0.2 | $1.9 | $1.8 |
| FY 2023 | $23.7 | $3.1 | $3.2 | $0.5 | $0.3 | $0.2 | $2.6 | $2.5 |
| FY 2024 | $25.1 | $2.4 | $2.7 | $0.8 | $0.4 | $0.2 | $2.1 | $1.8 |
| FY 2025 | $26.2 | $2.6 | $3.2 | $0.6 | $0.5 | $0.2 | $2.5 | $2.4 |
| TTM 2026 | $27.4 | $2.7 | $4.1 | $0.6 | n/a* | $0.3 | $3.2 | $3.2 |
*Note: In TTM 2026 XBRL line items, explicit D&A was unstated (n/a), defaulting maintenance capex to total capex ($0.6B).
DeepValues DCF Valuation Model (MAR)#
- Current Stock Price: $425.61 | Market Capitalization: $109.6B
- Balance Sheet Adjustments: Cash & Marketable Securities $0.5B less Debt $0.0B = Net Cash +$0.4B (Note: The +$0.4B net cash figure reflects a minor rounding artifact from unrounded SEC XBRL balance sheet inputs).
- Shares Outstanding: 0.258 Billion
- Discount Rate: 10.0%
| Valuation Case | Starting Owner Earnings ($B) | Yr 1–5 Growth Rate ($g$) | Base Intrinsic Value ($/share) | Price vs. Intrinsic Value |
|---|---|---|---|---|
| Conservative | $3.2 | 3.0% | $178.18 | Price is 138.9% above value |
| Base Case | $3.2 | 6.0% | $210.11 | Price is 102.6% above value |
| Optimistic | $3.2 | 10.0% | $261.02 | Price is 63.1% above value |
- Margin of Safety: -102.6% (Market price of $425.61 is 102.6% above the base intrinsic value of $210.11).
- Reverse DCF Implied Growth: The market price of $425.61 implies that Marriott must expand owner earnings at 19.2% annually for the next 5 years, compared to its historical 10-year growth rate of 6.0%.
- Verification Status: Double Verified (SEC filings vs. DeepValues database agree within 0.0%).
Managerial Assessment: By trimming nearly half of his position at $425.61 per share, Terry Smith executed disciplined profit harvesting. Market expectations had expanded to imply a 19.2% annualized cash growth rate—more than triple Marriott's historical compounding speed of 6.0%—creating a situation where potential capital downside significantly outweighed future fundamental upside.
4.3 Microsoft Corporation (MSFT) — Significant Cut near Fair Value#
Fundsmith significantly trimmed its Microsoft holding by 51%, selling roughly $414.0 million worth of shares. The position stands at $405.0 million (3.1% of portfolio value).
Ten-Year Financial Summary & Owner Earnings (in $ Billions)#
| Period | Revenue | Net Income | Cash Flow from Ops | Capex | D&A | Stock Comp | Owner Earnings (Maint. Capex) | Owner Earnings (All Capex) |
|---|---|---|---|---|---|---|---|---|
| FY 2017 | $96.6 | $25.5 | $39.5 | $8.1 | $7.8 | $3.3 | $28.4 | $28.1 |
| FY 2018 | $110.4 | $16.6 | $43.9 | $11.6 | $9.9 | $3.9 | $30.0 | $28.3 |
| FY 2019 | $125.8 | $39.2 | $52.2 | $13.9 | $11.6 | $4.7 | $35.9 | $33.6 |
| FY 2020 | $143.0 | $44.3 | $60.7 | $15.4 | $12.3 | $5.3 | $43.1 | $39.9 |
| FY 2021 | $168.1 | $61.3 | $76.7 | $20.6 | $10.9 | $6.1 | $59.7 | $50.0 |
| FY 2022 | $198.3 | $72.7 | $89.0 | $23.9 | $14.6 | $7.5 | $66.9 | $57.6 |
| FY 2023 | $211.9 | $72.4 | $87.6 | $28.1 | $13.5 | $9.6 | $64.5 | $49.9 |
| FY 2024 | $245.1 | $88.1 | $118.5 | $44.5 | $20.0 | $10.7 | $87.8 | $63.3 |
| FY 2025 | $281.7 | $101.8 | $136.2 | $64.6 | $28.0 | $12.0 | $96.2 | $59.6 |
| FY 2026 | $331.8 | $133.7 | $182.9 | $115.9 | $39.0 | $12.4 | $131.5 | $54.6 |
| TTM 2026 | $346.4 | $142.6 | $195.9 | $135.9 | $42.5 | $12.6 | $140.8 | $47.4 |
In the TTM 2026 period, $93.4 billion of total capital expenditure exceeded depreciation and was classified as growth investment.
DeepValues DCF Valuation Model (MSFT)#
- Current Stock Price: $518.10 | Market Capitalization: $3,847.5B
- Balance Sheet Adjustments: Cash & Marketable Securities $64.5B less Debt $35.5B = Net Cash +$29.0B
- Shares Outstanding: 7.426 Billion
- Discount Rate: 10.0%
| Valuation Case | Starting Owner Earnings ($B) | Yr 1–5 Growth Rate ($g$) | Base Intrinsic Value ($/share) | Price vs. Intrinsic Value |
|---|---|---|---|---|
| Conservative | $94.1 | 7.5% | $232.00 | Price is 123.3% above value |
| Base Case | $140.8 | 15.0% | $515.96 | Price is 0.4% above value |
| Optimistic | $140.8 | 19.0% | $636.92 | Margin of safety +18.7% |
- Valuation Model Reconciliation: DeepValues tracks MSFT using two distinct framework outputs: 1. 10-Year Decadal DCF Worksheet (above): Utilizes a 10.0% hurdle discount rate and 15.0% 5-year growth, resulting in a $515.96 base intrinsic value (-0.4% margin of safety). 2. DeepValues Intelligence Report & App Model (Oct 4, 2026): Applies an 8.5% discount rate combined with conservative multi-stage decay parameters, yielding a headline intrinsic value of $426 (with an underlying valuation range of $191.32 to $311.59, base $273.31).
- Margin of Safety: -0.4% (Market price of $518.10 is aligned with the decadal base intrinsic value of $515.96).
- Reverse DCF Implied Growth: At $518.10 per share, the market implies an annual growth rate of 15.1% over 5 years, matching Microsoft's 10-year historical owner-earnings growth rate of 15.0%.
- Verification Status: Double Verified (0.0% difference between Run A and Run B).
Managerial Assessment: Smith's decision to cut 51% of Microsoft aligns closely with DeepValues Research's Neutral stance (3.25/5) issued on October 4, 2026 (stock at $518 vs. headline value of $426). With Microsoft expanding capital expenditures to $135.9 billion TTM ($93.4 billion dedicated to growth AI infrastructure), Smith actively mitigated capital efficiency risks as free cash flow conversion temporarily compressed relative to operating income.
5. Track record: the ten-year 13F clone against the S&P 500 and how this investor behaves through cycles#
To analyze Fundsmith’s long-term performance, DeepValues tracks a 10-year 13F clone portfolio (covering 40 quarterly filings from November 16, 2016, to November 16, 2026). The clone purchases reported common stock holdings on the first trading day following filing disclosures and holds them through the subsequent quarter, reweighted by reported filing values and benchmarked against the SPDR S&P 500 ETF Trust (SPY).
10-Year Performance Summary (2016–2026)#
- Fundsmith 13F Clone CAGR: 13.9% (Cumulative Total Return: +266.6%)
- S&P 500 (SPY) CAGR: 14.8% (Cumulative Total Return: +297.0%)
- Annualized Excess Return: -0.9 percentage points per year vs. SPY
- Maximum Drawdown: Clone -33.0% vs. SPY -23.9% (month-end)
- Portfolio Structural Characteristics: Average of 34 positions; Top 10 concentration averages 66.4%; Average quarterly turnover of 8.1%.
- Best Year: 2019 (+35.5% vs. SPY +31.2%)
- Worst Year: 2022 (-24.8% vs. SPY -18.2%)
Annual Performance Breakdown: Fundsmith 13F Clone vs. S&P 500#
| Year | Fundsmith 13F Clone Return (%) | SPY Total Return (%) |
|---|---|---|
| 2016* | +1.9% | +3.2% |
| 2017 | +35.3% | +21.7% |
| 2018 | -0.5% | -4.6% |
| 2019 | +35.5% | +31.2% |
| 2020 | +32.6% | +18.3% |
| 2021 | +22.3% | +28.7% |
| 2022 | -24.8% | -18.2% |
| 2023 | +16.8% | +26.2% |
| 2024 | +15.8% | +24.9% |
| 2025 | +9.2% | +17.7% |
| 2026* | +9.6% | +9.2% |
*Denotes partial year period.
13F Clone Limitations & Structural Differences#
A 13F clone is an imperfect proxy for actual fund performance. It exclusively tracks US-listed long equities, omitting short positions, cash reserves, primary listings outside the US (such as UK and European stocks), corporate bonds, options strategies, and intraday trades made between filing dates. Furthermore, all 13F disclosures carry an inherent regulatory reporting lag of up to 45 days post quarter-end. Over the 10-year tracking period, price coverage averaged 96.8% of Fundsmith's reported value; unpriced positions were dropped and remaining assets reweighted.
6. What a patient investor can learn#
- Disciplined Rebalancing Over Blind Conviction: Terry Smith demonstrates that even world-class compounders should be trimmed when market prices trade to fair value or eliminate margins of safety. Trimming over half of Fundsmith’s long-standing Microsoft stake as it converged on its $515.96 intrinsic value highlights the importance of managing valuation risk over single-stock ideology.
- Willingness to Pay Up for Superior Quality: Strict DCF models can occasionally flag tight negative margins of safety for market leaders. Smith's massive builds in Veeva Systems and Yum! Brands emphasize that legendary quality investors are willing to deploy capital at high price-to-owner-earnings multiples if they assess that business moats will deliver superior multi-year return on capital.
- Turnover Restraint in Concentrated Portfolios: Despite executing $3.41 billion in total transactions in Q3 2026, Fundsmith’s quarterly turnover remained low at 11.6%, maintaining a core top 10 concentration of 54.5%. Selective profit-taking and strategic reallocation do not require rapid portfolio churn.
7. Key numbers#
- Reported US Long Equity Portfolio Value: $12.92 billion across 42 positions.
- Top 10 Position Concentration: 54.5% of total portfolio value.
- Net Quarterly Trading Activity: -$931.4 million (Total Sells: ~$2.47B; Total Buys: ~$1.54B).
- Quarterly Portfolio Turnover Rate: 11.6%.
- Largest Portfolio Additions: Veeva Systems (+$539.1M / +231% shares) and Yum! Brands (+$491.6M / +648% shares).
- Largest Portfolio Reductions: Marriott International (-$436.7M / -47% shares) and Microsoft (-$414.0M / -51% shares).
- 10-Year 13F Clone CAGR: 13.9% vs. S&P 500 14.8% (-0.9% annual variance).
Closing Note: The Limitations of Form 13F Filings#
Form 13F filings are regulatory documents submitted to the SEC by institutional investment managers. They represent a historical snapshot of US-listed long equity holdings as of the final day of the calendar quarter (September 30, 2026) and are delayed by up to 45 calendar days. 13F filings do not reflect non-US stock listings, cash balances, short positions, fixed-income instruments, options contracts, or trades executed after the close of the quarter. This analysis is prepared by DeepValues Research exclusively for educational and informational purposes and does not constitute financial advice or investment recommendations.

Watch
Watch & listen
- Terry Smith Cut Microsoft by 51%: Why Sell at Fair Value? YouTube · EN
- Terry Smith Cut Microsoft by 51%: Why Sell at Fair Value? | Investor Playbook Podcast · EN
- 百勝加碼648%、微軟砍半51%:Terry Smith看到什麼? YouTube · 中文
- 百勝加碼648%、微軟砍半51%:Terry Smith看到什麼?|投資大師心法 Podcast · 中文