
Insights Investing
Mohnish Pabrai Q3 2026 13F Portfolio Analysis: Heavy Moves in Energy and Met Coal
Podcast · Listen (13 min)
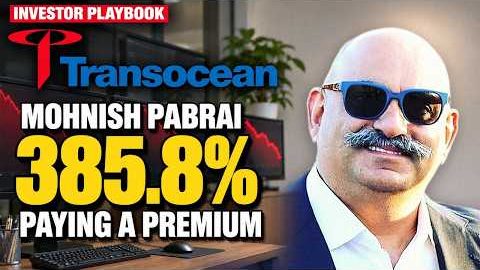
Pabrai's $42.3M Transocean Bet: Price 385.8% Above Value | Investor Playbook
In brief
DeepValues Research, “Mohnish Pabrai Q3 2026 13F Portfolio Analysis: Heavy Moves in Energy and Met Coal” (Nov 15, 2026): During the third quarter of 2026, Pabrai Investment Funds executed a major strategic shift by trimming its allocation in Alpha Metallurgical Resources (AMR) by 67% while aggressively expanding positions in offshore driller Transocean Ltd (RIG), Kazakh fintech powerhouse Kaspi.kz (KSPI), and top…
Source: https://research.deepvalues.ai/insights/2026-11-15-mohnish-pabrai-q3-2026-13f-portfolio-research/ · Markdown
Contents
- The Investor: Philosophy, Fund, and Lifetime Work
- Portfolio at Quarter End: Size, Concentration, and Core Holdings
- Dalal Street LLC (Pabrai Investment Funds) Q3 2026 Holdings Breakdown
- Portfolio Changes: Buys, Trims, and Rationale
- Valuation Deep Dives: Transocean and Warrior Met Coal
- Valuation Deep Dive: Transocean Ltd (RIG)
- Valuation Deep Dive: Warrior Met Coal, Inc. (HCC)
- Ten-Year 13F Clone Track Record vs. S&P 500
- Methodology & Rules
- 10-Year Performance Summary (2016–2026)
- Yearly Performance Comparison: Dalal Street 13F Clone vs. SPY
- Historical Clone Metrics & Structural Caveats
- What a Patient Investor Can Learn
- 1. The Double-Edged Sword of Ultra-Concentration
- 2. Cloning Requires Stomaching Structural Volatility
- 3. Valuing Deeply Cyclical Assets
- 4. Decisive Portfolio Trimming
- Key Numbers
- Closing Note: The Limits of SEC Form 13F Filings
During the third quarter of 2026, Pabrai Investment Funds executed a major strategic shift by trimming its allocation in Alpha Metallurgical Resources (AMR) by 67% while aggressively expanding positions in offshore driller Transocean Ltd (RIG), Kazakh fintech powerhouse Kaspi.kz (KSPI), and top metallurgical coal holding Warrior Met Coal (HCC). For value investors analyzing Mohnish Pabrai’s filings, this portfolio reshuffling offers a masterclass in cycle-based capital reallocation. It vividly demonstrates the real-world mechanics—and extreme volatility—of hyper-concentrated, low-risk/high-return "Dhandho" investing, where capital is decisively moved from mature cyclical winners into high-leverage operational turnarounds.
The Investor: Philosophy, Fund, and Lifetime Work#
Mohnish Pabrai, 60, is an Indian-American businessman, investor, and philanthropist born in Mumbai (Bombay), India, on June 12, 1964. Educated at Clemson University, Pabrai began his career at Tellabs between 1986 and 1991, working in high-speed data networking before transitioning to international marketing and sales. In 1991, he founded IT consulting and systems integration firm TransTech, Inc. with $30,000 from his 401(k) account and $70,000 in credit card debt. He built and operated TransTech until selling it in 2000 to Kurt Salmon Associates for $20 million.
Pabrai’s entrepreneurial grit and high risk tolerance are rooted in his family history. His father variously founded, bankrupted, or sold 15 separate companies, giving Pabrai an early, firsthand education in business cycles and failure, while his grandfather was the famous Indian magician Gogia Pasha.
In 1999, Pabrai established Pabrai Investment Funds, a family of value-oriented hedge funds modeled after Warren Buffett’s original 1950s partnership structures. Today, the firm manages over $1 billion in assets out of Irvine, California. Its US public equity holdings are reported via SEC Form 13F filings under management vehicle Dalal Street LLC (CIK 0001549575), located at 4407 Bee Cave Road, Suite 513, West Lake Hills, TX 78746-6496. DeepValues classifies Pabrai’s framework as pure value style.
Pabrai’s investment philosophy centers on three core pillars: * Extreme Concentration: Holding as few as 3 to 4 positions at a time and maintaining holding periods that frequently stretch past a decade. * Shameless Cloning: Publicly adopting high-conviction investment ideas directly from Warren Buffett, Charlie Munger, and other legendary value investors. * The Dhandho Framework: Seeking asymmetric risk/reward bets characterized by "heads, I win; tails, I don't lose much."
In June 2007, Pabrai and fellow investor Guy Spier made international headlines by bidding $650,100 for a charity lunch with Warren Buffett. Pabrai’s methodology is documented across his published works, including The Dhandho Investor: The Low-Risk Value Method to High Returns and Mosaic: Perspectives on Investing (a compilation of articles distilling Buffett’s framework). His career and personal philosophy are also detailed in Guy Spier’s book, The Education of a Value Investor, in the chapter titled "Doing Business the Buffett-Pabrai Way." Pabrai maintains a prominent public presence through his website Chai with Pabrai, annual lectures at Peking University, guest podcast appearances, and annual shareholder letters.
Pabrai’s concentrated, cycle-driven strategy has generated landmark multi-bagger wins alongside sharp portfolio drags: * Major Portfolio Wins: An early concentrated bet on Tesla in 2020 (which he acknowledged selling too early) and heavy exposure to international crude oil tankers via Frontline in 2022. * Concentration Risk Failures: A complete total-loss write-off in zinc producer Horsehead Holdings in 2016, illustrating the downside of hyper-concentrated position sizes when financial leverage fails.
Outside of asset management, Pabrai is deeply involved in philanthropy. In 2005, Pabrai and his then-wife Harina Kapoor (married in 1992, divorced in 2019) established the Dakshana Foundation. The foundation recycles approximately 2% of their wealth—roughly $1 million annually—into Indian society. Modeled after Super 30 (founded by Anand Kumar at the Ramanujan School of Mathematics), Dakshana provides intensive, world-class higher-education tutoring to underprivileged students, enabling them to clear competitive entrance exams for top Indian technical universities.
Portfolio at Quarter End: Size, Concentration, and Core Holdings#
As of September 30, 2026, Dalal Street LLC’s reported US long equity portfolio totaled $362.1 million, expanding 10.8% from $326.7 million at the end of Q2 2026. True to Pabrai’s strict concentration guidelines, the portfolio is held across just 4 individual positions. Consequently, the top holdings represent 100.0% of reported US equity assets.
Dalal Street LLC (Pabrai Investment Funds) Q3 2026 Holdings Breakdown#
| Company Name | Ticker | Value ($M) | Portfolio Share (%) | Share Count Change (%) |
|---|---|---|---|---|
| Warrior Met Coal, Inc. | HCC | $164.5 | 45.4% | +7% |
| TRANSOCEAN LTD | RIG | $149.2 | 41.2% | +40% |
| ALPHA METALLURGICAL RESOURCES, INC. | AMR | $28.7 | 7.9% | -67% |
| Joint Stock Company Kaspi.kz | KSPI | $19.7 | 5.4% | +12192% |
Portfolio Changes: Buys, Trims, and Rationale#
Analyzing Dalal Street LLC’s Q3 2026 trades by capital magnitude reveals a clear pivot away from mature coking coal gains toward high-beta offshore drilling leverage and emerging market tech expansion. During the quarter, Pabrai opened 0 new positions, added to 3 existing holdings, trimmed 1 position, and sold out of 0 positions. Total buying during the period reached approximately $72.7 million against total selling of $58.3 million, making Dalal Street LLC a net buyer of ~$14.4 million with quarterly portfolio turnover of ~16.9%.
Ordered by absolute dollar size of the trade, quarterly activity breaks down as follows:
- ALPHA METALLURGICAL RESOURCES, INC. (AMR)
- Reported SEC Fact: Trimmed share count by 67% (an estimated sell volume of ~$58.3 million). The position dropped to $28.7 million, reducing its portfolio weight from prior peak levels to 7.9%.
- Inferred Motive: Capital reallocation. Slicing a long-held coking coal producer after a multi-year cyclical run-up to harvest gains and fund higher-conviction, depressed cyclical opportunities.
- TRANSOCEAN LTD (RIG)
- Reported SEC Fact: Added 40% more shares (an estimated buy volume of ~$42.3 million). The position expanded to $149.2 million, making up 41.2% of reported US equities.
- Inferred Motive: Doubling down on deep-water offshore drilling leverage where day rates and order backlogs are expanding, capitalizing on an industry capacity recovery.
- Joint Stock Company Kaspi.kz (KSPI)
- Reported SEC Fact: Increased share count by 12,192% (an estimated buy volume of ~$19.5 million). The position increased to $19.7 million, or 5.4% of the portfolio.
- Inferred Motive: Scaling up a small initial probe position into a core portfolio allocation following secondary listing price corrections.
- Warrior Met Coal, Inc. (HCC)
- Reported SEC Fact: Increased share count by 7% (an estimated buy volume of ~$10.9 million). The allocation grew to $164.5 million, maintaining its position as the fund's top US holding at 45.4%.
- Inferred Motive: Incremental capital deployment into his top-conviction metallurgical coal operator, rebalancing allocations across the met-coal basket.
Valuation Deep Dives: Transocean and Warrior Met Coal#
To evaluate Pabrai’s major portfolio allocations, DeepValues compiled owner-earnings Discounted Cash Flow (DCF) models based on 10 years of SEC XBRL filings (Form 10-K and Form 10-Q).
Valuation Deep Dive: Transocean Ltd (RIG)#
- Market Data Summary (as of November 14, 2026): Stock Price: $5.54 | Shares Outstanding: 1.117 billion | Market Capitalization: $6.2 billion.
- Balance Sheet Metrics: Cash & Marketable Securities: $0.6 billion | Total Debt: $8.5 billion | Net Cash: -$7.8 billion.
RIG Ten-Year Owner Earnings Table (in $ Billions)#
Owner Earnings (Maintenance Capex) = Operating Cash Flow - Maintenance Capex - Stock Compensation. Maintenance Capex is defined as the smaller of Capex and D&A.
| Period | Revenue | Net Income | Operating Cash Flow | Capex | D&A | Stock Comp | Owner Earnings (Maint. Capex) | Owner Earnings (All Capex) |
|---|---|---|---|---|---|---|---|---|
| FY 2016 | 4.2 | 0.8 | 2.0 | 1.3 | 0.9 | 0.0 | 1.0 | 0.6 |
| FY 2017 | 3.0 | -3.1 | 1.2 | 0.5 | 0.8 | 0.0 | 0.6 | 0.6 |
| FY 2018 | 3.0 | -2.0 | 0.6 | 0.2 | 0.8 | 0.0 | 0.3 | 0.3 |
| FY 2019 | 3.1 | -1.3 | 0.3 | 0.4 | 0.9 | 0.0 | -0.1 | -0.1 |
| FY 2020 | 3.2 | -0.6 | 0.4 | 0.3 | 0.8 | 0.0 | 0.1 | 0.1 |
| FY 2021 | 2.6 | -0.6 | 0.6 | 0.2 | 0.7 | 0.0 | 0.3 | 0.3 |
| FY 2022 | 2.6 | -0.6 | 0.4 | 0.7 | 0.7 | 0.0 | -0.3 | -0.3 |
| FY 2023 | 2.8 | -1.0 | 0.2 | 0.4 | 0.7 | 0.0 | -0.3 | -0.3 |
| FY 2024 | 3.5 | -0.5 | 0.4 | 0.3 | 0.7 | 0.0 | 0.1 | 0.1 |
| FY 2025 | 4.0 | -2.9 | 0.7 | 0.1 | 0.7 | 0.0 | 0.6 | 0.6 |
| TTM 2026-09-30 | 4.0 | 0.3 | 0.9 | 0.1 | 0.6 | 0.0 | 0.8 | 0.8 |
RIG DCF Valuation Scenarios (10.0% Discount Rate, $0.8B TTM Owner Earnings)#
| Case | Starting Owner Earnings ($B) | Years 1–5 Growth Rate ($g$) | Intrinsic Value per Share | Price vs. Intrinsic Value |
|---|---|---|---|---|
| Conservative | 0.8 | 0.0% | $1.14 | Price is 385.8% above value |
| Base | 0.8 | 0.0% | $1.14 | Price is 385.8% above value |
| Optimistic | 0.8 | 4.0% | $3.16 | Price is 75.3% above value |
- Reverse DCF & Implied Growth: At the current market price of $5.54 ($6.2B market cap), the model implies that the market is pricing in owner earnings growth of 7.8% annually for 5 years, fading to a 2.5% terminal growth rate at a 10.0% discount rate. Relative to the mechanical base intrinsic value of $1.14 per share, RIG trades at a negative margin of safety (-385.8%).
- Verification: Double verified across SEC XBRL filings and the DeepValues database (0.0% variance between calculation runs). As a point of reference, the DeepValues standalone app owner-earnings model (which applies an 8.5% discount rate) yields a fair value range of $7.52 to $15.54 per share, with a base value of $10.74.
- Investor Behavior Evaluation: Why is Pabrai aggressively buying RIG when mechanical steady-state DCF models show a negative margin of safety? Standard historical DCF models fail to capture deep-cyclical turning points. Deep-cyclical value investors buy offshore drillers at earnings troughs when trailing ten-year owner earnings appear depressed due to legacy asset write-downs and heavy debt service (-$7.8B net cash balance). Pabrai is betting on peak-cycle normalized earning power: as day rates re-price upward across Transocean's ultra-deepwater fleet, operating cash flows expand exponentially faster than fixed capital expenditures, creating dramatic upside leverage that historical accounting averages completely obscure.
Valuation Deep Dive: Warrior Met Coal, Inc. (HCC)#
- Market Data Summary (as of November 14, 2026): Stock Price: $83.35 | Shares Outstanding: 0.053 billion | Market Capitalization: $4.4 billion.
- Balance Sheet Metrics: Cash & Marketable Securities: $0.4 billion | Total Debt: $0.2 billion | Net Cash: $0.3 billion.
HCC Ten-Year Owner Earnings Table (in $ Billions)#
| Period | Revenue | Net Income | Operating Cash Flow | Capex | D&A | Stock Comp | Owner Earnings (Maint. Capex) | Owner Earnings (All Capex) |
|---|---|---|---|---|---|---|---|---|
| FY 2017 | 1.2 | 0.5 | 0.4 | 0.1 | 0.1 | 0.0 | 0.4 | 0.3 |
| FY 2018 | 1.4 | 0.7 | 0.6 | 0.1 | 0.1 | 0.0 | 0.5 | 0.5 |
| FY 2019 | 1.3 | 0.3 | 0.5 | 0.1 | 0.1 | 0.0 | 0.4 | 0.4 |
| FY 2020 | 0.8 | -0.0 | 0.1 | 0.1 | 0.1 | 0.0 | 0.0 | 0.0 |
| FY 2021 | 1.1 | 0.2 | 0.4 | 0.1 | 0.1 | 0.0 | 0.3 | 0.3 |
| FY 2022 | 1.7 | 0.6 | 0.8 | 0.2 | 0.1 | 0.0 | 0.7 | 0.6 |
| FY 2023 | 1.7 | 0.5 | 0.7 | 0.5 | 0.1 | 0.0 | 0.6 | 0.2 |
| FY 2024 | 1.5 | 0.3 | 0.4 | 0.5 | 0.2 | 0.0 | 0.2 | -0.1 |
| FY 2025 | 1.3 | 0.1 | 0.2 | 0.3 | 0.2 | 0.0 | 0.0 | -0.1 |
| TTM 2026-09-30 | 1.9 | 0.2 | 0.4 | 0.2 | 0.2 | 0.0 | 0.1 | 0.1 |
HCC DCF Valuation Scenarios (10.0% Discount Rate, $0.1B TTM Owner Earnings)#
| Case | Starting Owner Earnings ($B) | Years 1–5 Growth Rate ($g$) | Intrinsic Value per Share | Price vs. Intrinsic Value |
|---|---|---|---|---|
| Conservative | 0.1 | 0.0% | $30.50 | Price is 173.3% above value |
| Base | 0.1 | 0.0% | $30.50 | Price is 173.3% above value |
| Optimistic | 0.1 | 4.0% | $36.74 | Price is 126.8% above value |
- Reverse DCF & Implied Growth: At $83.35 per share ($4.4B market cap), the market implies owner earnings growth of 20.9% annually for 5 years, fading to 2.5% terminal growth at a 10.0% discount rate. Against the trailing base intrinsic value of $30.50, HCC carries a negative mechanical margin of safety (-173.3%).
- Verification: Double verified across SEC filings and second-source financial databases (0.0% variance between runs).
- Investor Behavior Evaluation: Similar to RIG, Pabrai's addition to HCC despite a high mechanical DCF market premium demonstrates his cyclical commodity strategy. HCC has been heavily investing in long-term growth projects (Blue Creek expansion), which artificially suppresses trailing owner earnings after all capex ($0.1B TTM vs. peak $0.7B in FY 2022). Pabrai is valuing HCC on its pristine balance sheet ($0.3B net cash) and low-cost steelmaking coal volume capacity upon project completion, looking past depressed trailing cash flow metrics.
Ten-Year 13F Clone Track Record vs. S&P 500#
To measure the real-world performance of Pabrai’s US public equities strategy, DeepValues tracks a simulated 10-year "13F Clone" portfolio for Dalal Street LLC.
Methodology & Rules#
The clone model buys reported US common stock positions at the market close of the first trading day following the SEC Form 13F deadline. Positions are reweighted by reported filing value and held until the next filing quarter. Performance calculations utilize dividend-adjusted total returns benchmarked against the SPDR S&P 500 ETF Trust (SPY) over a 10-year window (November 14, 2016 to November 13, 2026, encompassing 40 quarterly filings).
10-Year Performance Summary (2016–2026)#
- Dalal Street 13F Clone: CAGR 7.9% | Total Return: +113.3% | Max Drawdown: -60.2%
- S&P 500 (SPY): CAGR 15.1% | Total Return: +307.8% | Max Drawdown: -23.9%
- Annualized Underperformance Spread: -7.2 percentage points per year.
Yearly Performance Comparison: Dalal Street 13F Clone vs. SPY#
| Year | Dalal Street 13F Clone Return | S&P 500 (SPY) Return |
|---|---|---|
| 2016* | +2.6% | +3.8% |
| 2017 | +37.4% | +21.7% |
| 2018 | -11.7% | -4.6% |
| 2019 | +27.4% | +31.2% |
| 2020 | +21.9% | +18.3% |
| 2021 | +6.0% | +28.7% |
| 2022 | -49.0% | -18.2% |
| 2023 | +137.8% | +26.2% |
| 2024 | -32.6% | +24.9% |
| 2025 | +15.9% | +17.7% |
| 2026* | +10.0% | +11.5% |
*Partial year return within the 10-year evaluation window.
Historical Clone Metrics & Structural Caveats#
- Historical Portfolio Metrics: Over the 10-year period, Dalal Street LLC held an average of just 3 positions in its reported US 13F filings, with historical quarterly turnover averaging 17.9% per quarter.
- Volatile Return Dispersion: The 13F clone exhibits massive return swings, alternating between devastating drawdowns (2022: -49.0%; 2024: -32.6%) and explosive outperformance (2023: +137.8%).
- Price Coverage Limitations: Market price coverage averaged 71.2% across the ten-year period. Because coverage dropped below the standard 80% threshold, unpriced positions were excluded and remaining holdings reweighted, making these figures rough performance estimates rather than precise fund returns.
- Major Exclusions: Form 13F filings omit non-US listed equities (such as Pabrai’s major investments on Indian exchanges or Kaspi.kz's primary international listings), cash balances, fixed income, short positions, and trades opened and closed within a single quarter.
What a Patient Investor Can Learn#
1. The Double-Edged Sword of Ultra-Concentration#
Holding as few as 3 to 4 core positions enables massive outperformance during cyclical upswings (such as the fund's +137.8% surge in 2023). However, this concentration subjects capital to violent portfolio drawdowns (-60.2% peak-to-trough drop) when underlying commodity cycles turn downward simultaneously.
2. Cloning Requires Stomaching Structural Volatility#
Blindly copying US 13F filings up to 45 days after quarter-end—without access to non-US portfolio assets or cash buffers—lagged the S&P 500 by -7.2% annually over a decade. Retail cloners must recognize that 13F filings represent delayed fragments of a multi-asset global strategy.
3. Valuing Deeply Cyclical Assets#
Steady-state owner earnings DCF models built on trailing twelve-month accounting figures consistently report negative margins of safety for deep-cyclical commodity and energy services companies like Transocean (RIG) and Warrior Met Coal (HCC). Value investors specializing in cyclicals buy at cash flow troughs based on normalized peak earnings power rather than historical accounting averages.
4. Decisive Portfolio Trimming#
Ultra-concentrated investing requires aggressive capital recycling when position risk/reward profiles change. Pabrai’s decision to slice 67% of his AMR holding demonstrates a willingness to harvest gains from mature investments to fund higher-conviction, early-stage cyclical turnarounds.
Key Numbers#
- Total Reported US Long Equity (Q3 2026): $362.1M (across 4 positions).
- Portfolio Concentration: Top position (HCC) = 45.4%; Top 2 positions (HCC + RIG) = 86.6%; Top 10 = 100.0%.
- Net Quarterly Trading Activity: Purchased ~$72.7M, Sold ~$58.3M (Net buyer of ~$14.4M; Quarterly turnover ~16.9%).
- Transocean (RIG) Base Intrinsic Value: $1.14 per share vs. Market Price of $5.54 (Margin of Safety: -385.8%).
- Warrior Met Coal (HCC) Base Intrinsic Value: $30.50 per share vs. Market Price of $83.35 (Margin of Safety: -173.3%).
- 10-Year 13F Clone Track Record: CAGR 7.9% vs. SPY 15.1% (Max Drawdown: -60.2%; Average quarterly turnover: 17.9%).
Closing Note: The Limits of SEC Form 13F Filings#
SEC Form 13F reports reflect only US-listed long equity positions held by institutional money managers at the close of the calendar quarter (September 30, 2026) and are submitted up to 45 days after quarter-end. Form 13F filings completely omit short positions, cash holdings, fixed income securities, non-US equities listed on foreign exchanges, derivative instruments, and any trades executed after the quarter concluded. This report is prepared strictly for educational, informational, and research purposes and does not constitute investment advice.

Watch
Source links
- DEEPVALUES 13F WORKSHEET: Mohnish Pabrai (Pabrai …
- EDGAR Filing Documents for 0001549575-26-000023
- Mohnish Pabrai - Wikipedia
- Transocean (RIG) Stock Analysis & Intrinsic Value: Neutral
- Warrior Met Coal (HCC) Stock Analysis: Neutral | DeepValues
Watch & listen
- Pabrai's $42.3M Transocean Bet: Price 385.8% Above Value YouTube · EN
- Pabrai's $42.3M Transocean Bet: Price 385.8% Above Value | Investor Playbook Podcast · EN
- 帕布萊重壓HCC與RIG:86%資金押在股價遠高於價值的煤炭與鑽井 YouTube · 中文
- 帕布萊重壓HCC與RIG:86%資金押在股價遠高於價值的煤炭與鑽井|投資大師心法 Podcast · 中文