
Insights Investing
Seth Klarman’s Baupost Group Q3 2026 13F Portfolio Analysis
Podcast · Listen (15 min)
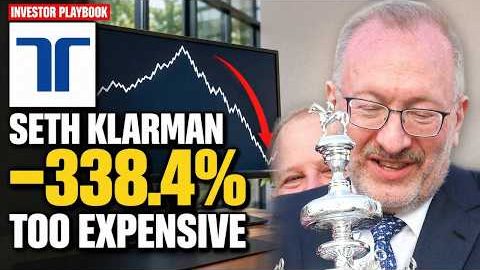
Klarman Dumps Teleflex, Buys $175.4M of Honeywell | Investor Playbook
In brief
DeepValues Research, “Seth Klarman’s Baupost Group Q3 2026 13F Portfolio Analysis” (Nov 15, 2026): During the third quarter of 2026 (period ended September 30, 2026; filed with the SEC on November 13, 2026 under accession number 0001061768-26-000015), Seth Klarman’s Baupost Group operated as a net seller within the U.S. public equity market.
Source: https://research.deepvalues.ai/insights/2026-11-15-seth-klarman-q3-2026-13f-portfolio-research/ · Markdown
Contents
- The investor: philosophy, fund and lifetime work
- Signature Victories and Cash Drag
- Literary and Scholarly Work
- The portfolio at quarter end: size, concentration, core holdings
- Core Equity Holdings as of Q3 2026
- What changed: new, added, trimmed and sold-out positions
- Strategic Portfolio Themes
- Summary of Q3 2026 Portfolio Adjustments
- The biggest moves, valued
- 1. Teleflex Incorporated (TFX) — Full Exit ($178.6M Liquidated)
- 2. Norwegian Cruise Line Holdings Ltd. (NCLH) — Full Exit ($163.2M Liquidated)
- 3. Alphabet Inc. (GOOG) — Trimmed 31% (~$143.8M Sold)
- Track record: the ten-year 13F clone against the S&P 500
- Methodology & Parameters
- Baseline Portfolio Characteristics
- Performance Breakdown (Nov 2016 – Nov 2026)
- Annual Return Breakdown
- Essential 13F Clone Caveats
- What a patient investor can learn
- 1. Absolute Valuation Discipline Over Holding Narratives
- 2. Evaluating Capex Quality and True Maintenance Costs
- 3. Independence from Benchmark-Relative Tracking
- Key numbers
- Regulatory Disclosures & SEC Form 13F Limitations
- SEC Form 13F Limitations
During the third quarter of 2026 (period ended September 30, 2026; filed with the SEC on November 13, 2026 under accession number 0001061768-26-000015), Seth Klarman’s Baupost Group operated as a net seller within the U.S. public equity market. Baupost trimmed its reported U.S. long equity portfolio from $5.42 billion across 23 positions at the end of Q2 2026 to $5.05 billion across 21 positions by Q3 end. During the quarter, the firm executed approximately $760.0 million in sales against approximately $439.4 million in purchases, resulting in net equity selling of $320.6 million and a quarterly portfolio turnover of roughly 8.4%. Capital reallocation was highlighted by complete liquidations in Teleflex Incorporated ($178.6 million) and Norwegian Cruise Line Holdings Ltd. ($163.2 million), alongside major trims in core holdings Alphabet Inc. (-31%) and Union Pacific Corp. (-33%). Conversely, Baupost committed capital to specialized assets, initiating positions in Honeywell Aerospace Inc. ($175.4 million) and SiteOne Landscape Supply, Inc. ($112.4 million). For long-term value investors, this strategic pivot toward cash accumulation and risk de-escalation reflects Klarman’s unwavering focus on downside protection, preserving capital when intrinsic value margins narrow across public markets.
The investor: philosophy, fund and lifetime work#
Seth Andrew Klarman (born May 21, 1957 in New York City) is the Chief Executive Officer and Portfolio Manager of the Baupost Group, a Boston-based private investment partnership he co-founded in 1982. Raised in the Mount Washington neighborhood of Baltimore, Maryland, the 68-year-old investor earned an AB in Economics magna cum laude with a minor in history from Cornell University in 1979 and graduated as a Baker Scholar from Harvard Business School with an MBA in 1982.
Following his graduation from Harvard, Klarman co-founded Baupost Group in Boston alongside HBS Professor William J. Poorvu and partners Howard H. Stevenson, Jordan Baruch, and Isaac Auerbach. Starting with $27 million in initial capital derived from Poorvu’s sale of a local television station, Klarman accepted a starting salary of $35,000 per year, quickly establishing a reputation for exhaustive primary research and rigorous risk management.
Klarman is widely regarded as one of the preeminent modern practitioners of Benjamin Graham’s margin-of-safety value investing framework. Baupost’s mandate focuses on acquiring mispriced, abhorred, or distressed assets at deep discounts to their conservative intrinsic value. The fund operates flexibly across corporate restructurings, spinoffs, distressed debt, real estate, and public equities. A defining signature of Klarman’s approach is holding substantial cash reserves—frequently ranging between 20% and 50% of total assets under management—when compelling opportunities offering adequate margins of safety are scarce. His foundational rule dictates that investors must focus on risk and downside protection first, allowing investment returns to take care of themselves.
Signature Victories and Cash Drag#
Klarman’s long-term reputation was forged through high-conviction, non-consensus investments executed during periods of acute market dislocation: * Lehman Brothers Senior Debt (2009): In the aftermath of the Lehman collapse, Baupost accumulated senior bonds at approximately 9 cents on the dollar, eventually realizing recoveries of roughly 40 cents on the dollar. * CIT Group Restructuring (2009): Baupost acquired distressed bonds of commercial lender CIT Group at 65 cents on the dollar while yielding 15%. When CIT entered prepackaged bankruptcy, Baupost provided debtor financing, eventually settling its debt positions at 80 cents on the dollar. * FacetBiotech Spinoff (2009): Klarman amassed a stake in FacetBiotech at an average cost of $9 per share, noting that the spinoff held $17 per share in net cash. After rejecting a hostile takeover bid from Biogen at $14 per share, FacetBiotech was acquired by Abbott Laboratories for $27 per share, contributing to Baupost's +27% net return in 2009.
Conversely, holding multi-billion-dollar cash reserves during extended bull markets creates structural cash drag relative to long-only equity benchmarks. Throughout the post-2010 equity expansion, Baupost's uninvested cash clipped relative U.S. equity benchmark returns—a trade-off Klarman explicitly accepts in exchange for absolute downside protection and liquidity preservation.
Literary and Scholarly Work#
In 1991, Klarman authored Margin of Safety: Risk Averse Investing Strategies for the Thoughtful Investor. Published in a limited run of approximately 5,000 copies, the book critiques retail market speculation, short-term Wall Street forecasting, and indexation, advocating for strict fundamental valuation. Out of print for decades, physical copies are highly sought after by value investors, trading between $700 and $4,000 on secondary markets. In 2008, Klarman served as the lead editor for the 6th edition of Benjamin Graham and David Dodd’s foundational text, Security Analysis.
The portfolio at quarter end: size, concentration, core holdings#
As of September 30, 2026, Baupost Group’s reported U.S. long equity portfolio totaled $5.05 billion across 21 positions, down from $5.42 billion across 23 positions at the end of Q2 2026. The portfolio remains highly concentrated, with the top 10 positions accounting for 77.0% of total reported equity value.
Core Equity Holdings as of Q3 2026#
The following table details Baupost Group's reported U.S. long equity positions at quarter-end, ordered by portfolio market value:
| Ticker | Company Name | Value ($M) | % of Portfolio | Q3 Share Change |
|---|---|---|---|---|
| AMZN | Amazon.com Inc. | $932.8M | 18.5% | Unchanged |
| ELV | Elevance Health, Inc. | $495.8M | 9.8% | Unchanged |
| QSR | Restaurant Brands International Inc. | $480.1M | 9.5% | Unchanged |
| GPC | Genuine Parts Co. | $389.5M | 7.7% | +10% |
| FERG | Ferguson Enterprises Inc. | $349.9M | 6.9% | +8% |
| GOOG | Alphabet Inc. | $323.7M | 6.4% | -31% |
| WCC | WESCO International Inc. | $258.4M | 5.1% | +8% |
| V | Visa Inc. | $252.0M | 5.0% | Unchanged |
| UNP | Union Pacific Corp. | $216.5M | 4.3% | -33% |
| AON | Aon plc | $186.8M | 3.7% | -2% |
| CME | CME Group Inc. | $179.6M | 3.6% | +11% |
| HONA | Honeywell Aerospace Inc. | $175.4M | 3.5% | New |
| HLF | Herbalife Ltd. | $124.5M | 2.5% | +11% |
| GDS | GDS Holdings Limited | $117.7M | 2.3% | Unchanged |
| SITE | SiteOne Landscape Supply, Inc. | $112.4M | 2.2% | New |
(Note: The total U.S. long equity portfolio also includes smaller positions, including Molina Healthcare ($85.0M) and Axalta Coating Systems ($80.6M), bringing total reported equity positions to 21).
What changed: new, added, trimmed and sold-out positions#
During Q3 2026, Baupost Group executed changes across 16 positions: initiating 2 new positions, adding to 6 existing holdings, trimming 4 positions, and completely exiting 4 holdings. Total purchases at quarter-end prices totaled ~$439.4 million against total sales of ~$760.0 million, establishing net equity sales of $320.6 million and quarterly portfolio turnover of ~8.4%.
Strategic Portfolio Themes#
Baupost’s transaction activity during the quarter clusters around distinct capital allocation themes: * Wholesale Distribution Compounders: Baupost selectively added to high-quality industrial and commercial distribution networks, purchasing additional shares in Genuine Parts Co. (+$35.4M), Ferguson Enterprises (+$26.9M), and WESCO International (+$20.0M), while initiating a $112.4M position in SiteOne Landscape Supply. * Specialized Aerospace Spinoffs: Initiated a $175.4M position in Honeywell Aerospace Inc. (HONA), following Baupost's historical blueprint of targeting price dislocations in newly spun-off equity assets. * Capital-Heavy & Valuation-Strained Liquidations: Fully exited Teleflex Incorporated ($178.6M prior value) due to severe valuation overhang relative to owner earnings, and Norwegian Cruise Line Holdings ($163.2M prior value) to eliminate ongoing total capex cash drain. * Disciplined Profit-Taking: Harvested gains in mega-cap technology and industrial holdings trading near or above baseline intrinsic values, trimming Alphabet Inc. (-31%) and Union Pacific Corp. (-33%).
Summary of Q3 2026 Portfolio Adjustments#
The complete list of portfolio adjustments executed during Q3 2026, ordered strictly by absolute dollar size (largest capital moves first):
- TFX (Teleflex Incorporated): Sold out completely (prior value ~$178.6M). (Inferred motive: Exit driven by severe valuation overhang, as market price traded well above conservative owner-earnings capacity).
- HONA (Honeywell Aerospace Inc): New position of $175.4M (3.5% of equity portfolio). (Inferred motive: Opportunistic entry into a specialized aerospace spinoff asset trading at a discount to intrinsic value).
- NCLH (Norwegian Cruise Line Holdings Ltd.): Sold out completely (prior value ~$163.2M). (Inferred motive: De-risking balance sheet exposure due to heavy total capex requirements and cyclical leverage drag).
- GOOG (Alphabet Inc.): Trimmed share count by 31% (~$143.8M sell); remaining position valued at $323.7M (6.4% of portfolio). (Inferred motive: Capital harvesting and position sizing as market price traded slightly above conservative DCF intrinsic value).
- SITE (SiteOne Landscape Supply, Inc.): New position of $112.4M (2.2% of equity portfolio). (Inferred motive: Initiating a long-term position in a dominant wholesale landscape distribution network).
- UNP (Union Pacific Corp): Trimmed share count by 33% (~$106.1M sell); remaining position valued at $216.5M (4.3% of portfolio). (Inferred motive: Capital harvesting following price appreciation).
- LBTYK (Liberty Global Ltd. Class C): Sold out completely (prior value ~$94.0M). (Inferred motive: Reallocating capital away from mature media and cable assets).
- AXTA (Axalta Coating Systems Ltd.): Increased share count by 97% (~$39.6M buy); position now valued at $80.6M (1.6% of portfolio). (Inferred motive: Doubling down on a discounted specialty coatings compounder).
- DNOW (NOW Inc.): Sold out completely (prior value ~$36.2M). (Inferred motive: Complete exit of a minor industrial distribution holding).
- GPC (Genuine Parts Co): Increased share count by 10% (~$35.4M buy); position now valued at $389.5M (7.7% of portfolio). (Inferred motive: Accumulating shares in a core high-conviction industrial and automotive distributor).
- MOH (Molina Healthcare, Inc.): Trimmed share count by 29% (~$34.8M sell); remaining position valued at $85.0M (1.7% of portfolio). (Inferred motive: Sizing adjustment within managed care exposure).
- FERG (Ferguson Enterprises Inc.): Increased share count by 8% (~$26.9M buy); position now valued at $349.9M (6.9% of portfolio). (Inferred motive: Incremental build in a high-quality plumbing and HVAC distribution asset).
- WCC (WESCO International Inc): Increased share count by 8% (~$20.0M buy); position now valued at $258.4M (5.1% of portfolio). (Inferred motive: Incremental build in a core electrical distribution position).
- CME (CME Group Inc.): Increased share count by 11% (~$17.4M buy); position now valued at $179.6M (3.6% of portfolio). (Inferred motive: Opportunistic addition to a capital-light financial derivatives exchange).
- HLF (Herbalife Ltd.): Increased share count by 11% (~$12.1M buy); position now valued at $124.5M (2.5% of portfolio). (Inferred motive: Opportunistic averaging down in a high-yield turnaround position).
The biggest moves, valued#
To analyze Baupost’s primary exits and trims in Q3 2026, DeepValues Research conducted owner-earnings Discounted Cash Flow (DCF) modeling and Reverse DCF calculations based on official SEC XBRL filings (Form 10-K and Form 10-Q).
Owner earnings are defined as: $$\text{Owner Earnings} = \text{Operating Cash Flow} - \text{Maintenance Capex} - \text{Stock-Based Compensation}$$
Standard maintenance capex is defined as the smaller of total capital expenditures and depreciation & amortization. A secondary, stricter metric—Owner Earnings After All Capex—subtracts total reported capex.
All DCF intrinsic value evaluations apply a 10.0% discount rate, growing cash flows for Years 1–5 at rate $g$, fading growth linearly to 2.5% over Years 6–10, and calculating a perpetual terminal value at 2.5%. Reverse DCF calculations solve for the 5-year growth rate $g$ implied by current market pricing under these exact standard discount and terminal rate parameters.
1. Teleflex Incorporated (TFX) — Full Exit ($178.6M Liquidated)#
- Market Price & Intrinsic Value: Market price at $155.10. DeepValues Base Intrinsic Value sits at $35.38 (Conservative Case: $35.38 | Optimistic Case: $51.59).
- Margin of Safety: -338.4% (Market price trades 338.4% above base intrinsic value).
- Owner Earnings Profile: TTM owner earnings (ended Sept 30, 2026) stand at $0.2 billion (Operating cash flow of $0.3B minus maintenance capex/depreciation of $0.1B). Over the 10-year historical window (FY 2016 through TTM 2026), TFX revenue grew modestly from $1.9B to $2.3B, while annualized owner-earnings growth stagnated at 0.0%.
- Reverse DCF Mechanics: At $155.10 (market capitalization of $6.2B), applying a 10.0% discount rate fading to a 2.5% terminal rate implies that TFX owner earnings must grow at 19.2% annually for the next 5 years. This market growth expectation severely diverges from TFX’s historical 10-year owner-earnings growth rate of 0.0%.
- Verification Status: Double Verified (Run A SEC filings vs Run B secondary database match with 0.0% variance).
- Investor Stance: Klarman liquidated the $178.6 million position completely, enforcing price discipline by selling an asset trading drastically above base intrinsic value.
2. Norwegian Cruise Line Holdings Ltd. (NCLH) — Full Exit ($163.2M Liquidated)#
- Market Price & Intrinsic Value: Market price at $17.96. DeepValues Base Intrinsic Value sits at $22.17 (Conservative Case: $11.62 | Optimistic Case: $27.40).
- Margin of Safety: 19.0% discount to base intrinsic value.
- Owner Earnings Profile: TTM owner earnings under standard maintenance capex stand at $0.8 billion (Operating cash flow of $2.2B minus maintenance capex of $1.3B and stock comp of $0.1B). However, total TTM capex reached $2.7 billion ($1.5B in spending above depreciation). Evaluating NCLH under the strict view—Owner Earnings After All Capex—reveals a cash drain of -$0.7 billion.
- Conservative DCF Case Drivers: The conservative intrinsic value drops sharply to $11.62 (putting the market price 54.5% above value). The DeepValues conservative DCF model explicitly penalizes capital-intensive companies by treating 50% of capex above depreciation as unacknowledged maintenance upkeep ($0.75B added to maintenance capex), reducing starting owner earnings to $0.4B.
- Reverse DCF Mechanics: At $17.96 (market capitalization of $8.2B), the market implies owner earnings declining at -4.0% annually for 5 years before fading to 2.5% at a 10.0% discount rate.
- Verification Status: Double Verified (0.3% variance between Run A at $22.17 and Run B at $22.24).
- Investor Stance: Klarman exited the $163.2 million position despite a nominal 19.0% margin of safety under base maintenance assumptions. Inferred motive: Heavy ongoing capex ($2.7B total capex resulting in -$0.7B post-all-capex cash drain) indicated that growth capex was acting as unacknowledged maintenance cost required to keep fleet assets competitive, undermining confidence in the base margin of safety.
3. Alphabet Inc. (GOOG) — Trimmed 31% (~$143.8M Sold)#
- Market Price & Intrinsic Value: Market price at $292.52. DeepValues Base Intrinsic Value sits at $277.40 (Conservative Case: $99.98 | Optimistic Case: $340.25).
- Margin of Safety: -5.5% (Market price sits 5.5% above base intrinsic value).
- Owner Earnings Profile: TTM owner earnings under standard maintenance capex stand at $121.1 billion (Operating cash flow of $179.6B minus maintenance capex of $28.0B and stock-based compensation of $30.4B). However, Alphabet's AI infrastructure push drove total TTM capex to $159.8B ($131.8B above depreciation). Under the strict all-capex view, owner earnings turned negative at -$10.7 billion.
- Conservative DCF Case Drivers: The conservative intrinsic value drops to $99.98 (price 192.6% above value). The conservative DCF model penalizes massive growth capex by adding 50% of capex above depreciation ($65.9B) to baseline maintenance upkeep. This reduces starting owner earnings from $121.1B to $60.6B and lowers 5-year assumed growth from 15.0% to 7.5%.
- Reverse DCF Mechanics: At $292.52 (market value $3,596.2B), the market implies owner earnings growth of 16.0% annually for 5 years, fading to 2.5% at a 10.0% discount rate. This aligns closely with Alphabet's historical 10-year growth base case of 15.0%.
- Verification Status: Single-Source Estimate (Run B could not be computed due to missing historical periods in the secondary database).
- Investor Stance: Baupost trimmed 31% of its shares (~$143.8M sell), retaining a $323.7M stake (6.4% of portfolio). Inferred motive: Taking profits as stock pricing passed base intrinsic value ($292.52 vs. $277.40), while reducing portfolio exposure to historic levels of capital expenditure.
Track record: the ten-year 13F clone against the S&P 500#
To evaluate the U.S. public equity stock selection track record of Baupost Group, DeepValues Research tracks a standardized 13F Clone Model.
Methodology & Parameters#
The 13F Clone model purchases common stock positions disclosed in Baupost’s SEC filings, weighted by reported value, at the closing price of the first trading day following the SEC filing deadline. Positions are rebalanced quarterly upon subsequent 13F filings. Returns utilize dividend-adjusted prices and are benchmarked directly against the SPDR S&P 500 ETF Trust (SPY). The tracking window covers 10.0 years (November 15, 2016 through November 13, 2026), spanning 40 quarterly filing periods.
Baseline Portfolio Characteristics#
Over the 10-year tracking window, Baupost’s 13F long equity portfolio averaged 31 positions with an average quarterly turnover of 19.1% and a top-10 concentration averaging 74.5%. By comparison, in Q3 2026, Baupost operated with higher concentration (21 positions, top-10 concentration of 77.0%) and lower trading turnover (8.4%).
Performance Breakdown (Nov 2016 – Nov 2026)#
- Baupost 13F Clone CAGR: 5.5%
- S&P 500 (SPY) CAGR: 15.0%
- Annualized Performance Gap: -9.5 percentage points per year
- Cumulative Total Return: Clone +71.2% | SPY +304.7%
- Maximum Peak-to-Trough Drawdown: Clone -41.5% | SPY -23.9%
    10-Year Total Return Comparison (2016 - 2026)
    ---------------------------------------------------
    SPY (S&P 500):  [===================] +304.7% (15.0% CAGR)
    Baupost 13F:    [=====] +71.2% (5.5% CAGR)
    ---------------------------------------------------
Annual Return Breakdown#
| Year | Baupost 13F Clone | SPY Benchmark | Outperformance / Underperformance |
|---|---|---|---|
| 2016* | +0.1% | +3.0% | -2.9% |
| 2017 | +19.2% | +21.7% | -2.5% |
| 2018 | -20.3% | -4.6% | -15.7% |
| 2019 | +11.5% | +31.2% | -19.7% |
| 2020 | -7.5% | +18.3% | -25.8% |
| 2021 | +25.8% | +28.7% | -2.9% |
| 2022 | -27.4% | -18.2% | -9.2% |
| 2023 | +28.1% | +26.2% | +1.9% |
| 2024 | +10.8% | +24.9% | -14.1% |
| 2025 | +20.5% | +17.7% | +2.8% |
| 2026* | +11.7% | +11.5% | +0.2% |
*Partial year period.
Essential 13F Clone Caveats#
A public 13F clone model does not represent Baupost Group's actual fund-level returns: 1. Exclusion of Primary Profit Centers: Form 13F filings disclose only U.S.-listed equities and options. They completely omit Baupost’s primary driver of excess returns: distressed corporate debt, private equity investments, real estate restructurings, foreign non-U.S. equities, and complex reorganization claims (such as Baupost's signature investments in Lehman Brothers and CIT Group bonds in 2009). 2. Omission of Cash Reserves: Klarman maintains cash reserves ranging between 20% and 50% of total fund AUM. The 13F clone assumes 100% long equity deployment, driving higher volatility (e.g., -41.5% max drawdown) without accounting for the drawdown mitigation provided by real-world cash buffers. 3. Data Lag & Coverage Limitations: Filings occur up to 45 days after quarter-end, providing delayed historical snapshots. Furthermore, historical pricing coverage for Baupost's reported U.S. positions averages 63.4% of total reported value; unpriced holdings are excluded and remaining positions reweighted, introducing tracking variance.
What a patient investor can learn#
Baupost Group’s Q3 2026 equity activity provides three tactical principles for long-term value investors:
1. Absolute Valuation Discipline Over Holding Narratives#
Seth Klarman’s full exit of Teleflex (TFX) at a -338.4% margin of safety and partial sale of Alphabet (GOOG) as its price crossed above base intrinsic value ($292.52 vs. $277.40) reflect strict price discipline. True margin-of-safety investing requires trimming or exiting holdings when market pricing exceeds conservative owner-earnings capacity, regardless of business prestige or general market popularity.
2. Evaluating Capex Quality and True Maintenance Costs#
The complete liquidation of Norwegian Cruise Line Holdings (NCLH) illustrates the importance of scrutinizing capital expenditures when total cash outlays dwarf depreciation. When NCLH’s TTM total capex of $2.7 billion produced a post-all-capex cash drain of -$0.7 billion, Baupost exited. When total capex severely outpaces depreciation over extended periods, conservative investors must question whether growth capex is actually unacknowledged maintenance upkeep required to maintain competitive positioning.
3. Independence from Benchmark-Relative Tracking#
Baupost's net selling activity ($320.6M net equity reduction) underscores Klarman's refusal to manage capital against short-term relative equity indexes. Investors focused on long-term risk management prioritize downside capital preservation over benchmark tracking, accepting structural cash drag during speculative market phases to retain liquidity for future market dislocations.
Key numbers#
- Reported U.S. Long Equity Portfolio Size: $5.05 Billion (down 6.8% from $5.42 Billion in Q2 2026).
- Total Position Count: 21 U.S. long equity positions (2 new, 6 added, 4 trimmed, 4 sold out).
- Portfolio Concentration: Top 10 holdings represent 77.0% of total reported U.S. equity value.
- Q3 Net Trading Activity: Net seller of $320.6 Million (Bought ~$439.4M, Sold ~$760.0M; Turnover ~8.4%).
- Largest Core Holding: Amazon.com Inc. (AMZN) valued at $932.8 Million (18.5% of equity portfolio).
- Largest Q3 Exit: Teleflex Incorporated (TFX) — sold out $178.6 Million position (-338.4% margin of safety).
- Largest Q3 Addition: Honeywell Aerospace Inc. (HONA) — new position of $175.4 Million (3.5% of portfolio).
- 10-Year 13F Clone CAGR: 5.5% vs. S&P 500 (SPY) 15.0% (annualized tracking gap of -9.5 percentage points).
Regulatory Disclosures & SEC Form 13F Limitations#
SEC Form 13F Limitations#
SEC Form 13F filings require institutional investment managers controlling over $100 million in U.S. equity assets to disclose long equity positions, convertible debt, and options holdings within 45 days of each calendar quarter end. Form 13F filings represent historical snapshots as of September 30, 2026, and do not reflect transactions executed post-quarter end. 13F filings explicitly omit non-U.S. equity securities traded on international exchanges, fixed income securities, distressed credit instruments, private investments, short positions, and cash balances. Consequently, 13F data do not represent total fund performance or comprehensive net risk exposure.
Legal Disclaimer#
DeepValues Research is published by LuLu Ventures LLC. Content is strictly for educational, informational, and research purposes only and does not constitute financial, legal, tax, or investment advice. No financial decision or equity transaction should be executed based on the contents of this report. Past performance metrics and intrinsic value models do not guarantee future returns.

Watch
Source links
- Alphabet (GOOG) Stock Analysis & Intrinsic Value: Neutral
- DEEPVALUES 13F WORKSHEET: Seth Klarman (Baupost G…
- EDGAR Filing Documents for 0001061768-26-000015
- Seth Klarman - Wikipedia
Watch & listen
- Klarman Dumps Teleflex, Buys $175.4M of Honeywell YouTube · EN
- Klarman Dumps Teleflex, Buys $175.4M of Honeywell | Investor Playbook Podcast · EN
- 克拉曼清倉Teleflex:股價155美元,內在價值僅35美元 YouTube · 中文
- 克拉曼清倉Teleflex:股價155美元,內在價值僅35美元|投資大師心法 Podcast · 中文